

 PDF
PDF ePub
ePub Citation
 Print
Print


INTRODUCTION
Non-alcoholic fatty liver disease (NAFLD) is the most common cause of abnormalities in liver function and imaging detected by ultrasonography.12 The prevalence of NAFLD is assumed to be 20–30% in Western countries, and the incidence in Asian countries is rapidly increasing in parallel with the westernization of lifestyle.345 The main concern over NAFLD arises from its tight correlation with metabolic disorders such as obesity, dyslipidemia, and type 2 diabetes mellitus (T2DM).6789
Previous studies have revealed the relationship between NAFLD and insulin resistance and/or T2DM.1011 In addition, several recent studies have shown that NAFLD per se can predict future development of T2DM.121314 However, all of these studies investigated the presence of NAFLD through ultrasonography, a crude method for detecting hepatic steatosis that requires more than 30% hepatic lipid for detection and is highly subjective with respect to operator's skill.15
Controlled attenuation parameter (CAP) is a non-invasive diagnostic method that digitizes the amount of hepatic fat, based on the properties of ultrasonic attenuation by hepatic fat, using the central frequency of the Fibroscan® M probe.16 In several previous studies on various chronic liver diseases, CAP showed significant correlation with hepatic steatosis and considerable diagnostic performance for grading the degree of steatosis.17181920 Therefore, this novel parameter enabled researchers to investigate the prevalence and severity of NAFLD through quantitative measurement of hepatic steatosis with high sensitivity.
In the present study, we investigated the following by using CAP 1) the prevalence and the severity of NAFLD according to the glucose tolerance status, and 2) factors involved in the association between NAFLD and T2DM.
MATERIALS AND METHODS
Patients
We examined the data of 372 subjects who underwent a health check-up from November 2011 to February 2013 at Severance Hospital, Yonsei University College of Medicine, Seoul, Korea. Subjects who underwent both laboratory testing of biomarkers for T2DM and CAP were included. The following exclusion criteria were applied.
1) Subjects with chronic liver disease of any etiology other than NAFLD [positivity for hepatitis B surface antigen (HBsAg; n=4) or hepatitis C antibody (anti-HCV; n=2)]
2) Subjects with potential risk for developing secondary hepatic steatosis [excessive (>20 g/day) alcohol consumption (n=20), medications (n=4; steroid, n=3; tamoxifen, n=1)]
3) Unreliable liver stiffness value (LSV) or LSV measurement failure (n=2)
After excluding 32 of 372 participants, a total of 340 subjects were included in the final analysis. This study was approved by the independent Institutional Review Board of Severance Hospital of Yonsei University College of Medicine and conformed to the ethical guidelines of the 1975 Helsinki declaration. All patients signed a written informed consent.
Medical examinations and laboratory tests
Anthropometric data, such as body mass index (BMI) and systolic and diastolic blood pressure, were measured. A questionnaire was given to all participants to investigate family history of diabetes mellitus, frequency and amount of alcohol consumption, and smoking status (never, past, current). T2DM was defined as fasting glucose ≥126 mg/dL, and/or 2-hour post-loading glucose ≥200 mg/dL, and/or hemoglobin A1c (HbA1c) ≥6.5%, or history of glucose-lowering medications. The prediabetes group included subjects with impaired fasting glycemia (fasting glucose 100 to 125 mg/dL) and/or impaired glucose tolerance [75 g oral glucose tolerance test (OGTT), 140 to 199 mg/dL], and/or HbA1c 5.7 to 6.4%.21 Hypertension was defined as taking anti-hypertensive medication or blood pressure higher than 140/90 mm Hg at initial examination. Metabolic syndrome was defined according to the criteria established by the National Cholesterol Education Program Adult Treatment Panel III, except for the determination of abdominal obesity by waist circumference. We used a waist circumference cutoff level based on the report by the International Diabetes Institute/Western Pacific World Health Organization/International Obesity Task Force. Metabolic syndrome was diagnosed if three of the five following features were satisfied: 1) waist circumference >90 cm in men and >80 cm in women; 2) triglycerides ≥150 mg/dL (1.7 mmol/L); 3) high-density lipoprotein (HDL) cholesterol <40 mg/dL (1.03 mmol/L) in men and <50 mg/dL (1.29 mmol/L) in women; 4) blood pressure ≥130/85 mm Hg; and 5) fasting plasma glucose ≥100 mg/dL (5.6 mmol/L).
The laboratory tests included serological tests for HBsAg, anti-HCV, aspartate aminotransferase, alanine aminotransferase (ALT), total bilirubin, gamma glutamyltranspeptidase (GGT), and lipid profiles (triglycerides and total HDL, and low-density lipoprotein cholesterol). Biomarkers related to T2DM included fasting glucose, fasting insulin, fasting C-peptide, HbA1c, glycoalbumin, homeostasis model assessment of insulin resistance of insulin resistance (HOMA-IR), homeostasis model assessment of beta cell function (HOMA-β), and high sensitive C-reactive protein (hs-CRP). HOMA-IR was calculated as fasting serum insulin (IU/dL)×fasting serum glucose (mg/dL)/22.5, and HOMA-β as [20×fasting serum insulin (IU/dL)]/[fasting serum glucose (mg/dL)-3.5].
Imaging tests
All subjects underwent abdominal ultrasonography and transient elastography (FibroScan®, EchoSens, Paris, France). Abdominal ultrasonography was performed by two experienced hepatologists. Liver steatosis by ultrasonography was assessed as absent, mild, moderate, or severe on the basis of the liver-kidney difference in echo amplitude caused by abnormally intense echoes arising from the hepatic parenchyma due to liver fat, echo attenuation by fat into the deep portion of liver, and blurring of the blood vessel structures in the liver.22 Two hepatologists who performed ultrasonography independently reviewed all ultrasonographic findings. In cases of discrepancy, a final consensus opinion was adopted.
CAP and liver stiffness measurement were performed on the right lobe of the liver through the intercostal spaces with subjects lying in the dorsal decubitus position with the right arm in maximal abduction by one experienced technician who was blind to the subjects' clinical data. The principle of CAP calculation has been described previously.23 Briefly, CAP measures ultrasonic attenuations by the liver fat at 3.5 MHz using signals acquired by the FibroScan®, and is simultaneously calculated with LSV using the same signals. CAP value and LSV are expressed as dB/m and kPa, respectively. The median values of successful measurements were selected as the representative CAP values and LSV. The interquartile range (IQR) was defined as the interval containing 50% of valid measurements between the 25th and 75th percentiles. As an indicator of variability, the ratio of the IQR of CAP values and LSV to the median (IQR/Mcap and IQR/M, respectively) was calculated. In this study, only measurements with at least 10 valid shots and a success rate of at least 60% were considered reliable and were used for statistical analysis.24 A CAP value of 250 dB/m was selected as the cutoff for presence of steatosis and a CAP value of 300 dB/m was the cutoff for moderate to severe steatosis.20
Statistical analysis
Data are expressed as means±standard deviation, median (range), or n (%), as appropriate. Categorical data were compared using chi-square test and continuous data were compared with independent t-test. Differences of median CAP values according to diabetic group were analyzed with the Kruskal-Wallis test. Binary logistic regression analysis was used to identify the factors associated with T2DM. Correlations between CAP value and biomarkers related to T2DM were evaluated by Spearman correlation coefficients. A one-way analysis of variance was performed to compare HOMA-IR and fasting C-peptide according to CAP groups (CAP value <250 vs. CAP value 250–300 vs. CAP value ≥300). All statistical analyses were performed using SPSS 19.0 (SPSS Inc., Chicago, IL, USA) and two-sided p-values <0.05 were considered significant.
RESULTS
Baseline characteristics
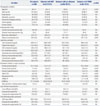
Among the 340 participants (191 men and 139 women), 66 (19.4%) subjects had T2DM. Among 274 (80.6%) subjects without T2DM, 202 (59.4%) had pre-diabetes and 72 (21.2%) showed normal glucose tolerance (NGT). The baseline characteristics of study subjects according to patients with and without T2DM are shown in Table 1. According to the glucose tolerance status, patients with T2DM rather than patients with pre-diabetes or NGT were more likely to be older and male (both p<0.05). These subjects also had higher BMI, waist circumference, and triglyceride level, as well as elevated biomarkers related to T2DM (fasting glucose, fasting insulin, fasting C-peptide, HbA1c, glycoalbumin, and HOMA-IR) (all p<0.05). CAP values and LSV were also significantly higher in patients with T2DM than those with pre-diabetes or NGT (CAP values, 264.5±56.1 dB/m vs. 246.9±47.4 dB/m vs. 227.3±47.5 dB/m, p<0.001; LSV, 5.5±3.5 kPa vs. 4.6±1.6 kPa vs. 4.4±1.7 kPa, p=0.003).
Prevalence of NAFLD according to the glucose tolerance status
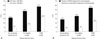
The proportion of subjects with presence of NAFLD (CAP value ≥250 dB/m) increased according to the glucose tolerance status [31.9% (n=23) in NGT; 47.0% (n=95) in pre-diabetes, 57.6% (n=38) in T2DM; NGT vs. pre-diabetes, p=0.027; NGT vs. T2DM, p=0.003; pre-diabetes vs. T2DM, p=0.157]. The proportion of subjects with moderate to severe NAFLD (CAP value ≥300 dB/m) also increased according to the glucose tolerance status (9.7% in NGT, 15.3% in pre-diabetes, 33.3% in T2DM; NGT vs. pre-diabetes, p=0.321; NGT vs. T2DM, p=0.001; prediabetes vs. T2DM, p=0.02) (Fig. 1A). In addition, the proportion of subjects with NAFLD diagnosed by ultrasonography differed according to the glucose tolerance status (27.8% in NGT, 35.6% in pre-diabetes, 54.5% in T2DM; NGT vs. pre-diabetes, p=0.425; NGT vs. T2DM, p=0.024; pre-diabetes vs. T2DM, p=0.057). The proportion of subjects with moderate to severe NAFLD diagnosed by ultrasonography also increased accord ing to the glucose tolerance status (6.9% in NGT, 8.4% in prediabetes, 22.7% in T2DM; NGT vs. pre-diabetes, p=0.406; NGT vs. T2DM, p=0.031; pre-diabetes vs. T2DM, p=0.044) (Fig. 1B).
Severity of NAFLD according to the glucose tolerance status
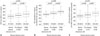
Subjects with T2DM had significantly higher median CAP values than those with NGT (265 dB/m vs. 231 dB/m, p<0.001) or pre-diabetes (265 dB/m vs. 245 dB/m, p=0.003). The median CAP value was significantly higher in the pre-diabetes group than in the NGT group (245 dB/m vs. 231 dB/m, p=0.001) (Fig. 2A). In subjects with NAFLD (CAP value ≥250 dB/m), the median CAP values increased according to the glucose tolerance status: 259 dB/m in NGT, 278 dB/m in pre-diabetes, and 304 dB/m in the T2DM group (comparison between groups; T2DM vs. NGT, p=0.006; T2DM vs. pre-diabetes, p=0.026; prediabetes vs. NGT, p=0.077) (Fig. 2B). In subjects with NAFLD (diagnosed by ultrasonography), the median CAP values also increased according to the glucose tolerance status: 265 dB/m in NGT, 278 dB/m in pre-diabetes, and 302 dB/m in the T2DM group (comparison between groups; T2DM vs. NGT, p=0.042; T2DM vs. pre-diabetes, p=0.047; pre-diabetes vs. NGT, p=0.484) (Fig. 2C).
Factors associated with T2DM
In univariate binary logistic regression analyses, T2DM was significantly associated with fasting glucose, fasting insulin, fasting C-peptide, HbA1c, glycoalbumin, and HOMA-IR (all p<0.05). In addition, among all variables described in Table 1, T2DM was associated with age, male gender, BMI, waist circumference, triglyceride, HDL-cholesterol, LSV, and CAP value (all p<0.05).
Multivariable logistic regression analysis was performed to control for other established risk factors for T2DM and to determine whether CAP value was independently associated with T2DM (Table 2). After adjusting for age, gender, BMI, waist circumference, triglyceride, HDL-cholesterol, and LSV, subjects with CAP value ≥300 dB/m were found to have a 2.8-fold higher risk of having T2DM than those with CAP value <250 dB/m [p=0.017; odds ratio (OR)=2.83; 95% confidence interval (CI), 1.21–6.64]. Subjects with a CAP value of 250–300 dB/m had a very similar risk of developing T2DM as those with CAP value <250 dB/m (p=0.374; OR=1.10; 95% CI, 0.59–2.16). As expected, age was also closely related to the risk of T2DM (p<0.001; OR=1.07; 95% CI, 1.04–1.11). However, gender, BMI, waist circumference, triglycerides, HDL-cholesterol, and LSV showed no significant associations with T2DM.
Correlation between CAP value and baseline factors
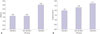
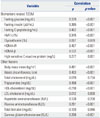
Biomarkers related to T2DM and other factors were measured in all subjects (n=340) to investigate their correlation with CAP value (Table 3). Among biomarkers related to T2DM, CAP value showed significant correlation; HOMA-IR (ρ=0.407, p<0.001) and fasting C-peptide (ρ=0.402, p<0.001). In addition, CAP value showed a correlation with fasting insulin (ρ=0.395, p<0.001), fasting glucose (ρ=0.379, p<0.001), HbA1c (ρ=0.345, p<0.001), hs-CRP (ρ=0.277, p=0.001), and HOMA-β (ρ=0.132, p<0.001). Among other factors, CAP value showed significant correlation with BMI (ρ=0.491, p<0.001), triglycerides (ρ=0.458, p<0.001), and waist circumference (ρ=0.403, p<0.001). Moreover, CAP showed a correlation with ALT (ρ=0.291, p<0.001), GGT (ρ=0.268, p<0.001), HDL-cholesterol (ρ=-0.218, p<0.001), and total bilirubin (ρ=-0.109, p=0.046). HOMA-IR was significantly higher in the group with CAP value ≥300 dB/m than in the groups with CAP value between 250–300 or CAP value <250 dB/m (HOMA-IR, 3.00±1.99 vs. 1.64±1.04 vs. 1.63±2.59, respectively; p<0.001) (Fig. 3A). Subjects with a CAP value >300 dB/m showed significantly higher fasting C-peptide than those with CAP value between 250–300 dB/m or <250 dB/m (fasting C-peptide; 2.71±0.95 ng/mL vs. 2.29±1.62 ng/mL vs. 1.97±0.88 ng/mL, respectively; p<0.001) (Fig. 3B).
DISCUSSION
The important findings of the present study are 1) subjects with T2DM had a more severe degree of NAFLD, as represented by CAP value, than those with NGT; 2) hepatic fat was a significant risk factor for T2DM; and 3) a clear association between hepatic fat and insulin resistance was demonstrated.
In our study, subjects with T2DM had higher BMI, higher triglycerides, and lower HDL cholesterol level than those without T2DM, thus presenting a higher metabolic risk in general. The higher mean CAP value in subjects with T2DM in our study can be explained in the same context and the metabolic significance of the CAP value was also demonstrated by its significant correlation with BMI (ρ=0.491, p<0.001), triglycerides (ρ=0.458, p<0.001), and waist circumference (ρ=0.403, p<0.001). Therefore, CAP value may be an additional parameter that can supplement the traditional variables representing metabolic risk. In addition, considering the fact that NAFLD is now accepted as a hepatic manifestation of metabolic syndrome, the CAP value would likely be used as a unique metabolic parameter that specifically targets the liver.
Subjects with T2DM had a high prevalence of NAFLD, approximately 60%.2425 Using CAP as a tool, the present study confirmed that the prevalence of NAFLD increases according to the glucose tolerance status (31.9% in NGT, 47.0% in pre-diabetes, and 57.6% in T2DM), which was compatible with the previous study.26 Specifically, the prevalence of NAFLD was higher when it was diagnosed by CAP than ultrasonography, because CAP is a sensitive method for detecting small amount (less than 20%) of hepatic fat. In addition, we found that the severity of NAFLD represented by CAP value increased in subjects with T2DM. As far as we are aware of, this is the only study to demonstrate quantitative differences in the accumulation of hepatic fat according to glucose tolerance status.
In the present study, we investigated the correlation between CAP and T2DM-related biomarkers to explain the association between the incidence of T2DM and prevalence of NAFLD, as well as the differences in hepatic fat accumulation according to glucose tolerance status. Among all T2DM-related biomarkers, the association between CAP value and HOMA-IR was the strongest. Therefore, HOMA-IR may play a key role in linking hepatic fat to the incidence of T2DM. Previous studies have reported that hepatic fat plays a key role in the impairment of insulin-mediated inhibition of hepatic glucose production that leads to insulin resistance.27 The mechanism of this NAFLDassociated hepatic insulin resistance was investigated by measuring hepatic glucose and insulin using a low-dose hyperinsulinemic-euglycemic clamp combined with a glucose tracer. 282930 In patients with NAFLD, endogenous glucose production was normal but peripheral glucose disposal was markedly decreased due to impaired glucose oxidation and glycogen synthesis.
Transient elastography, which was used to measure CAP in this study, is a simple, reproducible, non-invasive tool1620 that demonstrated a very strong relationship with insulin resistance, a main causative factor of T2DM, and a factor associated with obesity. Therefore, it has substantial clinical implications as a monitoring tool for NAFLD, and the change in the amount of hepatic steatosis in association with an improvement or deterioration in insulin resistance can be dynamically monitored using the CAP value during follow up.
There are several limitations in this study that should be acknowledged. The inclusion of participants who are able to afford a health check-up in a tertiary hospital may imply selection bias toward older age and high economic status. For this reason, our participants tended to show a higher prevalence of T2DM compared with the general population.31 Second, the cross-sectional approach of the present study precludes solid conclusions on the relationship between CAP value and biomarkers related to T2DM and on prediction of the prognosis of subjects with T2DM according to the degree of hepatic steatosis. Therefore, there is a need for further study that validates our data using a large sample cohort with a well-balanced spectrum of age and economic status and is designed in a longitudinal manner.
In conclusion, this study proved that subjects with T2DM had a higher prevalence of severe NAFLD than those with NGT. Moreover, increased hepatic steatosis was significantly associated with the presence of T2DM, and insulin resistance induced by hepatic fat may be an important mechanistic connection. Longitudinal prospective studies are necessary to investigate the clinical implication of the relationship between CAP value and T2DM-related biomarkers and their association with the prognosis of T2DM.

 XML Download