

 PDF
PDF ePub
ePub Citation
 Print
Print


INTRODUCTION
According to data released by the Centers for Disease Control and Prevention, ovarian cancer (OC) was ranked the fifth cause of cancer-associated death in women in the USA,1 and 14270 cases of deaths from OC were reported in that country in 2014.2 Many prognostic methods have been evaluated in attempts to identify the most reliable diagnostic strategies for treating women with OC.3,4 Among these, tumor stage and the degree of lymphatic invasion (LI) have been considered to be determinants for overall survival.4,5,6 However, there is a need for better prognostic indicators, because the tumor stage merely indicates how the cancer cells have spread in the body but does not predict their response to chemotherapy.
The improvement of methods for analyzing a large set of gene expression data has provided useful insights for cancer treatment.7,8 Although there have been several relevant studies for OC,9 there have been only a limited number of gene expression studies to suggest a clinical subclassification associated with survival or treatment strategies. A recent study using The Cancer Genome Atlas (TCGA) described prognostic gene expression profiles in patients with OC.10 Among 193 suggested prognostic marker genes, only four common genes were validated in three different sets (p<0.05), and none of them was validated with more strict statistical criteria (p<0.01).10 This reflects the difficulty of finding representative marker genes for overall survival among patients with OC. Subgroup analysis may show either consistent or largely different results among different categories of patients.11 We hypothesized that prognostic indicators might vary between patients with and without LI, because different sets of co-regulated genes were induced with the activation of different pathways related to invasion.12 In this study, we divided patients with OC into subgroups with or without LI and analyzed those significantly differentially expressed genes (DEGs) that were linked with 5-year survival.
MATERIALS AND METHODS
Patients
We analyzed data from 98 patients with serous OC using the TCGA datasets. Gene expression profiles were produced on an Affymetrix Human Genome U133 Array (Affymetrix, Inc., Santa Clara, CA, USA). Between 1995 and 2010, 489 clinically annotated patients with high-grade serous OC at tumor stages II–IV underwent surgery before systemic treatment. All patients received a platinum-based agent. Among 489 patients, the clinical annotation of 309 patients did not contain information on LI, and no information on 5-year survival was available for 82 patients. For patients with LI phenotypes described as 'lymphatic invasion' and 'lymphovascular invasion indicator' in the TCGA database, only 98 had LI, and for those we can trace possible 5-year survival, only 63 had LI and 35 did not. All patients were classified as having grade II or IV tumors. The patients were followed until 25 August 2010.
Gene expression analysis
We performed microarray gene expression analysis for these patients using the TCGA database with Bioconductor R.13 Background adjustment was carried out employing the Robust Multi-Array Analysis algorithm from the 'affy' package for preprocessing, and the 'limma' package for differential expression analysis.
Statistical analysis
We identified significant DEGs between patients with and without 5-year survival and those with or without LI. The p-values were adjusted using the Benjamini-Hochberg method. Two-sided Student's t tests were applied, and statistical criteria of p<0.01 or p<0.001 were used as thresholds to determine the significance of any differences in gene expression.
Hierarchical clustering and heat maps
Hierarchical clustering (HC) analysis was performed based on Pearson correlation coefficients in the expression pattern of genes. For gene clustering, we used 'pvclust' in the R package to assess any uncertainty of HC analysis.14 For each HC result, p-values were calculated using multiple bootstrap resampling.
Function analysis
We performed Gene Ontology annotations and Pathway Mapping of DEGs using the DAVID program.15 We used the Pathway category provided by DAVID for analysis of pathways that were overrepresented by three genes (EPAS1, WNT6, and PIK3R1) as 5-year survival-related DEGs for patients with OC without LI.
Regression analysis
Statistical analyses were performed using the R package (above). Multiple linear regression analyses were considered in modeling predictions of the 5-year survival score by the expression of five marker genes among patients with serous OC without LI. The five marker genes were selected by a combination of pathway-associated DEGs and rank correlation analysis. Pearson's correlation coefficients were also calculated to assess the associations between five marker genes (WNT6, EPAS1, SWAP70, PIK3R1, and IGFBP2) and 5-year survival outcomes. Receiver operating characteristics (ROC) curves were analyzed using IBM SPSS Statistics (version 23, IBM Corp., Armonk, NY, USA).
RESULTS
In total, 180 patients (116 with and 64 without LI) were enrolled in the study using the TCGA database. Among the enrolled patients, 82 (53 with and 29 without LI) were excluded from the analysis because their follow-up period was less than 5 years. Finally, 98 patients (63 with and 35 without LI) were analyzed in this study (Table 1).
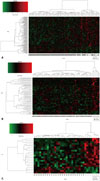
We divided these 98 patients into two groups: those who survived for 5 years and those who did not. We identified 133 DEGs (Supplementary Table 1 and 2, only online) between the survival and nonsurvival groups. As shown in the heat map in Fig. 1A, clustering of these DEGs could not clearly distinguish the survival from the nonsurvival groups.
We tried to identify DEGs in subgroups of respective OCs with and without LI. As shown in the heat map (Fig. 1B), 55 DEGs (Supplementary Table 1 and 3, only online) identified from the patients with LI could fairly well divide the survival from the nonsurvival groups. However, measurements of Manhattan distance and Pvclust dendrograms indicated that the patients with LI could not be clearly divided into survival and nonsurvival groups by the expression pattern of these 55 DEGs (data not shown).
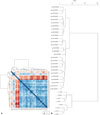
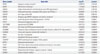
We conducted the same analysis for 35 patients with OC without LI, and 20 DEGs were identified (Table 2, Supplementary Table 1, only online). The heat map (Fig. 1C) showed an obvious difference in the expression patterns between the survival and nonsurvival groups. Results from a Manhattan distance plot (Fig. 2A) and HC dendrogram (Fig. 2B) confirmed that patients without LI could be clearly classified into 5-year survival and nonsurvival groups by these DEGs.
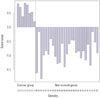
Pathway analysis showed that among the 20 DEGs, EPAS1, WNT6, and PIK3R1 were associated with cancer and renal cell carcinoma pathways (Table 3). To gain further insight, we selected five genes (WNT6, EPAS1, SWAP70, PIK3R1, and IGFBP2) among 20 DEGs whose expression showed strong correlation with the 5-year survival pattern. After normalization to the expression of five housekeeping genes (ACTB, GAPDH, RPLP0, GUSB, and TFRC) found in both tumor and normal tissues in equivalent amounts, we formulated one equation to predict the 5-year survival scores for five marker genes using multiple linear regression analysis as follows.
Using H as the mean expression value of the five housekeeping genes, the following factors were derived.
As shown in Fig. 3, all six patients who survived for 5 years showed positive score values, while all 27 nonsurviving patients showed negative values, based on this equation. When comparing the ROC curve estimates, we found high precision for our formula in estimating patient survival (Supplementary Fig. 1, only online)
DISCUSSION
LI has been considered an important predictive component for many cancers. However, our TCGA-based analysis showed that LI alone could not efficiently predict the 5-year survival of these patients with OC. If we could find prognostic markers for the OCs, we could then select patients who would gain an advantage from adjuvant therapy. Therefore, we used expression profiles to detect prognostic markers that could predict the 5-year survival rates, and found that information about the presence of LI alone was not sufficient, but it still affected the efficiency of prediction using gene expression profiling. The clustering of survival and nonsurvival groups from all patients with OC using DEGs was not as clear as the subgroups with or without LI, suggesting that the cancers from each subgroup might have had a different pathophysiology that influenced the survival of the patients. Most previous research on OC has focused on LI, however, none of these studies have attempted to separately analyze the factors influencing survival between patients with or without LI. To our best knowledge, the present study is the first to use OC samples to analyze survival by subgroup with or without LI.
The subgroup of patients without LI could be divided into 5-year survival and nonsurvival groups using the 20 DEGs more clearly and significantly than among all patients with OC or subgroups with LI. The survival score values using five prognostic marker genes (WNT6, EPAS1, SWAP70, PIK3R1, and IGFBP2) among 20 DEGs could efficiently predict the 5-year survival of patients with OC but no LI. Patients with low expression levels of three genes (PIK3R1, EPAS1, and SWAP70) and high expression of two genes (WNT6 and IGFBP2) showed longer survival.
PIK3R1 encodes the 85 kDa regulatory subunit of phosphatidylinositol 3-kinase, which is an important player in cancer development and progression. The PI3K/AKT/mTOR signaling pathway is frequently activated and has been considered as a possible therapeutic target for OC.16,17 A recent meta-analysis showed that high PI3K levels were associated with poor survival in patients with epithelial OC.18 Lower expression of PIK3R1 might lead to downregulation of the PI3K/AKT/mTOR pathway, thereby contributing to the increased survival of patients with OC.
EPAS1, also known as HIF2A, encodes a transcription factor and is induced by hypoxic stress. There have been many publications about the link between hypoxia and cancers. Thus, the level of expression of EPAS1 and genes of its downstream signaling pathways affect the aggressiveness of OC;19 higher expressions of those genes were significantly correlated with poor prognosis, similar to our findings. Better adaption to the hypoxic microenvironment common in solid tumors might explain those findings.
SWAP70 is expressed in various cell types, including activated B-lymphocytes and mast cells.20 Although its role in cancer has not been reported frequently, one recent study showed increased expression of SWAP70 in malignant gliomas and a strong correlation between high expression and poor patient survival.21 Our data also showed that its expression was upregulated in poorly surviving patients with OC but no LI, suggesting a similar mechanism.
WNT6 is a member of the WNT family of genes, which encode highly conserved glycoproteins secreted during embryonic development. The WNT signaling pathway is altered in many types of cancers and is regarded as a good candidate for cancer therapy.21 WNT family members have been generally regarded as poor prognostic factors for patients with cancer because of their effects on cell proliferation, migration, and survival.22 However, there is also a report that elevated levels of the Wnt-5a protein was associated with better outcomes for patients with prostate cancer, similar to our findings.23
IGFBP2 encodes one of the members of the insulin-like growth factor binding (IGFBP) proteins, and its oncogene-like action by activation of Akt signaling has been reported.24 There have been contradictory reports about the prognostic value of circulating and intratumorous IGFBP2 levels.25 A recent report showed that expression of IGFBP2 was associated with better survival in a specific group (body mass index ≤25 kg/m2) of patients with breast cancer.26 The above and our present findings suggest that the prognostic efficacy of gene expression patterns can be useful in specific subclasses of patients, however, further validation studies are needed. Our results suggest that the expression level of these five marker genes might be useful for deciding a prognosis for patients with OC and in making decisions on adjuvant hormonal therapy.
There were not enough data on patients that contained both LI and 5-year survival rates within the open serous OC dataset. Nonetheless, validation of the equation using an independent cohort can be done in the future. We believe that this topic is worthy of future studies, and that our results would be helpful for researchers as well as clinicians in the OC field.


 XML Download