

 PDF
PDF ePub
ePub Citation
 Print
Print


INTRODUCTION
Adolescents are unique in that they are affected by different types of cancers, compared with other age groups, owing to hormonal and physical changes that influence cancer development and responses to treatment.12 In the United States and Europe, more patients are diagnosed with invasive cancer during their second 15 years of life than their first 15 years.134 Cancer has unique characteristics in adolescents, and the distributions of cancer types change dramatically from adolescents to adult age groups.3
Because of the special needs of adolescents, their treatment is now considered a separate category in oncology. They appear to survive leukemia at better rates when treated using protocols designed for children.5 However, their overall cancer survival rates have not appreciably improved in decades, and further research is needed to improve treatment outcomes. The incidence of cancer has increased in adolescents and young adults, who are less likely to receive optimal medical and psychosocial services for various reasons, including limited insurance coverage, delayed diagnosis, lower rates of participation in clinical trials, insufficient psychosocial/supportive care and follow-up care, and limited cancer prevention and early detection.6 Ignorance of the possibility of having cancer and receiving treatment more appropriate for adults also contribute to unimproved survival rates.3 The reasons for lack of adequate care in this patient population are thought to vary widely from country to country; however, this topic requires further study.
Adolescents undergo more dynamic changes in physical and psychosocial development than young adults. During adolescence, numerous unique hormonal, physical, and especially psychological changes occur,7 and psychosocial factors are often responsible for delayed cancer diagnosis.8910 Adolescents can make many of their own decisions and have achieved some independence from their parents, but insufficient experience and information can lead to delays in seeking medical help.8910 Although some previous studies have associated diagnostic delays with decreased survival, others have not.111213 To improve cancer survival rates in adolescents, it is important to better understand the effect of delayed diagnosis on treatment results.
MATERIALS AND METHODS
Study population
Between January 1, 2000 and December 31, 2007, 914 patients aged 0–18 years of age were diagnosed with cancer and treated at Yonsei Cancer Center, Yonsei University Health System, Seoul, Korea. Of these patients, we included 592 patients with the seven most common cancers: acute lymphoid leukemia (ALL), acute myeloid leukemia (AML), non-Hodgkin lymphoma (NHL), central nervous system (CNS) tumors, sarcomas, neuroblastomas (NBs), and Wilms tumor (WT). To minimize heterogeneity in diagnoses of study cohort, we excluded Hodgkin lymphoma, extracranial germ cell tumors, hepatoblastomas, Langerhans cell histiocytosis, and other cancers that had less than 30 patients. CNS tumors included medulloblastomas, primitive neuroectodermal tumors, pineoblastomas, germ cell tumors, and astrocytomas and excluded ependymomas and other less frequent tumors. Medical records showed symptom intervals (SIs) for all 592 patients, but patient delay (PD) for only 322 (54.4%) patients.
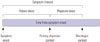
Patients were classified into two groups according to age: adolescents (≥10 years), and children (<10 years). Ten years was chosen as the cut-off because it is the median age of pubertal development.14 We defined SI as the number of days between the first symptoms/signs of disease and date of diagnosis, PD as the number of days between the first symptoms/signs of disease and the date medical help was first sought, and "physician delay (PhyD)" as the number of days between the date medical help was first sought and date of diagnosis (Fig. 1). We defined SI >21 days as a long SI, and SI ≤21 days as a short SI. We calculated patient delay proportion (PDP) as PD divided by SI. If the PDP is over 0.5, it means that PD is composed of higher proportion than PhyD in SI. The PDP cut-off point was 0.6. SI and PDP cut-off points were set using the Contal and O'Quigley method.15 Patients were ultimately classified into one of three groups: short SI, long SI/PDP <0.6, or long SI/PDP ≥0.6.
We also categorized all tumors as low-risk (LR) or high-risk (HR). For leukemia, we used the National Cancer Institute risk group classification, with Philadelphia chromosome-positive ALL, infantile leukemia, and AML with HR karyotypic features classified as HR. Stage 1 and 2 lymphomas were defined as LR, and higher stages of lymphomas as HR. For CNS tumors, grades 1 and 2 (according the World Health Organization classification) were defined as LR, and grades 3 or 4 as HR. For NBs, WTs, and bone and soft tissue sarcomas, we classified non-metastatic disease as LR and metastatic disease as HR.
Statistical analysis
Overall survival (OS) was calculated as the time from the date of diagnosis to death due to any cause (before December 31, 2012). Categorical variables were analyzed using the chi-square test. Continuous variables were analyzed using the Mann-Whitney U test or Kruskal-Wallis test for non-parametric variables and Student t-test or analysis of variance for parametric variables. Survival was analyzed using the Kaplan-Meier method and compared using the log-rank test. Multivariate data analysis was carried out using linear regression and Cox proportional hazard regression. Statistical significance in multivariate Cox models was determined using Wald test. Statistical analysis was performed using SAS version 9.2 software (SAS Institute, Cary, NC, USA).
RESULTS
Patient demographic characteristics
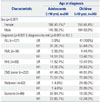
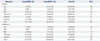
Of the 592 patients analyzed, the mean age at diagnosis was 8.6±5.2 years. Two hundred forty-nine patients received a cancer diagnosis at or after 10 years of age (adolescents), and 343 patients received a cancer diagnosis before 10 years of age (children) (Table 1). In both groups, CNS tumors were the most common cancers. The second most common diagnosis was ALL in children and sarcoma in adolescents. The diagnosis pattern differed between the two groups (p<0.001) (Table 1). ALL was the only cancer type with a statistically significant difference in risk (LR vs. HR) between adolescents and children (p<0.001) (Table 1).
Survival data
The 5-year OS rate for all patients was 71.9±1.9% (Supplementary Fig. 1A, only online). The 5-year OS rates did not differ significantly between adolescents (71.4±2.9%) and children (72.3±2.4%; p=0.874). Patients with NHL had the highest 5-year OS rates (78.0±5.4%), whereas those with AML had the lowest (55.6±8.3%). Five-year OS rates were significantly lower in patients with HR tumors (60.9±2.6%) than LR tumors (88.8±2.1%; p<0.001). They were significantly higher in all patients with long SIs (76.9±2.3%) than in those with short SIs (65.6±2.9%; p=0.001) and in children with long SIs (79.0±3.2%) than short SIs (66.3±3.5%; p=0.002) (Supplementary Fig. 1B, only online). They were also higher in adolescents with long SIs (74.8±3.4%) than short SIs (64.2±5.3%), but this difference was not significant (p=0.141).
SI
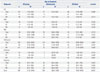
In all patients, the mean SI was 59.7±142.4 days, and the median SI was 21 (0–2034) days. SI was different between LR and HR [median 28 (0–1260) vs. 21 (0–2034); p=0.026]. The median SI was longer in patients with CNS tumors [28 (0–2034) days] and sarcomas [43 (1–730) days] than in patients with other diagnoses (p<0.001) (Table 2).
The median SI was significantly longer in adolescents [28 (0–1260) days] than in children [18 (0–2034) days; p<0.001]. Median SIs were also significantly longer in adolescents with CNS tumors [29 (0–1079) days] or sarcomas [56 (4–454) days] than in children with CNS tumors [25 (0–2034) days; p=0.007] or sarcomas [28 (1–730) days; p=0.001]. SIs significantly differed according to diagnosis in both children (p<0.001) and adolescents (p<0.001). In both groups, sarcoma patients had the longest SIs (Table 2).
SI, PD, and PDP in children and adolescents
Because patients with short SIs had worse OS rates than those with long SIs, we determined how PD affected SIs. PD data were available for 54.4% of the total cohort. PD was significantly longer in adolescents [18 (0–365) days] than in children [7.5 (0–719) days; p<0.001], as was SI as described above. However, PDP was the same in adolescents [0.743 (0–1.0)] and children [0.750 (0–1.0); p=0.743].
We next analyzed survival rates according to the PDP. Children had similar OS rates regardless of the PDP (<0.6, 67.1±5.6%; ≥0.6, 71.2±4.2%; p=0.753), whereas adolescents had worse OS rates when the PDP was ≥0.6 (64.0±5.1%) than <0.6 (81.8±5.8%; p=0.049). In all patients (total cohort, children and adolescents) with short SIs (<21 days) had similar OS rates regardless of the PDP (<0.6, 58.9±6.6%; ≥0.6, 62.8±5.0%; p=0.565). However, patients with long SIs (≥21 days) had significantly higher OS rates when the PDP was <0.6 (86.2±4.5%) than ≥0.6 (72.6±4.2%; p=0.023).
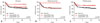
Patients were categorized to short SI (n=261) and long SI (n=170), and then patients with long SIs were further categorized as follows: long SI/PDP <0.6 (n=53) and long SI/PDP ≥0.6 (n=117). We did not stratify the patients with short SIs according to PDP because it did not affect their survival. To show the effect of PDP in patient with long SI, long PDP group was stratified. The proportion of short SI group in children (n=181, 52.8%) was higher than in adolescents (n=80, 32.1%), and the proportion of the long SI/PDP ≥0.6 group (n=65, 26.1%) in adolescents was higher than in children (n=52, 15.2%) (p<0.001) (Supplementary Table 1, only online). There was a significant survival difference among the three groups in the total cohort: the 5-year OS rates in the long SI/PDP <0.6, long SI/PDP ≥0.6, and short SI groups were 86.8±4.7%, 73.3±4.1%, and 65.1±2.9%, respectively (p=0.001) (Fig. 2A). In other words, the patients with long SI but low PDP showed highest survival rates.
In adolescents, OS rates differed significantly according to the SI/PDP category (p=0.026) (Fig. 2B). In pairwise comparisons, OS rates were significantly higher in the long SI/PDP <0.6 group (95.5±4.4%) than in the long SI/PDP ≥0.6 group (67.2±5.9%; p=0.007). More patients with CNS and sarcoma were in the long SI/PDP ≥0.6 group (p<0.001) and more patients with ALL or AML were in the short SI group than patients with other diagnoses (p<0.001); this observation applied to both children and adolescents (Table 3). Adolescents in the short SI group had the highest proportion of late stage (HR) cancers (57/106, 53.8%), whereas those in the long SI/PDP ≥0.6 group had the highest proportion of early stage (LR) cancers (27/61, 44.3%); however, the differences were not significant (p=0.105).
In children, OS rates also differed significantly according to the SI/PDP category (p=0.023) (Fig. 2C). In pairwise comparisons, OS rates were not significantly different in the long SI/PDP <0.6 (80.6±7.1%) and long SI/PDP ≥0.6 (80.8±5.5%; p=0.909). Children in the short SI group had a significantly lower OS rate (63.8±5.4%) than other patients in the SI/PDP groups (p=0.023) (Fig. 2C). In the long SI/PDP ≥0.6 group, there were more children with AMLs, sarcomas, and CNS tumors than with other diagnoses (p<0.001) (Table 3). There was no significant difference between the proportion of children in the SI/PDP gr-oup and tumor stage (data not shown, p=0.783).
Multivariate analysis
A multivariate analysis of children and adolescents was performed. Children in the short SI group tended to have higher hazard ratio than those in the long SI/PDP <0.6 group [2.142; 95% confidence interval (CI), 0.891–5.151] (Supplementary Table 2, only online). The long SI/PDP ≥0.6 and long SI/PDP <0.6 groups showed similar hazard ratio (1.079; 95% CI, 0.388–2.995; p=0.885). High stage was a highly significant independent predictor of OS (hazard ratio, 4.655; 95% CI, 2.560–8.465; p<0.001) in children.
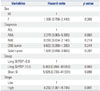
Adolescents in the long SI/PDP ≥0.6 group tended to have higher hazard ratio than those in the long SI/PDP <0.6 group (6.483; 95% CI, 0.864–48.651; p=0.069). The short SI group also tended to show higher hazard ratio (5.505; 95% CI, 0.730–41.531; p=0.098). Patients with AML showed a tendency toward higher hazard, compared with patients with ALL (hazard ratio, 2.279; 95% CI, 0.965–5.383; p=0.060). High stage was significantly associated with higher hazard ratio (4.282; 95% CI, 1.881–9.744; p=0.001) (Table 4).
DISCUSSION
Our study found long SIs to be associated with higher survival rates. We compared SIs and PDs in adolescents and children with cancer. Adolescents in the long SI/PDP ≥0.6 group had worse OS rates than those in the short SI and long SI/PDP <0.6 groups. Adolescent cancer patients are positioned in a gray area between pediatric oncology and adult oncology. In addition, lack of awareness about themselves, their community, and the healthcare system, the paucity of suitable adolescent protocols, and their poor accrual in clinical trials all lead to worse outcomes, such as cancer progression at diagnosis or reduced survival.3589161718 To improve survival, their characteristics require further exploration.
Adolescence is a period of physical and neuroendocrinological development714 that is associated with numerous psychological changes, including development of autonomy, increased affiliation with peers, risk taking, and alcohol and other drug use.7141920 Adolescents may have their health issues less closely monitored by their parents and may be more reluctant to disclose symptoms.22122 These factors cause behavioral changes including health-seeking patterns. Whereas the cut-off age definition of adolescent and young adult in oncology field is 15 years old, the adolescent-associated developmental changes (puberty) begin around 9–10 years of age in both sexes.2324 These changes and consequent behavioral problems in cancer clinics are often encountered by clinicians. Therefore, we chose 10 years as the cut-off age for adolescents (as opposed to children) in our study.
The SI was longer in adolescents than children. CNS tumors and sarcomas were more frequent in adolescents, and these tumors are associated with longer SIs,252627 perhaps owing to their vague or nonspecific symptoms.272829 The SI was shorter in patients with NBs and WTs than in patients with other cancers, which is consistent with the results of a previous study.30 NBs and WTs are more frequent in children than in other age groups. The SI (or diagnostic delay) is generally dependent on the cancer type.313233 Other factors that can affect it are the first contacted healthcare provider, the anatomic site of the tumor, and the age of the patient at diagnosis.34 Some reports did not observe a relationship between SI and tumor type, perhaps because cancer type is a function of diagnostic age and tumor site.34 However, only a small percentage of the variance in SIs (approximately 20%) can be explained by factors other than cancer type.34
Health care systems and geographical differences also affect the SI and PD.223334 Thus, SI data from different countries cannot be easily extrapolated from one country to another. In smaller countries, the health care systems are more homogeneous than in larger countries, and SIs are not generally affected by geographical or system-related issues.2234 In Korea, the health care system is fairly homogeneous. The primary physician for children and adolescents is a pediatrician rather than a general physician. Because of their familiarity with pediatric cancers, pediatricians can reduce the time between the patient's first visit and diagnosis.35 Therefore, PD rather than PhyD is the main determinant of the SI, secondary to tumor type in Korea, and the effect of PD on cancer can be more easily studied in homogeneous medical systems such as those in Korea, compared with large countries.34
We found that survival rates were higher in patients with long SIs than those with short SIs. Longer SIs are generally thought to negatively affect survival, because they may involve more advanced stages of cancer. The fact that long SIs had better survival rates was puzzling. The effect of the SI on survival is controversial and was unresolved in a recent systematic review.3132 Patients with fast-growing, aggressive cancers may become aware of their symptoms earlier than those with slow-growing cancers, resulting in shorter SIs.11123336 Although most of the studies addressing the relationship between SI and survival were retrospective and therefore limited,11313233 a recent study was from the analysis from 2 prospective data.37 This study, which included Ewing sarcoma patients enrolled in prospective trials in France, did not show an effect of SI on survival. However, in their response to this study, Alonso, et al.38 note that reducing diagnostic delays to improve treatment results is possible. Furthermore, there was no PD information in the prospective study in France. Therefore, to evaluate the effect of PD on survival and to perhaps explain the paradoxical effect of SI on survival, we stratified patients according to SI length. We chose a cut-off of 21 days for long versus short SIs, because this is the maximum time required for spontaneous resolution of an acute illness.3940 After 21 days, the patient should seek medical help because unresolved symptoms usually indicate sub-acute to chronic illness.3940
Because patients in the short SI group had the worst survival and the SI and PD could not be shortened further, we analyzed the characteristics of patients with long SIs with the aim of improving their survival by reducing SI or PD. The relationship between PDP and survival differed between children and adolescents. In children with long SIs, the PDP was unrelated to survival, whereas in adolescents with long SIs, a PDP ≥0.6 was associated with worse survival. This result indicates that seeking medical help promptly and undergoing comprehensive follow-ups by primary physicians, and thus decreasing the PDP, can improve the survival of adolescents, compared with children. Moreover, unlike risk factors such as sex, age, stage, and cancer type, PDP and PD can be modified by educating patients and their parents. Medical resources can make patients and family members more vigilant for signs of cancer, and consequent early diagnosis can potentially improve survival rates.22
Previous studies have shown that older patients have longer PDs.2231 This finding is consistent with those of our study of adolescents. Because adolescent patients and their parents cannot always remember when symptoms began and first physician contact was made (parameters required for the calculation of PD), PD cannot be studied easily. The effect of PD on survival has not been studied well,313341 and the effect of PD in adolescents has not been reported previously.3133 According to a systematic review, breast cancer patients with delays of ≥3 months have lower survival rates than those with delays <3 months; however, these patients were not adolescents or children.13 Goyal, et al.36 found that SI did not affect survival outcome but did not analyze the effects of PD or the PDP on survival or the PD/SI relationship. Dang-Tan, et al.22 reported that PD seemed to be prolonged in older patients. Their study was conducted to assess diagnostic delays and PDs in patients <20 years old. It used data from the large registry of the Treatment and Outcome Surveillance component of the Canadian Childhood Cancer Surveillance and Control Program from 1995 to 2000 (2896 patients). The studied parameters were similar to those in our study. However, there was no information on cancer stage, and the effect of diagnostic delay on survival was not shown.
To shorten PDs, we provide the following suggestions. Because adolescents are generally healthy, symptoms are frequently ignored. Adolescents who are aware of their symptoms often do not report them to their parents owing to their growing sense of identity, which is influenced by self-esteem and mood.71014 They also may not access the proper medical services or clinical trials.7842 This indicates the need for public education on the importance of short PDs and routine check-ups. Careful clinical follow-ups by primary physicians after the patient has visited a clinic can facilitate referral to a tertiary care center at the proper time. We have to work to boost adolescents' confidence and increase communication about cancer and other health issues.43
A limitation of our study is its retrospective design, which may have resulted in selection bias. Because we studied patients at only one institution, we did not have a sufficient number of patients to determine the PD/SI effect on the survival rates for specific diagnoses. PD is an interesting parameter, although there were difficulties in collecting relevant data: only 54% of the patients in our study were included in the PD analysis. Imperfect collection of information is frequent in studies of PD.1734 Nevertheless, our study is one of the very few addressing the relationship between survival and PD in adolescents. We reviewed medical records for information about cancer stage and survival rates, and our patients received uniform treatments at one institution. This may lessen heterogeneous multi-institutional effects on survival and enable studies of the effects of SIs and PDs on survival.
In conclusion, adolescents with a long SI/PDP ≥0.6 had lower survival rates than those with a short SI or a long SI/PDP <0.6. Adolescents are recommended to seek medical help for symptoms and signs of cancer to shorten PDs to improve survival outcomes.
 XML Download