

 PDF
PDF ePub
ePub Citation
 Print
Print


INTRODUCTION
Foot deformities are the most common musculoskeletal problem in children with cerebral palsy (CP).1 The most common deformity is equinus foot. Spastic equinovarus foot characterized by limited ankle dorsiflexion with forefoot inversion is also common in children with CP, particularly hemiplegic type.1 Dynamic foot deformities in ambulatory children with CP can lead to inadequate initial heel contact with resultant instability in stance phase and poor foot clearance in swing phase. In addition, the abnormal foot pressure distribution while walking can lead to local pain and callus formation.
Over the last decade, Botulinum toxin type A (BoNT-A) injection for spastic muscles has been widely used in children with spastic CP. In recent systematic reviews, BoNT-A injection has been recommended as a therapeutic choice in the management of dynamic equinus foot in children with CP.23 However, most previous studies used subjective measures to assess the effects of the injection, such as the modified Ashworth scale (MAS)4 and the observational gait scale score, which may have biased the results.56789
Three-dimensional computerized gait analysis is recognized as an objective and reliable tool to measure changes in ambulation after therapeutic intervention. Previous studies using computerized gait analysis after BoNT-A injection for equinus foot in children with CP revealed several significant changes in ankle kinematic data and kinetic data.8101112131415 Although used as a gold standard for planning and assessing the outcome of corrective musculoskeletal surgery in CP patients, the computerized gait analysis system has limited ability to reveal significant changes in foot deformities in the frontal plane such as valgus and varus deformities after therapeutic intervention.1617
Static foot pressure analysis has been utilized in children with CP as a clinical tool for assessing the changes in foot contact pattern in the standing position after BoNT-A injection for dynamic equinus.1819 However, the dynamic foot deformity that occurs during walking may not be adequately assessed using a static technique. Dynamic foot pressure measurement via a computerized insole sensory system is recognized as a reliable tool for assessing dynamic changes of foot pressure distribution while walking.2021 Thus, dynamic foot pressure measurements have been successfully obtained in children with CP to assess pressure distribution while walking.222324 Previous studies demonstrated significant changes in foot pressure distribution using dynamic foot scans after therapeutic intervention for valgus or varus deformities.2324
For equinovarus foot, the tibialis posterior (TP) is the recommended targeted muscle along with the calf muscles for BoNT-A injection in patients with stroke and CP.56252627 To the best of our knowledge, the effects of BoNT-A injection into the TP and calf muscles have not yet been reported in children with CP.
Therefore, the aim of this study was to investigate the effects of BoNT-A injection for dynamic equinovarus foot in children with CP by using computerized gait analyses and foot scans.
MATERIALS AND METHODS
This was a prospective intervention study conducted in a university teaching hospital between October 2012 and May 2014.
Participants
Children with spastic CP who met the following inclusion and exclusion criteria were recruited for this study.
Inclusion criteria were as follows: 1) able to walk independently without assistance [Gross Motor Function Classification System (GMFCS) level I–II], 2) dynamic equinovarus foot leading to foot inversion with heel elevation during walking, 3) MAS ≥2 at ankle plantarflexors with knee extension, 4) ankle range of motion (ROM) with knee extension over neutral position, 5) age >3 years, and 6) able to understand and follow commands.
Exclusion criteria were as follows: 1) chemodenervation therapy within 6 months, 2) previous selective rhizotomy or orthopedic surgery, and 3) history of allergy to the toxin.
Ethical approval was granted by the Institutional Review Board and Ethics Committee of Severance Hospital (#4-2012-0381). Study subjects and their guardians provided written informed consent.
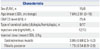
In total, 25 ambulatory children with spastic CP (17 hemiplegic, 8 diplegic; 19 girls, 6 boys), aged 3 to 15 years (mean, 7.64±2.91 years), whose GMFCS level was I or II (GMFCS level I/II: 21/4) participated in this study (Table 1).
Both hemiplegic and diplegic children had unilateral spastic equinovarus foot. Accordingly, BoNT-A was injected into 25 lower legs for spastic equinovarus foot.
Intervention
Local anesthetic (lidocaine cream) was topically applied at the injection site 1 hour before BoNT-A injection. Reconstituted vials containing 200 units of BoNT-A (Neuronox®, Medytox Inc., Cheongju, Korea) with 4 mL of normal saline to provide a solution containing 50 units/mL were prepared for injection. BoNT-A was injected at two points at the medial and lateral heads of the gastrocnemius (GCM) under the guidance of ultrasonography (US) with the child in prone position. The dose ranged from 2.5 to 5.0 units/kg depending on the severity of spasticity (mean±SD=3.86±0.68 U/kg). In addition, BoNT-A was injected into one or two sites in the TP muscle under US guidance using an anterior approach at the upper third point of the tibia, with doses ranging from 0.9 to 2.8 units/kg (mean± SD=1.73±0.54 U/kg).28 All children participated for 30 minutes in a standardized physiotherapy program, which included stretching and strengthening of the ankle plantarflexor and gait training following 4 months after the injections. No electrical stimulation or casting was applied.
Assessments
Clinical measures of spasticity
The muscle tone of the ankle plantarflexor was assessed using the MAS and modified Tardieu scale (MTS) in both knee flexion and extension. The MAS is a 6-point rating scale from 0 to 4 that is used to gauge muscle tone. For statistical analysis, an MAS grade of 1 (+) was converted to 2. Likewise, MAS grades of 2, 3, and 4 were converted to 3, 4, and 5, respectively.
As for the MTS,29 two levels of the angle of ankle dorsiflexion were measured after slow and fast stretches of the ankle joint, referring to R2 and R1 angles respectively. R1 was defined as the point in the ROM where a catch was first felt during a quick stretch of the ankle plantarflexor, while R2 was defined as the total passive ROM of ankle dorsiflexion. R2-R1 represents the dynamic components of spasticity.30 The ankle joint angles for R1 and R2 were measured via manual goniometry using the "neutral-null" method (dorsiflexion angle over neutral position was counted in positive degrees, and plantarflexion over neutral position was counted in negative degrees).
Gait analysis using a computerized gait system
Gait analysis was performed using a computerized gait system (VICON MX-T10 Motion Analysis System, Oxford Metrics Inc., Oxford, UK) to measure kinematic data (angles of pelvis, hip, knee, and ankle joints) and kinetic data (moments of knee flexor and ankle plantar-flexor) during the gait cycle. Subjects were instrumented with passive reflective markers consistent with the VICON Plug-in-Gait model for gait analysis. A trained investigator who had 20 years of clinical experience in gait analysis placed 16 reflective markers on the posterior superior iliac spine, the anterior superior iliac spine, the mid points of the lateral femur, the lateral knee joint axis, and the midpoints of the lateral tibia, the lateral malleolus, the heel, and the dorsal foot between metatarsal heads 2 and 3. Six digital videos were recorded simultaneously from the front, rear, and side while the child walked barefoot at a comfortable walking speed on an 8-m pathway. Data from five trials at a self-selected walking speed were collected for each subject. Each patient was told to look straight ahead and walk as naturally as possible. All data were captured in the gait analysis laboratory. Force-plates (AMTI OR 6-5, Advanced Mechanical Technology, Newton, MA, USA) under the path recorded ground reaction forces during the walking trials with a 1000-Hz sampling frequency, and joint moments were expressed as internal moments to counter the ground reaction force. Data collection continued until the subject achieved at least three "clean" force-plate strikes.
Foot pressure measurement
Dynamic foot pressure measurements using the F-scan system (Tekscan Inc., South Boston, MA, USA) was used to capture the plantar pressure distribution during walking. The pressure was recorded at 50 Hz using a pressure sensitive insole consisting of a 0.15-mm thick sensor with an embedded gridwork of 960 pressure-sensing cells, evenly distributed at 0.5-cm (0.2-in) intervals. After the pressure reading data were saved, pedobarograph data were exported in ASCII using F-scan Research software V6.70 (Tekscan Inc., South Boston, MA, USA). A minimum of five captures per foot were subsequently recorded, and three representative footprints in the middle of the test were selected. The mean values were calculated for all of the following parameters.23
Foot contact pattern
The foot contact pattern, obtained by foot scan, is a useful tool for assessing changes after therapeutic interventions for foot deformities.23 For the overall contact pattern and specific areas of the foot, the most common technique for foot segmentation was described by Bowen, et al.31 in 1998 and has subsequently been used by several authors.2332 This technique consists of rotating the pedobarograph footprint until the projection of the long axis of the foot is vertically aligned. The foot is then divided into five regions: hind-foot, lateral midfoot, medial midfoot, lateral forefoot, and medial forefoot. The center of pressure index (COPI) was calculated with the method described by Oeffinger, et al.33 as the "area of the lateral column divided by the area of the medial column." The COPI in a normal foot has a value close to one.
Pressure time integrals (PTIs)
According to the description from a previous study, the foot was divided into five sections: medial forefoot, lateral forefoot, medial midfoot, lateral midfoot, and heel.23 The area under the pressure/time curve shows the total pressure achieved by each section of the foot; this total pressure was the "impulse" for this study. The relative impulse was defined as the percentage of impulse exerted on each section from the total impulses of the five sections. The relative impulse distributed under the medial column of the foot was the sum of the relative impulses of the medial forefoot and midfoot. Likewise, the relative impulse under the lateral column was the sum of the relative impulses of the lateral forefoot and midfoot. As proposed by Chang, et al.32 and in our previous study,23 we defined the coronal index as the relative impulse in the medial column minus the relative impulse in the lateral column. The coronal index in a normal foot has a value close to zero. The COPI and coronal index reflect the asymmetry of the medial and lateral columns of the foot. The dynamic foot pressure index (DFPI), which was proposed by Bennett, et al.22 as a useful index for tracking the changes after injection for dynamic equinus, was calculated as the ratio of the impulse of the heel to the impulse of the heel and forefoot.
Statistical analysis
SPSS version 20 (SPSS Inc., Chicago, IL, USA) was used for statistical analysis. A one-way repeated-measures ANOVA was used to compare the changes between baseline data and the data at 1 month and 4 months after injection. Bonferroni post hoc tests were applied to further analyze the time factor. The level of significance was set as p<0.05.
RESULTS
Clinical evaluations
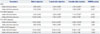
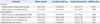
The tone of the ankle joint measured via MAS and MTS showed statistically significant changes. Post hoc analysis demonstrated a significant reduction in spasticity at both 1 and 4 months after injection when compared to baseline data. These findings indicated that the effects of BoNT-A injection on tone reduction were still present at 4 months after injection. However, the statistically significant differences in MAS and MTS with knee flexion between 1 and 4 months after injection observed via post hoc analysis indicated that the effects lessened as the pharmacologic effects of BoNT-A wore off (Table 2). R2-R1 angles of MTS were significantly improved at 1 month after injection compared to baseline, though only in the knee extension position. The GCM is two-joint muscle; thus, the significant improvements in the R2-R1 angle of MTS were apparent only with knee extension, not in the knee flexion position.
Gait analysis using a computerized gait system
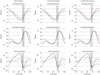
Kinematic data of the ankle joint revealed significant changes after injection (Fig. 1). Post hoc analysis revealed significant improvements in the ankle angle at initial contact, maximal ankle dorsiflexion in stance phase, and mean ankle dorsiflexion during stance phases along with significant reduction of maximal ankle plantarflexion at push-off at both 1 and 4 months after injection compared to baseline. Maximal and mean ankle dorsiflexion angles in swing phase were significantly improved at 4 months after injection compared to baseline.
Regarding foot progression, there were no significant changes in mean and maximal internal rotation during the entire gait cycle.
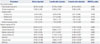
At the proximal joints, there were significant changes in pelvis rotation at initial contact, maximal hip extension in stance phase, and maximal knee extension in mid-stance phase. However, after post hoc analysis, only changes in pelvic external rotation at initial contact at 4 months after injection and maximal hip extension in stance phase at 1 and 4 months after injection were significant compared to baseline data (Table 3). The kinetic data showed significant changes in ankle power generation, specifically between baseline and 4 months after infection, on post hoc analysis (Table 4).
Foot pressure measurement
Foot contact pattern
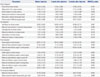
The total foot contact area, contact length, and contact width of the hindfoot showed statistically significant changes. Post hoc analysis demonstrated a significant increase in these parameters 1 month after injection compared to the data before injection. There were also statistically significant changes in COPI after injection with post hoc analysis, demonstrating significant improvement of COPI at 1 and 4 months after injection compared to baseline data. However, there were no significant changes in COPI at 4 months after injection when compared to data at 1 month after injection (Table 5).
Plantar pressure distributions
There were statistically significant changes in the relative impulse of the lateral forefoot, medial and lateral midfoot, heel section of the foot, and DFPI and coronal index. Post hoc analysis demonstrated a significant reduction in the relative impulses of the lateral forefoot and lateral midfoot and a significant increase in the coronal index at both 1 and 4 months after injection, as well as significant enhancement of the relative impulses of the medial midfoot, heel, and DFPI at 1 month after injection, compared to baseline. Post hoc analysis between 1 and 4 months after injection revealed a significant enhancement in the pressure time integrals of the lateral fore-foot and midfoot as well as a significant reduction in the coronal index at 4 months after injection.
DISCUSSION
Dynamic foot deformities are the most common musculoskeletal problem in children with spastic CP.1 BoNT-A injection is widely used as a therapeutic intervention for dynamic foot deformities in patients with CP. A number of studies have demonstrated the benefits of BoNT-A injection for dynamic equinus foot in patients with CP.12131415193435 However, previous studies on the effects of such an injection for dynamic equinovarus foot have rarely addressed children with CP. For dynamic equinovarus foot, TP and calf muscles are the target muscles for BoNT-A injection.36 In patients with stroke, a number of studies revealed the significant benefits of the BoNT-A injection for dynamic equinovarus.562637 Based on previous double blind randomized placebo controlled studies, BoNT-A injection into the TP and calf muscles had significant benefits on tone reduction, gait velocity and walking ability in adults with stroke or focal hypertonia due to various diseases.6263738 However, those studies did not investigate kinematic or kinetic changes using computerized gait analysis or dynamic foot pressure measurements via F-scan. To the best of our knowledge, there has only been one study to date using computerized gait analysis to assess the effects of BoNT-A injection for dynamic equinovarus.7 In that study, BoNT-A was injected into the soleus muscles in eight patients with stroke and into the TP and flexor hallucis longus muscles in half of them; after injection, there a certain degree of improvement in ankle kinematics such as ankle position at initial contact and maximal ankle dorsiflexion during gait, with results comparable to tibial neurotomy.7
In children with CP with dynamic equinus foot, a number of studies have previously demonstrated significant improvements in ankle kinematic parameters101112131539 and kinetic data1012 using computerized gait analysis after BoNT-A injection into the calf muscles. The significant improvements in ankle kinematic data shown in our study were due to the reduction of ankle plantarflexor tone after injection, which contributed to significant improvement in ankle dorsiflexion during gait. These finding are in line with the results of previous studies on the effects of BoNT-A injection for dynamic equinus. Previous studies have investigated changes in ankle kinetic parameters after injection into calf muscles for dynamic equinus101234 and shown that ankle power generation, which represents push-off ability, was improved after injection, although not to a significant level.1234 Boyd, et al.10 demonstrated significant improvement after injection in the ankle power quotient, which is calculated as the ratio between power absorption and power generation.
Our study revealed significant improvements in ankle power generation at 4 months after injection compared to baseline data. The changes of ankle kinetic and kinematic data provide evidence of improved gait pattern and power generation at the ankle after BoNT-A injection. Overall, these findings are compatible with those of previous studies on the effects of BoNT-A injection into calf muscles for dynamic equinus foot. For computerized gait analysis, we adopted the Plug-in-Gait model, a conventional marker set for the VICON motion capture system. This model is unable to measure frontal-plane ankle motion, which is why our study could not demonstrate relevant improvements in foot inversion. However, maximal and mean internal rotation were unchanged, which implies that BoNT-A did not alter foot adduction, which is in turn influenced by the TP.40
On the other hand, the secondary effects of BoNT-A injection for equinus foot on the proximal joints are inconsistent in the literature. After injection into the calf muscles for equinus foot, several studies have demonstrated significant changes in knee kinematic data,1213 while others have not shown significant effects on the knee joint.1339 In addition, the secondary effects of BoNT-A injection on the hip joint have been rarely investigated in children with CP. Only one study has demonstrated a significant secondary effect on the hip joint, specifically an increase in hip flexion at initial contact and hip excursion after injection into the calf muscles, characterized by a more flexed hip during the entire gait cycle.12 The authors of that study assumed that the reduced ankle power caused by the BoNT-A injection led to the need for more hip extensor power, which worsened hip flexion during gait. On the contrary, our study revealed that maximal hip extension during the terminal stance phase increased after BoNT-A injection. Therefore, further studies are needed to delineate the effects of BoNT-A injection for dynamic foot deformities on the knee and hip joints.
Foot deformities result in an abnormal distribution of load on the plantar surface of the foot. The F-scan insole system is a reliable and reproducible method of recording pressure distribution on the foot during walking.202141 Therefore, foot pressure has also been assessed in children with CP as an outcome measure after therapeutic interventions for foot deformities.222324 According a previous study, BoNT-A injection into the calf muscles for dynamic equinus foot in children with CP led to significant improvements in the entire plantar surface area and peak pressure values in the hindfoot.18 Another study also demonstrated significant changes in dynamic foot pressure distribution in the stance phase after BoNT-A injection into the GCM muscles for dynamic equinus with and without casting in children with CP. In that study, the reduction of ankle plantarflexor tone and increase of ankle joint ROM with the therapeutic intervention led to significant improvement of heel contact, which contributed to significant increases in total contact area and DFPI.22 The results of our study also revealed significant improvements in total contract area, contact length, and contact width of the hind foot and also of the relative impulse over the heel and DFPI, which are compatible with the findings of previous studies.
On the contrary, few studies have shown changes in dynamic foot pressure distribution after therapeutic intervention for equinovalgus or equinovarus deformities. According to a previous study,23 the parameters reflecting medial or lateral weight-bearing such as the COPI and coronal index are useful for evaluating foot deformities and changes after therapeutic intervention in the frontal plane, such as in varus and valgus deformities. Our study found a significant reduction in COPI at 1 and 4 months after injection, which indicated that the varus foot contact pattern moved toward a more neutral foot position. The significant decrease in the relative impulse of the lateral forefoot and midfoot and significant increase of the medial midfoot and coronal index suggest improvement in foot pressure distribution after intervention as well. BoNT-A injection into the TP led to a significant reduction of forefoot inversion, which contributed to an improvement in foot pressure distribution during gait, although the posture of the foot, such as forefoot adduction, was not altered according to gait analysis. These findings suggest that dynamic pressure data are useful for tracking the changes in both the frontal and sagittal planes of the ankle and foot after intervention.
Although this is the first report investigating the effects of BoNT-A injection for dynamic equinovarus foot by using computerized gait analysis and foot scans in children with CP, we acknowledge that our study had several limitations. First, our study lacked a control group, and further randomized control trials are needed to address this limitation. In addition, the age of our subjects ranged from 3 to 15 years. In children with CP, the most rapid improvements in gross motor function occur during the first 4 years of life and reach a plateau between 5 and 6 years depending on their disability.42 The age of our study participants likely affected our results, as young children have greater potential for improvement. The extent of the limitations in ROM and hypertonia at the ankle may also be confounding factors affecting the outcomes after BoNT-A injection. Further studies are needed with a larger sample size to delineate the best candidates for BoNT-A injection for dynamic equinovarus foot. BoNT-A injection is a reversible treatment; thus, repeat injections may be needed. In the present study, the follow-up was limited to 4 months after injection. Therefore, the interval of repeat injections and the long-term effects of the injection were beyond the scope of this study. Further study is also needed to address this issue. The other limitation of our study was that MAS, which was the outcome measurement of our study, has several limitations in terms of accuracy and reliability in the measurement of dynamic spasticity. In our study, ankle MAS was improved in both knee flexion and extension; however, the R2-R1 angle of MTS was improved only in the knee extension position. The GCM is a two-joint muscle; thus, the improvements in ankle spasticity with knee flexion may not be expected with BoNT-A injection into the GCM. Therefore, we think that the significant reduction of ankle spasticity after BoNT-A injection can ease the stretching of the ankle joint, and it may result in significant gains in ankle-passive ROM for both knee flexion and extension. In addition, BoNT-A injection into the TP also seems to contribute to significant improvements in ankle ROM with knee flexion.
In conclusion, our study suggested that BoNT-A injection into the TP and GCM had significant benefits in terms of gait parameters and dynamic foot pressure distribution. Further randomized control studies in larger groups of children are necessary to delineate the best candidates for injection in terms of age and the extent of limited ROM and tone.
 XML Download