

 PDF
PDF ePub
ePub Citation
 Print
Print


INTRODUCTION
Colorectal cancer (CRC) is one of the leading causes of cancer-related death worldwide.1 Its prognosis is related to the disease stage at diagnosis and ability to achieve surgical clearance.23 Approximately 80% of the patients present with locoregional disease and 20% show metastatic disease.4 As with other malignancies, CRC is thought to develop through genetic alterations that cause dysregulation of cell growth. Several molecular markers are available for characterization of CRC and some provide information on the therapeutic response and prognosis.5 In particular, epidermal growth factor receptor (EGFR) and its downstream signaling pathways regulate key cellular events that drive the progression of many human tumors, including CRC.67 EGFR is overexpressed in 70-80% of the CRCs and is targeted with a monoclonal antibody, such as cetuximab.8 In many cases, its expression is associated with poor survival.91011 Although determination of EGFR status is critical in cancer treatment, it can be confirmed only after pathological examination. Therefore, noninvasive methods would be helpful to predict EGFR expression.
Positron emission tomography (PET) with 18F-fluorodeoxyglucose (18F-FDG) is a useful tool for staging, restaging, therapeutic response monitoring, and prognostication of CRC.121314 It shows high sensitivity for detecting metastatic disease.1516 Only a few studies have been performed to estimate EGFR status in CRC noninvasively by 18F-FDG PET.
The aim of this retrospective study was to investigate a possible association between 18F-FDG uptake on preoperative PET/CT and EGFR status in primary CRC.
MATERIALS AND METHODS
Subjects
Records of 250 patients with CRC who underwent 18F-FDG PET/CT for staging between 2008 and 2013 at a single institution were reviewed. Those who had received any chemotherapy, radiation therapy, or molecular targeted therapy were excluded. Patients with uncontrolled diabetes mellitus were also excluded. The final analysis included 132 patients. The median duration between preoperative 18F-FDG PET/CT and primary tumor resection was 5.5 days (range=1-20 days). The clinical stage was determined according to the American Joint Committee on Cancer. This study was approved by the Institutional Review Board/Ethics Committee of Hallym University Sacred Heart Hospital, and patient information was de-identified before analysis.
PET/CT
Whole-body PET was performed in a PET/CT scanner (Gemini TF-64, Philips Medical Systems, Cleveland, OH, USA) after intravenous injection of about 5.18 MBq/kg (0.14 mCi/Kg) of 18F-FDG. All patients fasted for at least 6 h previously and presented with a blood glucose level lower than 150 mg/dL. After approximately 1 h, CT images were acquired from the base of the skull to the upper thigh. PET images were obtained immediately thereafter and coregistered with the CT images, allowing the display of PET, CT, and PET/CT images.
Standardized uptake values (SUVs) of 18F-FDG were calculated as follows: SUV=[decay-corrected activity (kBq)/tissue volume (mL)]/[injected 18F-FDG activity (kBq)/body mass (g)]. The region of interest (ROI) was placed manually around the primary tumor and maximum SUV (SUVmax) within the ROI was used to minimize partial-volume effects.
Immunohistochemistry
Immunostaining was carried out in an automated tissue staining system (BenchMark XT; Ventana Medical Systems, Inc., Tucson, AZ, USA) using validated protocols.17 Endogenous peroxidase activity was blocked by hydrogen peroxide before antibody incubation. A combination of ethylenediaminetetraacetic acid and boric acid in Tris buffer (CC1 reagent; Ventana Medical Systems) was applied to tissue sections for antigen retrieval, as needed, before incubation with the primary antibody (anti-EGFR, prediluted; Ventana Medical Systems). The tissue sections were washed and incubated with the primary antibody and then with horseradish peroxidase-conjugated multimer antibody reagent (ultraView universal HRP multimer; Ventana Medical Systems). Antigen detection was performed using diaminobenzidine (ultraView universal DAB chromogen; Ventana Medical Systems), and sections were counterstained with hematoxylin. Tumor cells were considered as EGFR-positive when their staining was more marked than that of the adjacent normal epithelium.
Statistical analysis
Continuous variables were analyzed using Student's t-test, and the results are expressed as mean±standard deviation. Associations of SUVmax, tumor size, and carcinoembryonic antigen (CEA) level (ng/mL) were tested by bivariate Pearson's correlation test. To identify factors associated with EGFR status, Pearson's chi-square test was used in univariate analysis. Multivariate logistic regression was applied to identify associations of clinicopathological parameters and EGFR status. Receiver operating characteristic curves and Youden's index were used to identify threshold values of SUVmax, tumor size, and CEA level with the highest accuracy for predicting EGFR expression. Values of p<0.05 were considered significant. All analyses were performed in SPSS software (version 21.0; IBM Corp., Armonk, NY, USA).
RESULTS
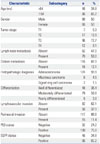
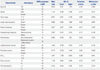
Table 1 shows the patient characteristics. Sixty-six patients (50%) were men, and the median age was 67 years (range=35-89 years). Twenty-four lesions were staged as T1-2 (18.2%) and 108 as T3-4 (81.8%). Lymph node metastases were detected in 70 patients (53.0%). Further, 16 patients showed distant metastases (12.1%): the most common site was the liver (10 cases, 62.5%), followed by the lungs (5 cases) and bone (1 case). Curative bowel resection was performed for single hepatic metastasis, while palliative bowel resection was performed for distant metastases, because of bowel obstruction.
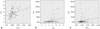
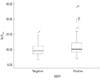
PET showed 18F-FDG hypermetabolism in all the primary tumors. The SUVmax ranged from 3.7 to 36.5 (median, 11.4±5.3). Tumor size ranged from 1.5 to 11.0 cm (median, 5.3±2.0) on pathological examination. Tumor size showed significant positive correlations with SUVmax (r=0.293; p=0.001) (Fig. 1A) and CEA level (r=0.253; p=0.003) (Fig. 1B). No correlation was noted between CEA level and SUVmax (r=0.151; p=0.083) (Fig. 1C). EGFR expression was found in 86 patients (65.2%). Mean SUVmax was significantly higher in EGFR-expressing tumors than in EGFR-negative tumors (12.1±5.7 vs. 10.0±4.2; p=0.012) (Fig. 2).
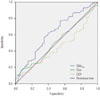
At the SUVmax threshold of 7.5, the sensitivity and specificity for predicting EGFR expression were 84.9% and 40.4%, respectively [area under the curve (AUC)=0.624; p=0.019]. Tumor size (AUC=0.506; p=0.909) and CEA level (AUC=0.445; p=0.296) were not predictive of EGFR expression (Fig. 3).
EGFR status showed no difference with respect to most of the clinicopathological parameters (Table 2). Only SUVmax was significantly associated with EGFR expression (p=0.038). Multivariate logistic regression also revealed SUVmax as an independent predictor of EGFR expression (p=0.041, odd ratio=2.457, confidence interval 95% 1.038-5.816).
DISCUSSION
The utility of 18F-FDG PET has been studied extensively in colon cancer. 18F-FDG is metabolized similarly to glucose and transported intracellularly; once phosphorylated, 18F-FDG-6-phosphate is not processed by the glycolytic pathway and accumulates preferentially in cells with high glucose uptake, such as tumor cells. The accuracies of 18F-FDG PET in the assessment of primary tumors and detection of metastases of CRC have been demonstrated.1618 However, incidental physiological bowel uptake or inflammation may yield a false-positive finding.19 In addition, 18F-FDG PET lacks resolution to evaluate the depth of tumor penetration through the bowel wall.20 Nevertheless, focal intense hypermetabolism is highly suggestive of colon cancer.21
Abdel-Nabi, et al.22 demonstrated that 18F-FDG PET has a sensitivity of 100%, a specificity of 43%, and positive and negative predictive values of 90% and 100%, respectively, for primary CRC. Moreover, Mukai, et al.23 demonstrated that the 18F-FDG PET true positive rate is 95.8% in CRC. In the present study, all the primary tumors were seen on 18F-FDG PET scans, and a significant correlation was found between size and 18F-FDG uptake of the primary tumor (r=0.298; p=0.001). This finding is similar to that of Gu, et al.,24 who showed that SUVmax is significantly related to size and depth of invasion of the primary tumor. They explained this result by the increasing number of tumor cells with increased tumor size. Na, et al.25 also demonstrated that the degree of 18F-FDG uptake is associated with tumor size in primary CRC. The authors consider that 18F-FDG uptake of the primary tumor is correlated with macroscopic and microscopic tumor growth.
Activation of the proto-oncogene encoding EGFR may contribute to transformation of cellular phenotypes and create tumor cells with substantial growth and survival advantages.26 Recently, EGFR status has received much attention because EGFR and some downstream components serve as targets for anticancer therapies. Preclinical data indicate that pharmacological blockade of EGFR is an effective therapeutic strategy in advanced CRC.27 Although EGFR status is a useful tool to predict the therapeutic response, data on its association with 18F-FDG uptake in CRC are insufficient and contradictory. Weihua, et al.28 suggested that glucose uptake is associated with EGFR expression. However, Na, et al.25 found no significant difference in 18F-FDG uptake according to EGFR status in CRC. In the present study, 18F-FDG uptake tended to be higher in primary tumors expressing EGFR. The results also suggest that SUVmax of the primary tumor could indicate EGFR status, despite the low sensitivity and specificity. Larger-scale studies are needed to validate these conclusions.
There were several limitations in this study. First, because of its retrospective nature, selection bias was unavoidable. Second, KRAS and BRAF mutations, potential biomarkers of resistance to anti-EGFR monoclonal antibodies,2930 were not analyzed. 18F-FDG uptake with respect to KRAS and BRAF mutation status should be investigated. Third, we could not evaluate the correlation between EGFR and the molecular markers directly related with FDG uptake such as glucose transporter and hexokinase. Finally, we also could not evaluate the prognostic significance of FDG uptake and EGFR status of primary CRC because of lack of follow-up data. Further large-scale studies are needed.
In summary, preoperative 18F-FDG uptake is slightly correlated with EGFR status in primary CRC. Preoperative SUVmax of 18F-FDG may have a limited role in predicting EGFR expression in such tumors because of its poor specificity.
 XML Download