

 PDF
PDF ePub
ePub Citation
 Print
Print


INTRODUCTION
Allergen immunotherapy is the only treatment that can change the natural course of allergic diseases. Immunotherapy can be a curative treatment for allergic rhinitis or asthma.1 The treatment improves symptom scores, decreases medication costs, and may prevent additional sensitization and progression to asthma.23 In addition, research data on the effectiveness of immunotherapy for atopic dermatitis is increasing.456
The efficacy of immunotherapy is usually determined by clinical outcomes and laboratory findings: specific immunoglobulin G4 (sIgG4), specific immunoglobulin E (sIgE), sIgE/sIgG4 ratio, and IgE-blocking factors. Although the mechanisms are not fully understood, studies support the production of blocking antibodies, such as sIgG4, as one of the key mechanisms of immunotherapy.78 Upon initiation of immunotherapy, regulatory T cells cause B cells to produce sIgG4 instead of sIgE. As a result, IgE-mediated allergic reactions are inhibited by competitive binding of IgG4 against the allergen. As a short term effect, IgG4 starts to increase after one week and continues to increase for up to 1–3 years after treatment.8 As compared to IgG4, IgE levels increases from one week to 6 months after treatment and decrease thereafter.8 IgE-blocking factor, which blocks allergen-sIgE binding, are also known as marker for immunotherapy outcomes.910 Therefore, IgE and IgE/IgG4 ratio decrease, whereas IgG4 increases, as a long term effect of immunotherapy.11
Immunotherapy comprises subcutaneous and sublingual immunotherapy. Subcutaneous immunotherapy (SCIT) is classified into two main types of prescription patterns: American and European styles.212 There are some differences in European and American SCIT, yet both are available in Korea. Specifically, when preparing house dust mite (HDM) SCIT reagent, the European style allows both the mite bodies and feces for the source materials, whereas American style only allows purified mite bodies. Since the allergen extraction and standardization methods are different between these styles, potency units, which demonstrate allergenicity, may differ from company to company. These differences in allergenicity might result in different short-term or long term effects of immunotherapy.
Although source materials and preparation methods are different between manufacturers,12 to our knowledge, there is no research that has compared the immunological changes induced by commercial SCIT reagents. The purpose of this study was to compare the immunological potency of three commercial HDM SCIT reagents in terms of sIgG4, sIgE, and allergen blocking factor levels. Additionally, in order to compare the differences in American and European styles, the Hollister-Stier® (Spokane, WA, USA) product was chosen as a representative of American style and both Tyrosine S® (Allergy Therapeutics, Worthing, UK) and Novo-Helisen® (Allergopharma, Reinbek, Germany) were chosen to represent European style.
MATERIALS AND METHODS
Subjects
The enrollment was retrospectively accomplished at the Allergy and Asthma Center at Severance Hospital in Seoul, Korea. Specialized allergists, dermatologist, and pediatricians work at this center. HDM sensitized patients who were receiving SCIT with three different kinds of reagents were enrolled from 2013 to 2014. Patients whose therapeutic dose had reached a maintenance dose and those without any side effects were selected. HDM sensitization was confirmed by a skin prick test or detection of specific IgE to Dermatophagoides farinae (D. farinae) and Dermatophagoides pteronyssinus (D. pteronyssinus). HDM sensitized patients who were not receiving any immunotherapy were selected as a control group. All the participants provided written informed consent. The Institutional Review Board of the Yonsei University Health System approved this study (No. 4-2013-0397). Sera obtained before and after the SCIT were stored at -70℃.
HDM SCIT reagents
Three kinds of commercially available HDM SCIT reagents were compared: 1) aluminum hydroxide adsorbed Novo-Helisen® depot, 2) Hollister-Stier® aqueous extract, and 3) L-tyrosine adsorbed Tyrosine S®. The three different immunotherapy reagents use independent allergen units. Novo-Helisen® depot is standardized in Therapeutic units (TU), Hollister-Stier® is standardized in Allergy units (AU), and Tyrosine S® is standardized in TU. Information on these SCIT reagents is shown in Table 1.
Dermatophagoides farinae sIgE and sIgG4 measurement
We measured serum sIgE and sIgG4 to D. farinae using the ImmunoCAP® system (ThermoFisher Scientific, Uppsala, Sweden). This measurement system has a detection range from 0.1 kUA/L to 100 kUA/L for sIgE. IgE titers higher than 0.35 kUA/L were designated as positive. For sIgG4, the detection range was 0.07 mg/L to 30 mg/L.
IgE and IgG4 immunoblot using Dermatophagoides farinae
D. farinae protein extract was separated by sodium dodecyl sulfate polyacrylamide gel electrophoresis (SDS-PAGE) using a 15% gel. Standardized D. farinae protein extract was kindly provided by the Yonsei Allergy Institute.13 Separated proteins were transferred to polyvinylidene difluoride membranes (0.45 µm, GE Water & Process Technologies, Trevose, PA, USA) to react with three groups of patient sera (five randomly chosen patients from each group). For inhibition of non-specific binding, the membranes were incubated in 3% skim milk overnight before overnight sera incubation at 37℃. As a secondary antibody, 1:1000 diluted mouse anti-human IgE and IgG4 (Southern Biotech, Birmingham, AL, USA) were incubated for 1 hour. Nitro blue tetrazolium and 5-bromo-4-chloro-3-indolyl-phosphate (Promega, Madison, WI, USA) were used for color development.
IgE blocking factor assay
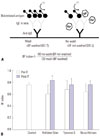
The blocking factor that can inhibit IgE-binding to D. farinae extract was also measured before and after immunotherapy.14 Anti-human IgE antibodies (Sigma-Aldrich, St. Louise, MO, USA, 5 µg/mL) were coated onto a 96-well microplate and kept at 4℃ overnight. After washing with phosphate-buffered saline containing 0.05% Tween 20 (PBST), the plate was incubated for 1 hour in 3% skim milk. The plates were washed with PBST, and patient sera (non-diluted, 50 µL/well, 1 hour) were then added. In order to detect the blocking factor that inhibits IgE binding, the experimental groups were divided into two: wash or no-wash. The experimental procedures were identical in those two groups except that in the no-wash group, the wash step was omitted after the addition of patient sera. Consequently, in the no-wash group, blocking factors left in the sera would inhibit the IgE binding of D. farinae extract. Subsequently, biotinylated D. farinae extract was added as an antigen (10 µg/mL, 1 hour). After washing with PBST three times, horseradish peroxidase conjugated streptavidin (Sigma-Aldrich, St. Louise, MO, USA) was used at a 1:1000 dilution, and then 3,3',5,5'-Tetramethylbenzidine (Kirkegaard & Perry Laboratories, Gaithersburg, MD, USA) was added for color development. The color development was stopped with sulfuric acid and the optical density (OD) was measured at 450 nm. The blocking factor index was calculated using the following formula: blocking factor index=1-(ODno wash/ODwash). Blocking factor index was used for measuring the levels of blocking factors of the three SCIT groups.
Statistical analysis
The data were analyzed using SPSS 18.0 (SPSS Inc., Chicago, IL, USA). For comparison of demographic parameters, Kruskal-Wallis test and Fisher's exact test were used. Dunn's test was performed after Kruskal-Wallis test for multiple comparisons between the four groups. To analyze sIgE, sIgG4, and the blocking factor before and after SCIT, the Wilcoxon signed rank test and repeated-measured ANOVA test were used.
RESULTS
Baseline characteristics
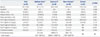
Demographics of the enrolled patients are shown in Table 2. Mean age was 30.1 years old. Males composed 45.8% of the population. Regarding age and sex, there were no significant differences between the three groups. Of the clinical diagnoses, 33% of patients had asthma, 67% had allergic rhinitis, and 29% had atopic dermatitis. Excluding the control patients, 72.2% of atopic dermatitis patients were treated with Tyrosine S® (p<0.001), and 72.2% of allergic rhinitis patients were treated with Hollister-Stier® or Novo-Helisen®. All the participants demonstrated more than 90% compliance to SCIT.
SCIT duration was not significantly different between the groups. Mean maintenance dose of IT in the Hollister-Stier® group was 761.8 AU, which satisfied the recommended dose range (500–2000 AU).15 Tyrosine S® group patients received an average of 14999 TU as a maintenance dose, and the Novo-Helisen® group received an average of 3057 TU.
Changes of sIgE levels after SCIT using ImmunoCAP method
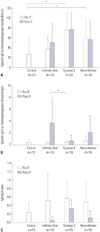
We first compared the immunologic parameters before and after SCIT. Before treatment, sIgE levels to D. farinae were two times higher in the Tyrosine S® group (75.1±36.5 kUA/L) than the Hollister-Stier® group (36.7±27.8 kUA/L) (p=0.001). However, after SCIT, the differences in sIgE levels to D. farinae disappeared (p=0.194). Specific IgE levels to D. farinae were not different between the groups before and after treatment. Novo-Helisen® group showed a slight decrease in sIgE levels to D. farinae, but did not show statistical significance. Results of sIgE are shown in Fig. 1A.
Next, we specifically investigated sIgE levels to the component allergen, Der p2. Before SCIT, it showed the same pattern with D. farinae. The Tyrosine S® group was the highest, followed by Novo-Helisen® and Hollister-Stier® in order. However, sIgE to Der p 2 after SCIT was different from sIgE to D. farinae.
Changes of sIgG4 levels after SCIT using ImmunoCAP method
Contrary to the sIgE pattern, initial sIgG4 levels to D. farinae were not different between the groups (p=0.112). After an average of 13.9 months of SCIT, sIgG4 levels to D. farinae increased in all three IT groups (Fig. 1B). The change was highest in the Hollister-Stier® group: 19.6 fold (p<0.001), followed by Novo-Helisen® and Tyrosine S®. The IgE/IgG4 ratio showed similar patterns with sIgG4 levels to D. farinae (Fig. 1C). All three groups had a decreased ratio of IgE/IgG4, although the degree of decline was highest in the Hollister-Stier® group (p=0.001) (Fig. 1C).
Changes of blocking factor index after SCIT
As mentioned above, blocking factor was checked using the enzyme-linked immunosorbent assay (ELISA) method. A schematic picture of the blocking factor assay is shown in Fig. 2A. The closer blocking factor index reaches to 1, the higher the blocking factors are produced. The Hollister-Stier® group showed significant increases therein after SCIT, compared to baseline (p=0.009) (Fig. 2B). Changes in the other groups were statistically insignificant.
Changes of sIgE and sIgG4 levels after SCIT using immunoblot
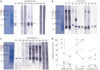
Immunologic responses to major component allergens were also analyzed using immunoblot. Group 2 major allergen (Der f 2) migrates to the 14 kDa band on SDS-PAGE. Immunoblot to detect sIgE against Der f 2 is shown in Fig. 3. Although sIgE titers to D. farinae were not significantly changed in the Hollister-Stier® group (Fig. 1A), Patients H1, H2, H4, and H5 showed decreased IgE reactivity to Der f 2 (Fig. 3A). However, it was not different before and after SCIT in the Tyrosine S® and Novo-Helisen® groups (Fig. 3B and C). Next, we tried to detect sIgE to major component allergen using ImmunoCAP. However, since Der f 2 sIgE is not commercially available from ImmunoCAP, the Der p 2 sIgE was measured instead (Fig. 3D). Der p 2 sIgE levels were decreased in Patients H1, H3, and H5. Note that in Patient H3, the sIgE levels to D. farinae were above the upper detection limit (>100 kUA/L) both before and after SCIT. However, Der p 2 decreased from 46.6 to 35.9 kUA/L. In Patient H5, sIgE levels to D. farinae were the same before and after SCIT both 21.1 kUA/L). However, the Der p 2 sIgE level reduced by half (6.3 to 3.5 kUA/L).
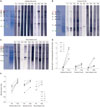
Specific IgG4 immunoblot is shown at Fig. 4. In the Hollister-Stier® group, three out of five patents (Patients 1, 4, and 5) showed increased signal intensity at the 14 kDa band (Fig. 4A). The Tyrosine S® group showed a relatively slight increase of band signal, compared with the Hollister-Stier® group (Fig. 4B). Specific IgG4 level and blocking factor index of the five patients are demonstrated in Fig. 4D and E respectively.
DISCUSSION
Comparing the efficacy of HDM SCIT reagents manufactured by different companies are difficult. First, manufacturers adopt their own allergen potency units that make it hard for clinicians to directly compare their potency.16 Hollister-Stier® expresses allergy potency as AU. Meanwhile, Tyrosine S® and Novo-Helisen® both express allergy potency as TU, although the meanings thereof are different. Tyrosine S® TU is derived from optimal diagnostic concentration of the skin prick test, and Novo-Helisen® TU in comparison is derived from an in-house reference preparation and clinical efficacy.17 Second, source materials are different among SCIT reagent manufacturers due to legislations. For instance, in the USA, pure mite bodies are required by the United States Food and Drug Administration, whereas in the European Medicines Agency allows mite bodies and feces.18 Furthermore, SCIT preparation methods are different for each company. For a more potent vaccine, aluminum hydroxide or L-tyrosine can be adsorbed in the HDM extract. For these reasons, it is not meaningful to compare in vitro parameters for evaluating the efficacy of different SCIT products.
Results of this study are important since reagents were compared head to head with clinically applicable immunological parameters. In this study, we compared immunological parameters before and after the SCIT treatment. Different sIgG4 responses from each of the SCIT reagents were observed. The Hollister-Stier® reagent induced the highest increase of sIgG4 and blocking factor, followed by Novo-Helisen® and Tyrosine-S®. Considering that the immunotherapy continues for 3 to 5 years, the duration of this study suggests early changes of immunotherapy. That is, Hollister-Stier SCIT reagents may exert a faster therapeutic effect. Although sIgE levels to D. farinae increased in Hollister-Stier group, the decrease of sIgE levels to component allergens, Der p 2 (statistically insignificant) and Der f 2, were confirmed by ImmunoCAP and immunoblot, respectively. This phenomenon could mean that Der p 2, rather than total extract, could reflect the inhibited IgE binding activity to HDM. Therefore, further study will be needed to delineate the relationship.
Discordance between IgE reactivity of the immunoblot and ImmunoCAP can be explained by their experimental characteristics. As antigen-antibody balance can differ between immunoblot and the ImmunoCAP system, ImmunoCAP is known to be performed in antigen excess state.19 For this reason, IgE reactivity in the Hollister-Stier group (H1, H2, H4, H5) might be reduced only in immunoblots (Fig. 3A), and there was no significant change in ImmunoCAP test.
Competition of IgG and IgE antibodies to 14 kDa allergen is thought to occur in IgE immunoblot analysis after SCIT. A recent report showed that IgE binding affinity measured by the microarray system can be used as marker for immunotherapy instead of ImmunoCAP system measurement.20 This is consistent with our experimental results. Further research with component allergen may be useful in the prediction of immunotherapy efficacy and diagnosis.21
There are some limitations of the study. First, this study was retrospective; there were no data for symptom and medication scores. Allergic disease entities were different between the SCIT groups. More atopic dermatitis patients were recruited to the Tyrosine-S® group. Also, treatment duration was shortest in the Tyrosine-S® group (mean 12.8 months), compared with the Hollister-Stier® group (mean 15.2 months). Changes in IgE, IgG4, and blocking factor might not directly reflect real clinical efficacy. Second, duration of the SCIT was short, 13 months on average.
Patients were treated with mixed HDM reagents (D. farinae and D. pteronyssinus), and we only compared data to D. farinae related factors, as it is the dominant HDM species in Korea.2223 As both species have marked cross reactivity,24 it is expected that they will show a similar pattern. In addition to sIgE and sIgG4 levels to D. farinae, different sIgE responses to group 2 major allergens were revealed in IgE immunoblotting (Der f 2) and ImmunoCAP (Der p 2) measurement. Der f 2 and Der p 2 have well established cross reactivity25 and the group 2 allergen of D. farinae (Der f 2) is commercially unavailable, and as such, we could only compare levels with Der p 2.
In conclusion, there are differences in treatment outcomes of currently available HDM SCIT reagents. sIgG4, sIgE/IgG4 ratio, and blocking factor indices vary according to the products.

 XML Download