

 PDF
PDF ePub
ePub Citation
 Print
Print


INTRODUCTION
Polycystic ovary syndrome (PCOS), the most common endocrinological cause of infertility in women of reproductive age, is characterized by ovulatory and menstrual dysfunction, hyperandrogenism, and polycystic ovaries as well as by metabolic abnormalities, such as type 2 diabetes mellitus (T2DM), hypertension, and dyslipidemia.1 Insulin resistance (IR) has a key role in the pathogenesis of PCOS. Approximately 50% to 70% of women with PCOS have IR. The risk of T2DM among women with PCOS is 5 to 10-fold higher than that of healthy controls.2 Because of the high risk of impaired glucose tolerance (IGT) and T2DM in PCOS, screening of women with PCOS to detect abnormalities in glucose tolerance is recommended. Women with PCOS have a significantly increased prevalence of IGT and undiagnosed diabetes.3 We previously reported that the prevalence of IGT and/or impaired fasting glucose (IFG) and T2DM was 17.0% and 1.0%, respectively, in young Korean women with PCOS.4 The routine use of an oral glucose tolerance test (OGTT) is recommended for screening for IGT and T2DM in women with PCOS.56 However, OGTT is time-consuming and labor intensive because venous blood samples are required after an overnight fasting and at 120 min after administration of a glucose solution.
Women with PCOS have dyslipidemia with prevalence of up to 70%.7 Increased plasma levels of triglycerides (TG) and low levels of high-density lipoprotein (HDL) cholesterol are characteristic metabolic abnormalities of insulin resistant individuals.8 The TG to HDL cholesterol (TG/HDL-C) ratio has been reported to be related to IR and suggested as a surrogate marker.91011 Several studies suggested that the TG/HDL-C ratio was as adequate as the occurrence of metabolic syndrome for identifying insulin resistant individuals.1213 A high TG/HDL-C ratio predisposed to diabetes mellitus (DM) in American Caucasian and European populations.14 However, the relationship between the TG/HDL-C ratio and IR differed by race/ethnicity and gender.1015
TG was suggested as a useful marker for IR in Korean women with PCOS.16 In Chinese women with PCOS, serum lipoprotein ratios such as the TG/HDL-C ratio, total cholesterol to HDL cholesterol ratio, and low-density lipoprotein cholesterol to HDL cholesterol ratio were higher compared with those of the healthy controls, and the TG/HDL-C ratio was significantly correlated with a homeostasis model assessment of insulin resistance (HOMA-IR).17 Additionally, there was a significant correlation between the TG/HDL-C ratio and IR in both men and women in the general population.1819 However, a cutoff value of the TG/HDL-C ratio for predicting IR or metabolic disorders has not been suggested in Korean women with PCOS.
The aim of this study was to determine the cutoff value of the TG/HDL-C ratio for predicting IR and to examine whether the TG/HDL-C ratio is useful for identifying individuals at risk of IGT in young Korean women with PCOS.
MATERIALS AND METHODS
Study subjects
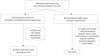
Between 2008 and 2010, we performed a survey of the health and nutritional status of women under 40 years of age who were residents of Seoul, Korea. Of 2950 women who voluntarily participated in this study, who were recruited by newspaper and online advertisements, we enrolled 450 premenopausal women (24±5 years) with PCOS and 450 premenopausal healthy women with regular menstrual cycles (24±4 years) as controls. The diagnosis of PCOS was based on the National Institute of Health criteria as follows: 1) amenorrhea or oligomenorrhea (<8 menstrual cycles per year) and 2) clinical or biochemical hyperandrogenism.20 Clinical hyperandrogenism was defined as having hirsutism with a modified Ferriman-Gallwey score of ≥8.21 Biochemical hyperandrogenemia was defined as having a total testosterone level or free testosterone level above the 95th percentile for testosterone levels in healthy regular cycling women. Patients with similar clinical presentations, such as congenital adrenal hyperplasia, androgen-secreting tumors, and Cushing's syndrome, were excluded from the study. Subjects were excluded if they had received any medication within 3 months of the evaluation or had used other drugs that could affect sex hormone metabolism or insulin actions (Fig. 1).
Written informed consent was obtained from all individual participants included in the study, and the Institutional Review Board of Ewha Womans University Mokdong Hospital approved this study (187-30).
Methods
The height and weight were measured for all the subjects, and the body mass index (BMI) was calculated as the weight (kg)/height (m)2. The waist circumference (WC) was measured in a standing position midway between the lower costal margin and the iliac crest. Blood pressure was calculated as the mean of two manual sphygmomanometer readings with the patient in the seated position. A single-frequency bioelectrical impedance plethysmograph was used for estimating body fatmass (InBody 230, Biospace Industry, Seoul, Korea). Standard electrocardiographic electrodes were placed on the hands and feet of the subjects, and isopropyl alcohol was used to clean each electrode attachment site. The subject's legs were parted, and the arms were adducted by approximately 30° to prevent skin-to-skin contact. The percentage of fat was defined as the total mass of fat divided by the total body mass.
On the third day of the follicular phase of the menstrual cycle, a venous blood sample was obtained from each subject after an overnight fast of at least 8 h. In women with amenorrhea, the blood samples were obtained on a random day. The total testosterone levels were measured via a chemiluminescent immunoassay method using a commercially available kit (Siemens, New York, NY, USA), and the mean inter-assay and intra-assay coefficient of variability (CV) was 4.4% and 6.2%, respectively. The sex hormone-binding globulin (SHBG) levels were measured by an immunoradiometric assay using a commercially available kit (DPC, Los Angeles, CA, USA), and the mean inter-assay and intra-assay CV were 7.9% and 5.3%, respectively. The free testosterone levels were calculated using the formula available on the International Society for the Study of the Aging Male website, which is based on the total testosterone, SHBG, and albumin levels in the same sample from each subject. Standard 75-g OGTT was performed in the morning after an overnight fast. After 30 min of supine rest, venous blood samples were drawn at at 0, 30, 60, 90, and 120 min after the 75-g glucose load. The plasma glucose levels were measured via the glucose oxidase method (Beckman Model Glucose Analyzer 2, Fullerton, CA, USA), and the insulin levels were measured by a radioimmunoassay using a commercially available kit (BioSource, Nivelles, Belgium). The fasting serum levels of TG and HDL cholesterol were measured using an enzymatic assay on an automated analyzer (Hitachi 7150 Automatic Chemistry Analyzer, Tokyo, Japan). HOMA-IR was calculated as the product of the fasting insulin level (mIU/L) and the fasting glucose level (mmol/L) divided by 22.5. IR, which was 2.6, was defined as >95th percentile of HOMA-IR in 450 regular cycling women, who served as the control. Estimated insulin sensitivity index (ISIest) was calculated according to the following formula: ISIest=0.226-0.0032×BMI-0.0000645×I120-0.00375×G90 (I120, post-load insulin at 120 minutes; G90, post-load glucose at 90 minutes). HOMA of β-cell function (HOMA-β) was calculated using the following formula: 20×fasting insulin (mIU/L)/fasting glucose (mmol/L)-3.5.
Statistical analyses
The statistical analyses were performed using the SPSS 18.0 software package for Windows (IBM Corporation, Chicago, IL, USA). The Kolmogorov-Smirnov statistical method was used to analyze the continuous variables for normality. The levels of TG, the TG/HDL-C ratio, fasting plasma insulin (FPI), 2-h postload plasma insulin (2-h PPI), and HOMA-IR were logarithmically transformed to achieve a normal distribution. The quantitative variables were reported as means±standard deviations. The variables that showed a skewed deviation were reported using medians and interquartile ranges. The between-group differences were assessed by the unpaired t-test and χ2 test, as appropriate. Spearman's rho correlation coefficient was applied to assess the correlation of the TG/HDL-C ratio with various metabolic and reproductive hormonal variables. Evaluation of the TG/HDL-C ratios with a receiver-operating characteristic (ROC) curve was used to evaluate the sensitivity and specificity to predict IR in women with PCOS. A p value <0.05 was considered significant.
RESULTS
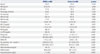
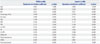
Table 1 shows the clinical and biochemical characteristics of the women with PCOS and the controls. The values of WC, systolic blood pressure (SBP), diastolic blood pressure (DBP), TG, HDL cholesterol, TG/HDL-C ratio, 2-h postload plasma glucose (2-h PPG), FPI, 2-h PPI, HOMA-IR, and HOMA-β were significantly higher, and the value of ISI was lower in the women with PCOS than in the controls (all p values <0.05). The concentration of the fasting plasma glucose (FPG) did not differ between the women with PCOS and the controls.
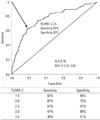
The cutoff point of the TG/HDL-C ratio to predict IR, estimated by HOMA-IR, was 2.5 (sensitivity 61%, specificity 82%), and the area under the ROC curve (AUC) was 0.76 [95% confidence interval (CI) 0.70–0.82] (Fig. 2) in the women with PCOS. This value was nearly consistent with the cutoff of the 75th percentile of the TG/HDL-C ratio in the PCOS group (2.6). The cutoff point of the TG/HDL-C ratio to predict IR defined as >95th percentile of ISIest, which was suggested as one of best replaceable parameters for insulin sensitivity index in young Korean women with PCOS,22 in 450 regular cycling women was 2.0 (sensitivity 69%, specificity 77%), and the AUC was 0.77 (95% CI 0.71–0.82) (Supplementary Fig. 1, only online). The cutoff points of the TG/HDL-C ratio to predict IGT/IFG/DM in women with PCOS (sensitivity 64%, specificity 72%, AUC 0.69, 95% CI 0.62–0.77) (Supplementary Fig. 2, only online) and IGT/DM in PCOS women with a normal fasting glucose (NFG) level (sensitivity 60%, specificity 72%, AUC 0.67, 95% CI 0.58–0.76) (Supplementary Fig. 3, only online) were 2.0, respectively.
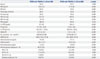
In the women with PCOS, the values of age, BMI, WC, SBP, DBP, percentage of fat, fat mass, free testosterone, FPG, 2-h PPG, FPI, 2-h PPI, HOMA-IR, and HOMA-β were significantly higher, and the levels of SHBG and ISI were lower in the women with PCOS with a TG/HDL-C ratio >2.5 compared with those with a TG/HDL-C ≤2.5 (all p<0.05). The prevalence rates of IFG, IGT, and DM were higher, and the prevalence of normal glucose tolerance was lower in the women with PCOS with a TG/HDL-C ratio >2.5 than those with a TG/HDL-C ratio ≤2.5 (all p<0.05) (Table 2).
In the correlation analyses, TG/HDL-C ratio was positively correlated with BMI (r=0.527), WC (r=0.517), percentage of fat (r=0.459), fat mass (r=0.499), SBP (r=0.148), DBP (r=0.205), FPG (r=0.127), 2-h PPG (r=0.374), FPI (r=0.405), 2-h PPI (r=0.375), HOMA-IR (r=0.415), total testosterone (r=0.134), and free testosterone (r=0.324), whereas negatively correlated with SHBG (r=-0.421) in the women with PCOS. TG/HDL-C ratio was positively correlated with age (r=0.093), BMI (r=0.242), WC (r=0.251), percentage of fat (r=0.219), fat mass (r=0.231), SBP (r=0.129), DBP (r=0.147), FPG (r=0.168), FPI (r=0.284), 2-h PPI (r=0.268), and HOMA-IR (r=0.293), while negatively correlated with SHBG (r=-0.144) in the controls (all p values<0.05) (Table 3).
Among 432 women with PCOS with a NFG level, the prevalence rates of IGT were significantly higher in the high TG/HDL-C ratio group than in the low TG/HDL-C ratio group (15.6% vs. 5.6%, p=0.001). Although the prevalence rates of DM were quite low and not significant in both groups, the sum of IGT and DM was also significantly higher in the PCOS women with high TG/HDL-C ratio compared to those with low TG/HDL-C ratio group (18.3% vs. 6.2%, p<0.001) (Table 4).
In the regular cycling control subjects, the cutoff point of the TG/HDL-C ratio to predict IR was 1.7 (sensitivity 79%, specificity 70%) (Supplementary Fig. 4, only online). This value was similar to the cutoff of the highest quartile of the TG/HDL-C ratio in the control group (2.0). In 440 control women with NFG, the prevalence of IGT did not differ significantly in the high TG/HDL-C ratio group and the low TG/HDL-C ratio group (2.7% vs. 1.8%, p=0.602, data not shown).
DISCUSSION
In this study, the cutoff value of the TG/HDL-C ratio for identifying individuals with IR was 2.5 in young Korean women with PCOS. This value was nearly the same as the 75th percentile of the TG/HDL-C ratio in women with PCOS (2.6). Many studies defined the 75th percentile value as a high TG/HDL-C ratio, and our study also confirmed that the 75th percentile could be used as an index of a high TG/HDL-C ratio to predict IR in the general population, without measurement of HOMA-IR or other complex methods.
Among the women with PCOS with NFG, the prevalence of IGT was significantly higher in the PCOS subjects with a TG/HDL-C ratio >2.5 than in the PCOS subjects with a TG/HDL-C ratio ≤2.5. Because of the low rates of the DM in both groups, the prevalence of DM did not significantly differ. However, the sum of the prevalence rates of IGT and DM was also significantly higher in the PCOS subjects with a TG/HDL-C ratio >2.5 than in the PCOS subjects with a TG/HDL-C ratio ≤2.5 with stronger power of statistical significance. These differences were not shown in regular cycling healthy women with a high vs. low TG/HDL-C ratio, in which the prevalence rates of IGT were not different in both groups. Considering the young age (less than 40 years old) of this study subjects, low rate of DM prevalence is acceptable, and statistical insignificance is an expected result. Further studies including older and postmenopausal women should be performed to confirm the definite difference of prevalence rates of DM in high vs. low TG/HDL-C ratio group.
IR is a status of an impaired metabolic response to either exogenous or endogenous insulin.23 There are many methods of evaluating IR. The glucose clamp technique is regarded as the best available standard for the measurement of insulin action.24 Simpler methods, such as a homeostatic model assessment calculation, have been developed to measure IR because of the cost and time requirements of the glucose clamp.
Many studies have observed that the plasma TG/HDL-C ratio is a useful and practical method for predicting IR and suggested optimal cutoff points of the plasma TG/HDL-C ratio in individuals of various ethnicities at cardiovascular risk.2526 The cutoff value of the TG/HDL-C ratio for predicting IR in Korean women was different from the results for other ethnicities. The optimal TG/HDL-C ratio for predicting IR was 3.5 in a study preformed primarily in a Caucasian population including men and women,12 whereas the TG/HDL-C ratio could not identify IR in African-American women.27 In previous studies, the relationship between the TG/HDL-C ratio and IR differed by gender. In European and Mexican populations, women and men whose TG/HDL-C ratios exceeded 2.5 and 3.5, respectively, were more insulin resistant than the rest of the population.1528 Most of those values were derived from the 75th percentile of the TG/HDL-C ratio or calculated by ROC curve analysis. In this study, we defined IR as more than the 95th percentile of HOMA-IR in 450 regular cycling healthy women, and then calculated the cutoff value of the TG/HDL-C ratio to identify IR in women with PCOS, which was 2.5. We calculated the 75th percentile of the TG/HDL-C ratio in women with PCOS, which was near 2.5. We strongly suggest that a TG/HDL-C ratio of 2.5 is a predictor of IR in young Korean women with PCOS.
We observed that the TG/HDL-C ratio in women with PCOS was strongly correlated with various cardiovascular risk markers such as obesity (BMI, WC, fat mass), postload hyperglycemia, IR (fasting and postload insulin, and HOMA-IR), and hyperandrogenemia (SHBG and free testosterone). However, these correlations were weaker in regular cycling healthy women than those with PCOS, suggesting that TG/HDL-C ratio can be considered as an integrated cardiovascular risk marker in this study group.
The use of OGTT is recommended for screening for IGT and T2DM in women with PCOS.6 Recently, the 2-h PPI level was suggested as a useful tool to indicate IR in women with PCOS.29 However, performing the OGTT and measuring the 2-h PPI level are time-consuming because venous blood samples are required 120 min after the 75-g glucose load. The TG/HDL-C ratio might serve as an alternative and simpler method for identifying insulin resistant individuals. The TG/HDL-C ratio has been reported to be highly correlated with the visceral adiposity index.30 In our study, the TG/HDL-C ratio was positively correlated with the percentage of fat and fat mass. The TG/HDL-C ratio provides an estimate of IR and was reported to identify patients who are at risk of cardiovascular disease.915 Because women with PCOS are at an increased risk of cardiovascular disease, the TG/HDL-C ratio would be a useful and predictive tool for assessing IR and cardiovascular disease in women with PCOS. Further prospective studies are needed to identify the association of TG/HDL-C ratio and the development of cardiovascular disease in women with PCOS.
In agreement with a previous study,17 the TG/HDL-C ratio was higher in women with PCOS than in the controls. The sensitivity and specificity for predicting IR were similar to the result of the previous study.1528 Because the TG/HDL-C ratio is associated with IR, it is reasonable to assume that the group with a higher TG/HDL-C ratio has higher androgen levels. IR with secondary hyperinsulinemia has been reported to be associated with hyperandrogenism.31
This study is the first to evaluate the utility of the TG/HDL-C ratio, which is a simple method for identifying individuals at risk of IGT in women with PCOS. Another strength of our study is the relatively large sample size, although it is a cross-sectional study. However, further studies need to be replicated in other populations to generalize the results. Furthermore, defining the IR based on HOMA-IR could not necessarily be correct because HOMA-IR is an indirect and rather variable measure of whole body IR.
In summary, the cutoff value of the TG/HDL-C ratio for predicting IR was 2.5 in young Korean women with PCOS, and women with NFG and a high TG/HDL-C ratio had a higher prevalence of IGT. Therefore, Korean women with PCOS with a TG/HDL-C ratio >2.5 are recommended to be screened for OGTT to detect IGT even if they present with NFG.

 XML Download