

 PDF
PDF ePub
ePub Citation
 Print
Print


INTRODUCTION
Type 2 diabetes (T2D) is characterised by insulin resistance and progressive deterioration of β-cell function, ultimately resulting in the absolute deficiency of insulin secretion that is manifested by non-response to escalating oral hypoglycemic agents (OHAs) to overcome hyperglycemia.123 As proof-of-concept, earlier and more intensive insulin initiation in patients with newly diagnosed T2D resulted in not only a great improvement in glycemic control, but also a modified natural history of diabetes through restoration and preservation of pancreatic β-cell function.45 In this regard, some controversy might remain over whether appropriate implementation of insulin analogues, even in subjects with a moderate duration of T2D, is expected to achieve the targeted HbA1c while minimising side effects such as hypoglycaemia.67 To address this, many questions should be clarified in real clinical practice, such as when to initiate insulin (before or after islet failure), which patients to initiate treatment in, which kind of insulin analogue (basal, rapid-acting, biphasic, or combination of basal and rapid-acting insulin analogue) should be used, and how to administer insulin (starting dose, number of injections, divided ratio of total doses, and titration methods).8910 Previously, we investigated the stage at which both physicians and patients agreed to start insulin therapy, and what are acceptable HbA1c levels for Korean subjects with T2D in real practice.11 We have also tried to answer questions regarding the characteristics of patients who respond adequately to basal plus insulin or to insulin analogues (basal or biphasic insulin analogue) after sulfonylurea failure,1213 as well as the optimal dosing ratio of twice-daily biphasic insulin analogues.1415 However, little research has been performed on whether a change in therapeutic strategy from insulin therapy to OHAs could be successfully applied and, if so, which characteristics are predictive of successful maintenance on OHAs after switching from initial insulin therapy in patients with T2D, especially in the Korean population.
Therefore, in this study we aimed to investigate the clinical and metabolic parameters of T2D patients who could maintain adequate glycemic control after switching to OHAs from insulin analogues.
MATERIALS AND METHODS
Study population and study design
In this longitudinal retrospective study, we analyzed subjects with T2D from three cohorts who had enrolled in previous studies. These patients were randomly assigned to a long-acting insulin analogue and biphasic insulin analogue, or were switched from OHAs to twice-daily of premixed insulin lispro 25 or premixed insulin aspart protamine 30.121415 All patients were followed up in October 2014 at Severance Diabetes Center, Seoul, South Korea. Patients were excluded for the following reasons: less than 6 months of follow-up after the recruited study endpoint, secondary disorders of hyperglycemia, such as iatrogenic, inflammatory, or endocrine disorders during the observation period.
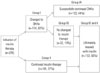
We reviewed and rechecked electronic medical records to assess whether the subjects who stopped taking insulin later resumed insulin or continued on OHAs after insulin discontinuation. The study subjects were first classified into two groups according to whether they switched from insulin to OHAs: the off-insulin group (Group I) and the on-insulin group (Group II) (Fig. 1). Because of the nature of real-world and retrospective study, there was no study-related guideline or consensus on the selection of patients and the choice of OHAs but fully at the discretion of the physician based on clinical judgments and the levels of HbA1c at switching to OHAs from insulin were approximately less than 7.5%. If subjects were able to discontinue insulin treatment at least once, they were classified into the off-insulin group (Group I). The off-insulin group was further divided according to resumption of insulin during the follow-up period into the off-insulin with maintained OHAs (Group IA) and off-insulin with re-initiation of insulin (Group IB). Sulfonylurea failure was defined as either glimepiride >4 mg, gliclazide >120 mg, or glibenclamide >10 mg per a day. Symptomatic hypoglycemic events were defined as blood glucose below 70 mg/dL concomitant with symptoms such as sweating or palpitation. The protocol of this study, adhered to the tenets of the Declaration of Helsinki, was approved by the Institutional Review Board (IRB No. 4-2014-0059) of Severance Hospital and written informed consent for this study was not required by the institutional review board because the researchers only accessed the database for analysis purposes and personal information was not used.
Clinical and laboratory measurements
Body mass index (BMI) was defined as weight divided by the square of the height (kg/m2). Measurement techniques included the hexokinase method for both fasting and postprandial glucoses and the enzymatic colorimetric method for total cholesterol, triglycerides, and high-density lipoprotein cholesterol. HbA1c was measured by high-performance liquid chromatography using Variant™ II Turbo (Bio-Rad Laboratories, Hercules, CA, USA). Serum glycated albumin (GA) was determined by an enzymatic method as previously described.16 The reference ranges for HbA1c was 4.0% to 6.0%, and for GA was 11.0% to 16.0%. Levels of serum C-peptide were measured in duplicate using an immunoradiometric assay method (Beckman Coulter, Fullerton, CA, USA). Pancreatic β-cell functions in the context of ambient insulin resistance were assessed using the following indices: 1) fasting or postprandial C-peptide; 2) fasting C-peptide-to-glucose ratio or postprandial C-peptide-to-glucose ratio (PCGR) [fasting or postprandial C-peptide level (ng/mL)/fasting or postprandial glucose level (mg/dL)×100]; 3) index for C-peptide (postprandial C-peptide-fasting C-peptide)/(postprandial glucose-fasting glucose); 4) homeostasis model assessment of b-cell function [fasting insulin (µIU/mL)×20/fasting glucose (mmol/L)-3.5]; and 5) homeostasis model assessment of insulin resistance [fasting insulin (µIU/mL)×fasting plasma glucose (mmol/L)/22.5]; 6) the fasting or postprandial secretory units of islets in transplantation (SUIT) index {[250×fasting or postprandial C-peptide (nM)]/[fasting or postprandial blood glucose (mM)-3.43]}.171819 A standardized mixed meal (Ensure, Meiji Dairies Corporation, Tokyo, Japan; total 500 kcal, 17.5 g fat, 68.5 g carbohydrate, and 17.5 g protein) stimulation test was conducted after an 8-hour overnight fast, and postprandial glucose and C-peptide were measured at 90 minutes in 33.1% of subjects. In the rest of 66.9% of subjects, postprandial glucose and serum were measured 2 hours after each subject's conventional diet.121415
Statistical analysis
All continuous variables are presented as mean±standard deviation (SD) and categorical variables are presented as proportions. Data are shown as mean±standard error (SE) in the figures.
Differences were analysed using Student's t-test for continuous variables and chi-squared test for categorical variables. Cox regression analysis was performed to assess whether maintenance of OHAs or resumption of insulin treatment after insulin discontinuation was associated with various clinical and laboratory parameters at baseline (Model 1) and during the follow-up period (Model 2). Multiple linear regression analysis was performed to determine the independent relationship of the studied variables. The odds ratios (ORs) and 95% confidence intervals (CIs) for the factors associated with subjects who are ultimately unable to maintain the use of OHAs without insulin were calculated using multivariate logistic repression analysis. Cumulative event rates for resumption of insulin were estimated by Kaplan-Meier survival curves, and probability values were calculated with the log-rank test. The receiver operating characteristic (ROC) curve of PCGR was used to assess the optimal cut-off value for the prediction in successful maintenance of OHAs with the areas under the curve (AUC) with maximum Youden index (sensitivity+specificity-1). A p value <0.05 was considered statistically significant. Statistical analyses were performed using PASW Statistics version 20.0 for Windows (SPSS Inc., Chicago, IL, USA).
RESULTS
Patient enrolment and classification
Of 363 T2D participants who had enrolled in three previous studies, 305 insulin-naïve subjects (84%) were well documented and available for clinical follow-up up to October 2014. After exclusion of subjects with steroid use (n=15), and less than 6 months of follow-up period after study enrolment (n=15), a total of 275 patients with mean follow-up duration of 33.1 months were analysed in this study (Fig. 1).
Among 275 participants, 174 (63%) subjects representing Group I were able to discontinue insulin treatment at least once with a switch to OHAs at a rate of 23% per year. Of these, 122 (44%) subjects in Group IA were treated with insulin therapy for 14.9 months before switching to OHAs and successfully continued with OHAs. Fifty-two (19%) patients in Group IB were treated with insulin therapy for 19.0 months and then with OHAs for 9.2 months before resuming insulin therapy. Group II contained 101 (37%) subjects who continued insulin therapy without modifying the treatment modality.
Clinical and laboratory characteristics of patients at baseline
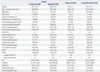
The demographic and laboratory data of all of the subjects at baseline are shown in Table 1. For all participants, the mean age of patients was 58.5±10.9 years, and the mean duration of diabetes was 9.2 years. The average BMI was 24.5±3.3 kg/m2, and 45% of patients were defined as obese by the obesity criteria of the Asian and Pacific region (BMI ≥25 kg/m2).2021 BMI was significantly lower in Group II than in Group I. Group II showed significantly lower BMI than Group I. Of Group I, age, gender, BMI, duration of diabetes, and family history of diabetes were similar between Group IA and Group IB. Regarding glucometabolic parameters, HbA1c and postprandial plasma glucose concentration were higher in the subjects who resumed insulin treatment (Group IB) than in those who maintained OHAs (Group IA). Levels of PCGR were arbitrarily divided into two subgroups as the lowest tertile and higher tertiles (including the middle and highest tertile). Group IB had a statistically higher proportion of patients in the lowest tertile of PCGR than Group IA. Compared to subjects who could be maintained on OHAs (Group IA), subjects who were ultimately treated with insulin therapy (Group IB and Group II) showed a lower BMI (Group IA vs. Group IB+II, 25.1±3.4 kg/m2 vs. 24.2±3.0 kg/m2, p value 0.033), lower proportion of subjects with higher tertiles of PCGR (76% vs. 59%, p value 0.006), and a lower postprandial SUIT index (39.6±21.7 vs. 32.7±21.8, p value 0.015). There was no statistical difference in the drug regimen before insulin initiation and the incidence of hypoglycemic events between groups. Supplementary Table 1 (only online) presentsd the use of insulin and OHAs at baseline and during the follow-up period.
Changes in glycemic parameters during the follow-up period
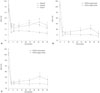
Changes in HbA1c during the study period are shown in Fig. 2. All of the groups showed markedly decreased levels of HbA1c by an average of 1.8% (p value <0.001) at a mean insulin dose of 33.9±16.4 U within the first 3 months after insulin initiation (Fig. 2A). During the study period, subjects in Group IA had adequate glycemic control with significantly lower levels of HbA1c than subjects in Group IB or Group II. However, there was no significant difference in HbA1c between Group IB and Group II during the period. Fig. 2B shows HbA1c changes according to the baseline PCGR. Compared to subjects with higher tertiles of PCGR levels, including the middle and highest tertile, those with the lowest tertile of PCGR level showed higher levels of HbA1c from the baseline during the study period. Fig. 2C shows the similar pattern of HbA1c changes among Group IA and IB to those with all subjects in Fig. 2B.
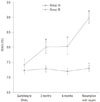
To evaluate glycemic parameters between Group IA and Group IB, the change in HbA1c from the switching point to OHAs until resumption of insulin therapy in Group IB (at 9.2 months after switching to OHAs) and the corresponding mean values in Group IA (at 6–12 months after switching to OHAs) are shown in Fig. 3. Group IA and Group IB showed similar levels of HbA1c at the switching point to OHAs from insulin as 7.2±1.3% and 7.4±1.3%, respectively. HbA1c increased by 0.6±0.04% after the first 3 months of OHAs treatment in Group IB (p value 0.046), whereas Group IA maintained glycemic control at a mean HbA1c level of 7.3±0.1% and without a significant difference during the period. Compared to Group IA, the level of HbA1c in Group IB significantly increased from 8.0±0.3% at 6 months after switching to OHAs to 9.0±0.3% at the time of resumption of insulin (p value <0.005).
Predictive parameters for resumption of insulin after initial insulin discontinuation and failure of treatment with OHAs
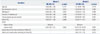
Cox regression analysis was performed to investigate the predictive factors for resumption of insulin therapy for glucose control in subjects who switched to OHAs from initial insulin therapy (Group IA vs. Group IB) (Table 2). We included clinically important conventional variables and established parameters that were significantly different between Group IA and Group IB, based on the results of Table 1. Compared to subjects with higher tertiles of PCGR at baseline, subjects with the lowest tertile of PCGR at baseline showed a 3.4-fold increased risk of OHA failure and switch to insulin therapy (95% CI 1.56–7.31) in Model 1. In the regression model including additional variables during follow-up period (Model 2), HbA1c levels at 6 months after switching to OHAs [hazard ratio (HR) 1.68, 95% CI 1.01–1.10], insulin dose at switching to OHAs (HR 1.04, 95% CI 1.01–1.07), and the lowest tertile of baseline PCGR (HR 8.34, 95% CI 2.34–29.74) were significant predictors of an increased likelihood of resumption of insulin therapy. Furthermore, multivariate linear regression analysis showed that HbA1c level at 6 months after switching to OHAs was significantly increased in patients with a lower PCGR level at baseline (standardized β=-0.170, p value 0.038) (Supplementary Table 2, only online).
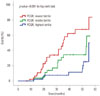
As shown in Fig. 4, we observed a higher cumulative incidence of OHA failure and resumption of insulin in subjects with the lowest tertile of baseline PCGR than those with higher tertiles of baseline PCGR (p value <0.001 by log-rank test).
Predictive parameters for subjects who were ultimately treated with insulin therapy
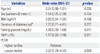
Multivariate logistic regression analysis was performed to investigate significant factors predicting the likelihood of ultimate inability to maintain adequate glycemic control without using insulin in subjects who are clinically insulin-dependent for glucose control (Group IB and Group II). We found that the lowest tertile of PCGR at baseline (OR 2.22, 95% CI 1.09–4.52) was independently associated with ultimate treatment with insulin therapy in subjects in Group IB and II (p value 0.024) (Table 3). In the ROC analysis, 1.490 of PCGR at baseline was the optimal cut-off value for predicting successful switching to OHAs with sensitivity of 64.5% and specificity of 66.7% (AUC 0.654, p value 0.003) (Supplementary Fig. 1, only online).
DISCUSSION
Considering the advantages of appropriate use of insulin analogues to modify the natural history of diabetes through restoration and preservation of pancreatic β-cell function,45 we hypothesised that T2D patients who have reserved β-cell function might be more likely to be stably maintained with OHAs after switching from initial insulin therapy. To address these questions, we gathered data from three previous cohort studies of insulin treatment and focused on investigating the clinical and metabolic parameters of T2D patients who could maintain adequate glycemic control after switching to OHAs from initial insulin therapy. From this longitudinal study, we found that 63% of enrolled participants (Group I) were able to stop insulin therapy and switch to OHAs at a rate of 23% per year. Among these patients, 44% (Group IA) could maintain treatment with OHAs and 19% (Group IB) required resumption of insulin after OHA failure. However, 37% of the enrolled subjects (Group II) were unable to discontinue insulin at any time during the study observation.
Investigation of the predictive factors for requiring insulin therapy to maintain optimal glucose control yielded two main findings in Korean T2D patients: 1) a high HbA1c level at 6 months after switching to OHAs was the most significant independent parameter associated with inadequate glycemic control upon switching to OHAs from insulin analogues, indicating its importance in guiding therapeutic strategy for maintaining an optimal glycemic target; 2) the level of PCGR, which reflects preserved dynamic β-cell function2223 before initiation of insulin analogues could be a predictive parameter of whether patients could be switched to OHAs or should be maintained with insulin analogues.
To appropriately evaluate predictive independent factors, we adopted parameters reflecting β-cell function indices and the time-to event relationship of therapeutic changes using the Cox regression model. In numerous previous studies, secretory pancreatic β-cell dysfunction has been regarded as an important factor for glycemic control, especially in Asian populations,24 whereas C-peptide measurement is a well-known method for assessing β-cell function.25 Recent studies suggested that the C-peptide-to-glucose ratio might be a better marker to evaluate endogenous insulin secretory ability, especially in the postprandial state, because elevated levels of plasma glucose and incretin hormone further stimulate insulin secretion.262728 Also, postprandial insulin deficiency is considered the main determinant of deteriorating glycemic control in patients with newly detected T2D.29 Previously, Saisho, et al.30 reported PCGR as a predictor of subsequent insulin treatment in patients with T2D, showing a similar clinical implication of PCGR to the findings of the present study. While conventional clinical variables such as duration of diabetes and type of OHA showed no clinical implication in predicting the need for insulin continuation to maintain optimal glucose control at the time of insulin initiation, a lower baseline PCGR was found to be a strong independent variable for failure of OHAs and ultimate requirement for insulin therapy after switching to OHAs (Table 2 and 3, Fig. 4). Regarding changes in HbA1c according to therapeutic strategies, HbA1c levels at 3 to 6 months after changing to OHA were significantly different between Group IA subjects who continued OHAs and Group IB subjects who failed on OHAs and resumed insulin therapy (Fig. 3). Furthermore, in contrast to Group IA, inadequate glycemic control was observed in both Group IB and II, who ultimately required insulin therapy, with no significant differences in HbA1c level between these two groups (Fig. 2A). However, Cox regression analysis showed that HbA1c at 6 months after switching from insulin to OHA was the only significant predictor for resumption of insulin after OHA failure among the follow-up parameters tested. In multivariate linear regression analysis, we additionally revealed a negative correlation between baseline PCGR and HbA1c at 6 months after switching from insulin therapy to OHAs (Table 3). With respect to prediction of the best therapeutic strategy for T2D patients after insulin initiation, these data indicate that glycemic status after switching from insulin therapy to OHAs is affected by the baseline secretory β-cell function.
It is known that intensive insulin therapy in patients with newly diagnosed T2D with severe hyperglycemia could induce favourable long-term glycemic control with recovery or a decreased rate of deterioration of β-cell function.4531 Although the Korean T2D patients enrolled in this study were not newly diagnosed but had an average disease duration of 9.2 years, subjects in Group IA showed a statistically significant improvement in the level of PCGR (increased by 0.723±1.717, p value 0.001) and lipid profiles (data not shown), together with a significant decrease in HbA1c, with insulin therapy. This finding might imply that the implementation of insulin would result not only in the possibility of adequate glycemic maintenance with a switch to OHAs, but also restoration and preservation of pancreatic β-cell function even in subjects with a moderate duration of diabetes who have relatively preserved insulin secretory function assessed by PCGR. Therefore, PCGR at baseline might be the strongest candidate for predicting sustained glycemic control with OHAs among subjects who change from insulin therapy. Moreover, PCGR after glycemic control with insulin therapy could have potentials to expect the glucose control after the discontinuation of insulin therapy. The possible explanation for this finding might be the restoration of the lost secretory function of endogenous insulin after exogenous insulin therapy. Therefore, further research will be warranted for investigating the ways to restore the lost insulin function. As the duration of diabetes increases, insulin secretion decreases, especially postprandial secretion.29 Considering the natural course of T2D, early initiation of insulin administration in subjects with escalating hyperglycemia could be a preferable option to restore and maintain pancreatic β-cell function and provide better glycemic control.
The lowest tertile of the postprandial SUIT index in this study presented a significantly higher HR for predicting resumption with insulin after insulin discontinuation and OHA therapy (HR 2.80, 95% CI 1.29–6.04, p value 0.009) (Supplementary Table 3, only online), but that of the fasting SUIT index did not (HR 1.05, 95% CI 0.48–2.29, p value 0.898). In contrast to Yamada, et al.'s17 report of significant correlation between fasting SUIT index and stimulated serum C-peptide (p value <0.001) and our present result of significant correlation between fasting SUIT index and PCGR level (standardized β=0.409, p value <0.0001), the postprandial SUIT index was a stronger predictor of an increased likelihood of resumption of insulin therapy relative to fasting measures in the present study. Since we could not assess the AUC120 min SUIT index, further in-depth analysis of the augmentation of C-peptide in response to the increase of glucose during the oral glucose tolerance test (OGTT), which has previously been shown to indicate β-cell function well19 is also warranted.
There are some limitations in this study that should be addressed by further trials. First, despite the existence of baseline data from the longitudinal study by recruiting three insulin cohort studies, the retrospective design of this study has inherent limitations. However, we focused on the experience in the setting of real-world practice. Second, data included in this study did not cover the patients' satisfaction with the drugs and any drug-related side effects such as weight gain. Third, during the study period, the decision of when to switch to OHAs and resume insulin therapy was made at the discretion of the patients' physicians. However, the levels of HbA1c at switching to OHAs from initial insulin therapy in Group IA and Group IB turned out similarly to be under 7.5%.
In conclusion, a higher level of PCGR at the time of insulin initiation and lower HbA1c level at 6 months after switching to OHAs are clinical parameters that should be taken into consideration as important predictors for the successful maintenance of OHAs after switching from insulin therapy in Korean patients with T2D.
 XML Download