

 PDF
PDF ePub
ePub Citation
 Print
Print


INTRODUCTION
Between 1988 and 2012, the United States in-hospital mortality rate of septic patients admitted to an intensive care unit (ICU) declined by 35%, despite an increase in illness severity.1 The most important factor in decreasing mortality among septic patients was the implementation of care bundle approaches (e.g., the Surviving Sepsis Campaign).23 However, sepsis is still the leading cause of death (18.4–29.0%),45 and the incidences of severe sepsis and septic shock are increasing.56 Therefore, much progress remains to be made in decreasing the mortality rate; one way to accomplish this is the early identification of patients likely to die. If we can predict the mortality of patients with severe sepsis and/or septic shock (hereafter referred to as "severe sepsis") in the emergency department (ED) and aggressively resuscitate them, the survival rate can be expected to increase.
Many studies have suggested prognostic factors for severe sepsis such as age, gender, ethnic origin, comorbidities, illness severity, and biomarkers associated with mortality.78 Conventional scoring systems such as the Acute Physiology and Chronic Health Evaluation II (APACHE II), Sepsis Organ Failure Assessment (SOFA), and National Early Warning Score (NEWS) have been used to predict mortality and multi-organ dysfunction.9 However, some studies considered that conventional scoring systems were more suitable for patients with early sepsis, and were unsuitable for those with severe sepsis or septic shock.10 Others have suggested a role for biomarkers in predicting mortality from severe sepsis.1112 More than 170 different biomarkers have been evaluated, including coagulation, complement, contact system activation, inflammation, and apoptosis markers. Biomarkers can add accuracy and objectivity,13 but their effectiveness in mortality prediction is limited by a lack of specificity and sensitivity.121415 It is difficult to precisely estimate prognosis from a single biomarker because the host immune response to infection is complex. Response to sepsis varies with time, and some specific biomarkers may be useful during specific time periods.12
Recently, some studies have reported a combinatory approach using scoring systems and biomarkers for predicting septic patient mortality.1116 However, few studies suggested a combination of several biomarkers with and without scoring systems for mortality prediction in patients with severe sepsis.
Thus, the objective of this study was to determine a new nomogram (which is a user-friendly graphical representation of a statistical predictive model that generates a numerical probability of a clinical event)17 that can predict 28-day mortality in severe sepsis and/or septic shock patients using a combination of several biomarkers that are inexpensive and readily available in most EDs, with and without scoring systems.
MATERIALS AND METHODS
Study design and populations
We performed a retrospective, observational, registry-based study using the early goal-directed therapy (EGDT) registry data from Yonsei University College of Medicine, Severance Hospital, Seoul, Korea between January 1, 2012 and December 31, 2014. Since November 2007, the protocol-based EGDT has been implemented as a critical pathway for patients presenting to the ED of our institution with severe sepsis. If a patient meeting two or more systemic inflammatory response syndrome (SIRS) criteria along with having suspicious signs of organ dysfunction or hypoperfusion with infection presented to the ED, the patient's eligibility for EGDT was assessed. Patients were enrolled in the EGDT registry if one or both of the following conditions existed: 1) an initial systolic blood pressure (SBP) <90 mm Hg, despite a 20 mL/kg intravenous crystalloid fluid challenge; or 2) an initial serum lactate level ≥4 mmol/L. The exclusion criteria were as follows: 1) those aged <19 years, 2) pregnancy, 3) an acute cerebrovascular or coronary syndrome, 4) active gastrointestinal bleeding, 5) a contraindication to a central venous catheter, 6) trauma, 7) a requirement for immediate surgical intervention, 8) a transfer to another hospital within 6 hours after ED admission, and 9) those on do-not-resuscitate status. After reviewing the final diagnosis, we also excluded patients with non-infectious conditions leading to SIRS. The final study population was then allocated to either the training or the validation set at a 7:3 ratio by simple random sampling. The study was reviewed and approved by the Institutional Review Board of Yonsei University College of Medicine, Severance Hospital. The requirement of informed consent was waived by the ethics committee because of the retrospective nature of the study.
Data collection
One investigator (M.H.S.) collected data through a retrospective review of medical records. We attempted to use a standardized data abstraction form to minimize bias in the present retrospective study.
We collected demographic data, pre-existing chronic comorbidities, and initial vital signs including respiratory rate (RR). Initial laboratory data sampled at the time of ED admission that were known to be relevant to the diagnosis or prognosis of sepsis, as well as laboratory data collected routinely in the ED, were recorded. Parameters included white blood cell count, hematocrit, platelet count, red cell distribution width (RDW), delta neutrophil index (DNI), international normalized ratio, activated partial thromboplastin time (aPTT), pH, pCO2, pO2, base excess (BE), HCO3-, lactate, blood urea nitrogen (BUN), creatinine, albumin, creatine kinase-MB (CK-MB), troponin T, N-terminal brain natriuretic peptide, C-reactive protein (CRP), and procalcitonin. APACHE II score, SOFA score, and NEWS were also obtained using the worst values during the initial 24 hours after ED admission. The primary outcome was 28-day overall mortality.
Statistical analysis
Statistical analysis was performed using SAS version 9.2 (SAS Inc., Cary, NC, USA). The categorical variables are described as frequencies (%) and continuous variables as mean±standard deviation.
We used independent two-sample t tests for comparisons of continuous variables and the chi-squared test or Fisher's exact test for categorical variables. For the training set, multicollinearity between the variables was taken into consideration. First, we created various types of combinations composed of variables with p<0.05 on univariate binary logistic regression, including individual scoring systems such as APACHE II, and then generated models using variables that were identified as independently associated with 28-day mortality by a stepwise multivariate analysis method. Subsequently, we selected the model with the largest area under the receiver operating characteristic curve (AUC). The Delong method was used to compare the AUC for the predictive value of the new nomogram with those of APACHE II, NEWS, and SOFA regarding 28-day survival of patients with severe sepsis. Finally, a simplified nomogram was developed for the prediction of 28-day mortality with the training set using variables included in the selected model. The performances of the nomograms in predicting outcomes were evaluated with respect to discrimination and calibration.17 The Hosmer-Lemeshow goodness-of-fit test was used to assess the suitability of the models, because it showed how well the nomogram was calibrated; namely, a close approximation between the observed and predicted probabilities shows good calibration and confirms the exportability of the model. Thereafter, the diagnostic accuracy of the new nomogram generated with the training set was subsequently tested in the validation set. p<0.05 was considered statistically significant.
RESULTS
Study population
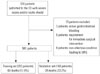
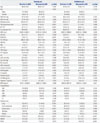
A total of 574 patients with suspected severe sepsis underwent EGDT in the ED during the study period and were initially enrolled in the present study. Upon chart review, we excluded 13 patients for the following reasons: active gastrointestinal bleeding (n=3), a requirement for immediate surgical intervention (n=6), and a non-infectious condition leading to SIRS (n=4) (Fig. 1). We included 561 patients in the final analysis, of whom 393 were randomly allocated to the training set and 168 to the validation set. The baseline characteristics in the training and validation sets that were related to 28-day mortality are summarized in Table 1. In the training set of 393 patients, 69 (17.6%) did not survive 28 days. Moreover, there were 39 (23.2%) deaths during the follow-up period in the validation set.
Albumin, base excess, and respiratory rate are independent prognostic factors in the training set
Among training set patients, the RR of those who died was higher than that of survivors (21.9±5.8 vs. 19.4±4.0; p<0.001), and body temperature was also significantly different between the groups (p<0.001). There were several differing laboratory findings between the surviving and deceased groups. High RDW, DNI, aPTT, and CRP values were correlated with increased 28-day mortality in severely septic patients (p<0.001, p=0.021, p=0.013, and p=0.049, respectively). Low pH, HCO3-, and BE values as well as a high lactate value were also significantly associated with increased 28-day mortality (p=0.001, p<0.001, p<0.001, and p<0.001, respectively). Low albumin, high BUN, and high CK-MB values were predictive of increased mortality (p<0.001, p=0.003, and p=0.027, respectively). Procalcitonin values were available for only 150 patients (38.2%) because this test was not performed during the earlier stage of the study period, and did not show statistical significance predicting 28-day mortality in our study (p=0.267). In the training set, the APACHE II, NEWS, and SOFA scores of deceased patients were higher than those of survivors (18.5±6.1 vs. 16.0±5.3; p<0.001, 9.7±3.7 vs. 8.5±3.0; p=0.011, and 7.2±2.7 vs. 6.4±2.5; p=0.015, respectively) (Table 1).
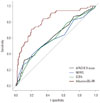
All significant variables in the univariate binary logistic regression were considered when generating models to predict 28-day mortality in patients with severe sepsis. Each scoring system was entered individually into the multivariate logistic regression analysis with clinical variables and laboratory variables among the training set (models 1–3). We also created a model that did not include a scoring system (model 4). Consequently, four models were generated by a stepwise multivariate analysis method in our study. Because pH is highly correlated with HCO3-, this variable was dropped from subsequent models. Table 2 summarizes the results of the multivariate logistic regression analysis. In the models that included scoring systems, the multivariate logistic analysis revealed that no scoring system was associated with 28-day mortality in patients with severe sepsis. Model 4, which did not include a scoring system, demonstrated the largest AUC value of 0.8173 (95% CI, 0.7605–0.8741) among the models. This model was composed of albumin, BE, and RR as predictive factors and showed a significantly higher AUC value than those of conventional scoring systems (p<0.001) (Fig. 2).
Nomogram shows that hypoalbuminemia, low base excess values, and tachypnea predict 28-day mortality
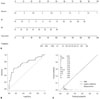
A nomogram incorporating three prognostic factors was established from the final model (Fig. 3). The nomogram illustrated that albumin was the largest contributor to prognosis, followed by BE and RR. By calculating the total number of points and locating it on the total point scale, we were easily able to draw a straight line down to estimate the predicted probability of 28-day mortality. For example, a 55-year-old man presented with complaints of a 3-day history of fever associated with pneumonia. On admission, he presented with tachypnea [20/min (15 points)] and his blood test results were BE=-10 mmol/L (43 points) and albumin=2 g/dL (78 points). The sum of the nomogram values was 136, and the predicted probability for 28-day mortality was 43%.
The p value from the Hosmer-Lemeshow test was 0.61 for model 4, indicating that the model was suitable. In the validation set, discrimination was good with an AUC value of 0.7537 (95% CI, 0.6563–0.8512). The calibration plot of the nomogram presented excellent agreement between predicted and observed probabilities of 28-day mortality, and exhibited a close approximation between the probabilities.
DISCUSSION
In this study, we developed and validated a new nomogram using three independent variables to identify 28-day mortality in patients with severe sepsis in the ED. This nomogram is solely based on hypoalbuminemia, a low BE value, and tachypnea, which are easily and readily obtainable during the patient's course in the ED. Therefore, it can be used to identify patients who are at high risk of severe sepsis and require more aggressive treatment. Our nomogram demonstrated a significantly higher AUC value than those of conventional scoring systems, despite it being simpler than such systems.
We found that the initial albumin value sampled at the time of ED admission was associated with 28-day mortality in severe sepsis patients and was the largest contributor to prognosis. Albumin, which is considered a negative acute-phase protein, is frequently decreased in the acute phase of several diseases such as sepsis or trauma, and its levels are reduced by approximately 10–15 g/L within 1 week of the event.18 Hypoalbuminemia can be caused by reduced hepatic synthesis, a decrease in the supply of amino acids, increased leakage into the interstitial space, and tissue catabolism or distributional issues.19 The reduction in albumin synthesis during inflammation is likely associated with the effect of monocytic products such as interleukin-6 and tumor necrosis factor-α.20 Although the precise mechanisms have not been fully described, serum albumin has protective effects such as maintaining physiologic homeostasis, antioxidant activity, anti-inflammatory effects, and prevention of apoptosis.2122 Therefore, these protective biologic functions may be impaired in hypoalbuminemic conditions, and increased morbidity and mortality can consequently develop in severely septic patients.2324 In patients with community-acquired bloodstream infection who require intensive care, hypoalbuminemia was an independent risk factor associated with global mortality (odds ratio, 0.34; 95% CI, 0.15–0.76).23 A previous study by Vincent, et al.24 also reported that each 10 g/L decline in serum albumin concentration significantly raised the odds of mortality by 137%, morbidity by 89%, prolonged ICU stay by 28%, prolonged hospital stay by 71%, and increased resource utilization by 66%.
BE was defined as the concentration of titratable hydrogen ion required to return the pH to 7.4 while maintaining pCO2 at 40 mm Hg by equilibration.25 BE can be correlated with the level of deterioration secondary to severe sepsis. The decrease in BE during septic shock is associated with critical reductions in oxygen use, resulting in tissue hypoperfusion, anaerobic metabolism, and lactic acidosis.26 Moreover, these were related to mortality in patients with severe sepsis.27 In this study, the initial BE was -6.9±5.3 and -6.9±4.6 mmol/L in survivors vs. -10.5±6.0 and -10.8±7.6 mmol/L in non-survivors in the training and validation sets (p<0.001 and p=0.004), respectively. This result is consistent with a previous study.28 Some scoring systems used pH and lactate values to evaluate metabolic acidosis with tissue hypoperfusion.2930 However, BE has been shown to be superior to pH for evaluating metabolic acidosis. Davis, et al.31 reported that BE was superior to pH as a marker of metabolic acidosis clearance after shock in a retrospective study of 674 patients. Similarly, BE is superior to lactate, because lactate does not entirely account for metabolic acidosis development from systemic hypoperfusion.27 Accordingly, our scoring system more accurately estimated metabolic acidosis in patients with severe sepsis by using the BE value.
Tachypnea is a compensatory mechanism for metabolic acidosis secondary to sepsis. Respiratory difficulty (defined as tachypnea, low oxygen saturation, or high oxygen requirement) was significantly predictive of mortality in septic patients; therefore, recent scoring systems such as the Mortality in Emergency Department Sepsis (MEDS) and Predisposition Insult Response and Organ Failure (PIRO) incorporated tachypnea as a key criterion.3032 In our study, the respiratory rates of deceased patients were 21.9±5.8 in the training set and 21.7±6.2 in the validation set. These results met the tachypneic criteria of the MEDS and PIRO systems.
There are several scoring systems to predict outcomes of severe sepsis patients, with APACHE II and SOFA being the most popular. However, the predictive ability of these conventional scoring systems was somewhat suboptimal; the AUC for APACHE II was 0.71,33 and that for SOFA was 0.708,34 in previous reports. In our study, the AUC values of APACHE II, NEWS, and SOFA were 0.618, 0.594, and 0.601, respectively; these values were significantly lower than those of our new nomogram. One explanation for this outcome may be that the conventional scoring systems were designed for patients in the ICU, not for those in the ED as our nomogram was.
Our new scoring system carries the virtues of simplicity and promptitude to predict 28-day mortality in patients with severe sepsis in the ED. In this study, the variables selected in models 3 and 4 were the same; hence, the AUCs of these two models were the same as well. For the simplicity and promptitude of our new scoring system, we ultimately selected model 4, as it does not include the conventional, complex scoring system. Furthermore, by building a user-friendly nomogram, our system is more readily available, and predicting mortality in severely septic patients is easier to calculate than with other conventional scoring systems. Our nomogram uses the initial values of variables rather than the worst values; therefore, we are able to predict mortality earlier, which can be helpful for selecting high-risk patients who require more aggressive interventions. Several studies reported that early, intensive, and effective treatment could decrease the mortality rate by 8–16%.35 Therefore, our nomogram could be applied to triage decisions, and could be used to select severely ill patients for closer monitoring and aggressive treatment. Additionally, our nomogram includes only three independent variables, while others include a greater number of variables and are thus much more complex to calculate. Our nomogram could be performed significantly more predictably than other scoring systems, with AUCs of 0.8173 from the training set and 0.7537 from the validation set.
This study has several limitations. The main limitation is that it is a retrospective study of data collected from a single center; therefore, it is possible that the results could differ from those of other centers, and the predictive probability could be overestimated compared to a prospective study. Although we performed internal validation to reduce bias, a multi-center study is required for further validation. Another source of bias was the population enrollment criteria, in which organ dysfunction and hypoperfusion were regarded as an initial SBP of <90 mm Hg, despite a 20 mL/kg intravenous crystalloid fluid challenge; or an initial serum lactate level ≥4 mmol/L. These criteria did not completely encompass severe sepsis; however, lactate is a commonly used marker of hypoxic tissue.36 Accordingly, these patients could be regarded as severely septic in our study. Our nomogram did not include information such as the cause of infection or the type of cultured pathogen. However, our goal was to construct a system to predict mortality among patients with severe sepsis, but not to identify a specific infection or pathogen. We performed comparisons with conventional scoring systems, such as APACHE II, NEWS, and SOFA, but these scoring systems are not intended for use in ED environments. However, MEDS, Mortality In Severe Sepsis in the Emergency Department, and PIRO have been developed for use in the ED to risk-stratify septic cases.303237 In a future study, we aim to compare these scoring systems to ours, and to extend the validation to a multi-center study. An increase in treatment bundle compliance improves the outcome of severe sepsis patients.3839 However, we could not accurately measure the compliance rate of EGDT at our institution because of the retrospective nature of this study. The overall mortality rate of our study population was similar to that of a recently published randomized controlled study,40 indicating that our compliance rate was not necessarily lower than that observed in a developed country.
In conclusion, our new nomogram is valuable in predicting the 28-day mortality of patients with severe sepsis and/or septic shock at an early stage after ED admission, and it is superior to the APACHE II, NEWS, and SOFA scoring systems in predicting mortality, and is readily available.

 XML Download