

 PDF
PDF ePub
ePub Citation
 Print
Print


INTRODUCTION
Coronary artery calcium score (CACS) was developed to quantify the extent of coronary calcification. Clinically, it is a surrogate marker for the degree of atherosclerotic plaque burden. CACS is an independent predictor of coronary events and improves cardiovascular risk prediction in asymptomatic patients.12 As such, the current 2013 American College of Cardiology/American Heart Association (ACC/AHA) guidelines recommend CACS as an additional screening tool for cardiovascular risk stratification, and define individuals with a CACS ≥300 Agatston units (AU) as high risk.3
A member of the interleukin (IL)-1 receptor family, ST2 is an emerging biomarker for cardiovascular disease (CVD), especially in response to mechanical stress.4 Its expression in cardiomyocytes is upregulated in response to mechanical stretch, and has been demonstrated to be a new biomarker for heart failure.567 The membrane-bound form of ST2 interacts with IL-33 and can reduce atherosclerosis development, whereas soluble ST2 (sST2), a decoy receptor for IL-33, enhances atherosclerotic plaques in ApoE knock-out mice.8 These animal experiments suggested that ST2 plays an important role in vascular biology. Recent data from the Framingham Heart Study (FHS) showed that elevated sST2 concentrations predict both incident hypertension and changes in blood pressure (BP) typically seen with aging.9 Building on this study, the FHS group examined the association between sST2 and subclinical atherosclerosis in order to elucidate the underlying relationship between the ST2/IL-33 pathway and vascular biology.10 However, no significant association between sST2 and carotid intima medial thickness (IMT) or plaques was found. Currently, no studies have investigated the association between sST2 and CACS, another marker for atherosclerosis. In the present study, we evaluated associations between serum sST2 levels and CACS and compared the abilities of sST2 and high sensitive C-reactive protein (hsCRP) to predict high risk CACS in a community-based Korean cohort for the first time.
MATERIALS AND METHODS
Study participants
The Mapo study is a community-based cohort study that was initiated to investigate the prevalence, correlation, and progression of subclinical CVD. The study cohort comprises residents from Mapo-gu, a metropolitan district within Seoul, Korea, who visited a public health center for a routine health check-up. In the Mapo cohort study, men aged ≥45 years and women aged ≥55 years were enrolled and screened for subclinical atherosclerosis using CACS.
In the present study, we enrolled 456 individuals (285 men, 66.5±5.8 years) who were registered in Mapo-gu cohort between January 2011 and March 2013. Subjects were divided into two groups according to CACS. Selection was determined using an arbitrary cut-off CACS of 100 AU. We selected 228 individuals with a CACS of more than 100 AU and 228 age- and gender-matched individuals with a CACS of less than 100 AU. The Institutional Review Board at Yonsei University College of Medicine approved the study (4-2014-0754), and all participants gave informed consent.
Clinical and anthropometric measurements
All individuals underwent a baseline evaluation including an initial standardized questionnaire. Height, weight, body mass index (BMI), anthropometric data, and BP were measured. Total, low-density lipoprotein (LDL) and high-density lipoprotein (HDL) cholesterol, triglycerides, and glucose levels were measured from blood samples obtained after a 12-hour fast. hsCRP was measured as previously described.11 Smoking was defined as current or former smoker. Dyslipidemia was defined as any of the following: high total cholesterol (>200 mg/dL), high LDL-cholesterol (>160 mg/dL), low HDL-cholesterol (<40 mg/dL for men, <50 mg/dL for women), and/or high triglycerides (>150 mg/dL), or current use of lipid-lowering therapy. Participants were considered to have diabetes mellitus (DM) if they reported a history of DM and/or were receiving anti-diabetic treatment or had a fasting plasma glucose level of at least 126 mg/dL. Hypertension was defined as a self-reported history of hypertension, a history of antihypertensive medication use, and/or a BP of 140/90 mm Hg or more at the time of the visit.
Measurement of coronary artery calcium
All examinations were performed using a 320-row CT system (Aquilion ONE; Toshiba Medical Systems, Tokyo, Japan) with patients in the supine position, and were acquired during a single breath hold, which allows for image reconstruction at a single cardiac phase. Dual scanograms were used for planning the examination and determining the anatomical range to be covered. A non-enhanced prospective electrocardiogram-gated scan was performed to measure CACS with the following parameters: rotation time of 275 ms, slice width of 3.0 mm, tube voltage of 120 kV, and tube current using the Sure Exposure 3D® (Tochigi, Japan) with an automatic exposure control system. CACS was assessed on a postprocessing workstation (Vitrea fX, version 6.4; Vital Images, Minnetonka, MN, USA) using calcium score analysis software (VScore; Vital Images). Coronary scans were used to identify each focus of calcification with a minimal density of 130 Hounsfield units and a minimal voxel size of 1.03 mm3 along the course of the coronary artery.12 Agatston calcium scores were calculated to quantify the extent of coronary artery calcification.13
Measurement of sST2
sST2 concentrations were measured in blood samples (serum) collected after an 12-hour fast, and immediately centrifuged for storage at -80℃. sST2 concentrations were measured using a high-sensitivity sandwich immunoassay (Presage ST2; Critical Diagnostics, San Diego, CA, USA). The performance characteristics of this assay have been recently described.14 The assay has a lower detection limit of 2 ng/mL, and meets acceptable analytical performance criteria, exhibiting an average coefficient of variation of 2.85% for intra-assay and 6.74% for inter-assay variation in our study.
Statistical analysis
Continuous variables are summarized as a mean±standard deviation, and categorical variables are summarized as a percentage of the group total. Variables not in the normal distribution were log transformed for analysis. Continuous variables were compared using independent t-tests or Mann-Whitney U test for non-normally distributed variables. Pearson's correlation analysis or Spearman test for non-normally distributed variables was used to determine simple correlation between continuous variables. A multivariate logistic regression analysis was conducted using all variables significantly correlated with CACS. The net reclassification improvement (NRI) and integrated discrimination index (IDI) for sST2 over hsCRP (and vice versa) was calculated, and the area under the receiver operating characteristic (ROC) curves (AUC) of sST2 and hsCRP were compared using STATA version 13.0 (Stata Corp LP, College Station, TX, USA). A two-tailed p value <0.05 was considered statistically significant. All other statistical analyses were performed with SPSS version 21.0 software (SPSS/IBM Corp., Chicago, IL, USA).
RESULTS
Clinical characteristics and laboratory findings
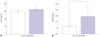
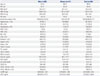
Baseline characteristics of study participants are summarized in Table 1. The mean age, BMI, and systolic BP (SBP) were 66±6 years old, 25.2±2.9 kg/m2, and 124.2±14.9 mm Hg, respectively. Serum levels of sST2 ranged from 10.7 to 197.6 (median 27.9, interquartile range 22.2–35.4) ng/mL. Mean CACS was 237.2±465.0 AU, and there were 99 (21.7%) subjects with a CACS ≥300 AU. Patients with a CACS ≥300 AU were considered as high risk. There was a significant difference in hsCRP (1.27±1.95 mg/L vs. 2.90±9.00 mg/L for high risk patients, p=0.002) (Fig. 1A). No difference was observed in sST2 in this same high risk population (29.7±15.2 ng/mL vs. 32.6±12.2 ng/mL for high risk CACS, p=0.080) (Fig. 1B) between high risk and non-high risk CACS group. Women had a lower waist circumference, SBP, smoking history, fasting glucose, gamma glutamyltransferase (GGT), and uric acid levels. Women had higher dyslipidemia, statin use, total cholesterol, and HDL-cholesterol level. We observed a significant gender difference in serum sST2 levels (33.2±16.8 ng/mL vs. 25.4±8.2 ng/mL, for men vs. women, p<0.001). However, no difference in CACS and hsCRP were observed between genders.
Association of serum levels of sST2 and hsCRP
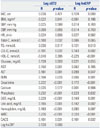
Data regarding the association between sST2 or hsCRP levels and the clinical and laboratory parameters are summarized in Table 2. The LDL-cholesterol, alanine transaminase (ALT), creatinine, GGT, uric acid, white blood cell count (WBC), and CACS correlated with both sST2 and hsCRP levels. Total-cholesterol, glucose, aspartate transaminase (AST), blood urea nitrogen (BUN), serum creatinine, phosphate and hemoglobin correlated with only sST2 level, whereas only waist conference, HDL-cholesterol, and CACS correlated with only hsCRP level. Serum log sST2 level significantly correlated with log hsCRP level (r=0.128, p=0.006).
Comparison of risk stratification of sST2 and hsCRP
According to current AHA/ACC guidelines, we defined patients with a CACS >300 AU to be at high risk. In univariate regression analysis, both log sST2 [odd ratio (OR) 5.900, 95% confidence interval (CI) 1.471–23.668, p=0.012] and log hsCRP (OR 2.812, 95% CI 1.600–4.942, p<0.001) were significantly related to high CACS group. We compared the risk-stratifying power of sST2 and hsCRP in high risk patients using three statistical methods. First, using multivariate logistic regression, we compared the association of sST2/hsCRP with being classified as high risk (Table 3). After adjusting for other risk factors such as age, gender and current smoking status, only log hsCRP was significantly associated with high risk CACS (OR 2.450, 95% CI 1.1336–4.492, p=0.004). When we inserted sST2/hsCRP into the adjusted model as categorical variables (lower vs. higher tertile), only hsCRP (OR 1.858, 95% CI 1.051–3.284, p=0.033) correlated with a high risk CACS, in line with the multivariate regression analysis. Second, we compared AUC in ROC for high risk CACS. In this analysis, we observed no significant differences between sST2 (AUC 0.596, 95% CI 0.520–0.671) and hsCRP (AUC 0.580, 95% CI 0.514–0.647, p for difference=0.64). Third, to determine if any additive prognostic value for predicting high risk CACS was gained by combining sST2 with hsCRP, we compared the NRI for sST2 over hsCRP (Table 4). The NRI for sST2 over hsCRP was not statistically significant (continuous NRI 0.212, 95% CI -0.255–0.453, 20% & 25% risk cut-off NRI 0.0790, p=0.140, IDI 0.002, p=0.269). Meanwhile, however, the NRI for hsCRP over sST2 was significantly different (continuous NRI 0.238, 95% CI 0.001–0.474, 20% & 25% risk cut-off NRI 0.139, p=0.055, IDI 0.022, p=0.035). Collectively, these data indicated that hsCRP provides superior discrimination and risk reclassification for high risk CACS, compared to sST2. In addition, we chose a different cutoff value of CACS (100 or 200 AU) for defining high risk CACS, rather than 300 AU, although we could not find superiority for sST2 over hsCRP for predicting high risk CACS group (data not shown).
Subgroup analysis for gender
Given the observed gender differences in sST2 levels, we performed a subgroup analysis according to sex. In correlation analysis, in men, log sST2 level was associated with glucose (r=0.140, p=0.018), AST (r=0.209, p<0.001), ALT (r=0.185, p=0.002), GGT (r=0.193, p=0.001), WBC (r=0.232, p<0.001), and log hsCRP (r=0.154, p=0.009). These associations were not observed women, in whom log sST2 level was correlated with SBP (r=-0.164, p=0.032) and BUN (r=0.201, p=0.008). We did not find any statistical significance in comparing AUC, NRI, and IDI in either men or women (data not shown).
DISCUSSION
In the present study, we report a significant association of sST2 with hsCRP; both sST2 and hsCRP were significantly associated with CACS in subjects from a community cohort. Also, sST2 did not improve net reclassification for predicting high risk CACS. Overall, hsCRP demonstrated superior discrimination and risk reclassification, compared to sST2.
The CACS is a surrogate marker of the degree of atherosclerotic plaque burden and an independent predictor of coronary events in asymptomatic patients.12 In the Multi-Ethnic Study of Atherosclerosis (MESA) study, several cardiovascular risk markers were compared for their ability to improve the prediction of incident CVD in an intermediate-risk patient population.15 In the study, CACS, ankle-brachial index, hsCRP, and family history were independent predictors of incident CVD, and CACS provided superior discrimination and risk reclassification over other risk markers. Reflecting this, the current AHA/ACC guidelines recommend using the CACS as an additional screening tool for cardiovascular risk stratification.3 Considering the radiation hazard, higher price, and lack of insurance coverage of CACS measurements, biomarker predicting high risk CACS can be meaningful and practical in real-world clinical settings, especially in Korea. For this reason, in the current study, we used CACS as a surrogate marker for CVD risk and compared the value of sST2 and hsCRP in predicting high CACS.
ST2 is an emerging biomarker for diseases related to inflammation, such as CVD, heart transplant, and graft-versus-host disease.1617 There are two functional ST2 isoforms that have opposite roles in immunity. First, a membrane-bound ST2 isoform forms a complex with IL-33 and induces type 2 immune response and tissue repair. In contrast, the sST2 isoform, sST2, appears to work as a decoy receptor and negatively regulates IL-33 function.18 A role for inflammation in the initiation and progression of atherosclerosis has been well established.19 The membrane-bound form of ST2 interacts with IL-33, and this interaction can reduce atherosclerosis development. Conversely, sST2 has been shown to enhance atherosclerotic plaques.8 A recent study from FHS showed that an elevated sST2 concentration predicted incident hypertension, although it was unable to indicate the underlying pathophysiologic mechanism(s).9 Following this study, they investigated the association between sST2 and subclinical atherosclerosis, such as carotid atherosclerosis.10 However, they found no significant associations of sST2 with carotid IMT and plaque. However, this study did not measure CACS. To the best of our knowledge, the current study is the first to investigate the possible correlation between serum sST2 level and CACS, an established marker for subclinical atherosclerosis.
In our study, sST2 levels in women were significantly lower than those in men (Table 1). This is consistent with a recently published study from the FHS.20 In our study, the pattern of association of sST2 with other clinical and laboratory parameters differed according to gender. In the FHS study, sST2 level was correlated with gender (female), age, SBP, use of antihypertensives, and DM. Among these clinical correlates, only female sex was significantly correlated with sST2 levels in our study (regression coefficient=-0.259, p<0.001). This discrepancy may results from a number of differences between the current study and the FHS study. First, it may result from the differences in baseline clinical characteristics. Our study participants were older (66 years old vs. 59 years old) and had a higher prevalence of hypertension (57% vs. 25–29%) and DM (20% vs. 9–12%). Also, our participants had higher cardiovascular risk characteristics, compared to those in FHS. Lastly, we cannot rule out that these differences may result from ethnic differences in the study populations. Data regarding sST2 in the Asian community is sparse. This is especially true in an asymptomatic community rather than heart failure patients. Further study is warranted to address this gap in our knowledge.
In our study, although sST2 levels were correlated with CACS, they were not predictive of high risk CACS subjects. In contrast, hsCRP levels could a high risk CACS, providing superior discrimination and risk reclassification. Previous studies have also shown the association between hsCRP and CACS. In the MESA study, inflammatory markers, such as CRP, IL-6, and fibrinogen, were weakly associated with CAC presence and burden. The authors of that study suggested that inflammatory biomarkers and CAC may reflect a distinct pathophysiology of atherosclerosis.2021 Also, a recent report from the Ludwigshafen Risk and Cardiovascular Health (LURIC) study showed that sST2 is not associated with coronary angiographic disease severity.22 Our data were consistent with these findings. Qasim, et al.23 reported a strong gender association for CRP with CACS, and based on this, implied that CRP may be more useful as a biomarker in women. In a Korean study, the association between CRP and CACS was found to differ according to HDL-cholesterol levels.24 We did not observe this gender/HDL level-specific association in our study (data not shown). The lack of an association between sST2 and CACS/carotid IMT in the current and previous studies suggest that sST2 may not be a biomarker directly associated with vascular pathophysiology. Rather, increased sST2 may result from other pathophysiologic mechanisms, such as increased cardiac load, resulting in increased mechanical stretch of the heart, and may be more useful to predict hypertension.910 Indeed, recent work has demonstrated an association between sST2 and left ventricular hypertrophy in hypertensive patients2526 and a positive association between sST2 and carotid-femoral pulse wave velocity.27 Further studies are needed to verify these results.
Our study was not without limitations. First, the relatively small size of the study population limits the power of the study. This may, in part, explain the discrepancy between the FHS study and our data. Second, this is a cross-sectional observational study. As such, we are unable to explain any cause and effect of the associations. However, this study generates new hypotheses for future investigations; larger, prospective, and follow-up studies are needed. Third, the study population was comprised of relatively old and overweight hypertensive patients. This may confound the association of sST2 and CACS and weaken the associations among sST2, hsCRP, and CACS. Therefore, extending our findings to the general population should be done with caution. Fourth, we selected individuals according to CACS, potentially introducing recruitment bias. Lastly, our AUC analysis did not find hsCRP to be superior over sST2 for predicting CACS. This may result from our limited sample size, and thus, a larger study is warranted.
In conclusion, we noted a significant association between sST2 and CACS in a community cohort for the first time. Nevertheless, hsCRP demonstrated superior discrimination and risk reclassification of CACS, compared with sST2. In this study, use of sST2 as a biomarker did not improve the net reclassification for predicting high risk CACS.


 XML Download