

 PDF
PDF ePub
ePub Citation
 Print
Print


INTRODUCTION
For degenerative lumbar spinal disease (DLSD), most surgical indications reside on failed non-operative treatment, but there is still a lack of consensus among clinicians regarding the indications for surgical intervention,12 which is causing increased demand for costly surgical procedures as a challenge for any health care system.3 Absolute surgical indications for DLSD are limited to rapidly progressive neurologic decline, clinically relevant motor deficits, or cauda equina syndrome.4 Up to now, many studies regarding prognostic factors of the surgical outcome after spine surgery have reported psycho-social status and coexisting diseases.567
In the present study, we aim to introduce the predictive value of a quantitatively described formula model in a multicenter prospective analysis using the EuroQol-5 dimensions (EQ-5D) health scale to anticipate the postoperative improvement in patients undergoing spinal fusion surgery for DLSD.
MATERIALS AND METHODS
All experimental protocols involving human participants were approved by the Institutional Review Board of each participating institution (IRB No. 4-2009-0305).
Patients
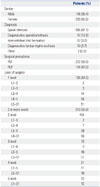
From July 2009 to December 2009, 376 patients (148 males, 228 females; mean age: 69 years, range: 51 to 91), who underwent spinal surgery, including decompressive laminectomy and fusion procedure for various degenerative conditions, such as intervertebral disc herniation (IVDH), spinal stenosis (SPS), degenerative spondylolisthesis (DS), and degenerative lumbar scoliosis (DLS), were included (Table 1). Before surgery, each enrolled patient received at least 3 months of non-operative treatment. Indications for lumbar fusion surgery were as follows: 1) existing dynamic instability/spondylolisthesis, and/or anticipated iatrogenic instability after decompressive surgery for SPS, IVDH, and DS; 2) or sagittal/coronal imbalance accompanying at least 10 degree deformity for DLS.3 Enrollment and follow-up of the study participants are presented in Fig. 1.
Assessments
We evaluated the surgical outcome protocols for DLSD at 17 tertiary hospitals (14 hospitals attached to medical colleges and three general hospitals) carried out by 17 different spine surgeons for spinal fusion patients, using a self-administered questionnaire. The evaluation of the patients who underwent spinal surgery was prospectively carried out using a self-administered questionnaire under the supervision of clinical research coordinators (CRC). CRCs were trained to evaluate patients in a standardized manner and were also blinded to the preoperative data, so as not to bias the data for the postoperative questionnaire.
The EQ-5D consisted of the EQ-5D descriptive system and the EQ visual analogue scale (EQ-VAS), and could be used to evaluate surgical outcomes of spine surgery.8 The EQ-5D descriptive system comprised the following five dimensions: mobility (M), self-care (S), usual activities (A), pain/discomfort (P), and anxiety/depression (D). Each dimension had three levels: no problem was scored as 1, some problems were scored as 2, and severe problems were scored as 3. The general health status using EQ-VAS scale was designed to assess patients' self-rated health on a visual analogue scale, which ranged from 0 (worst imaginable health state) to 100 (best imaginable health state). Quality of life and general health status were evaluated using the EQ-5D and EQ-VAS on the day before the surgery, followed up at 3 months and 1 year postoperatively.
Using the EQ-5D index value calculator provided by EQ-5D, 5 dimensions were utilized to calculate EQ-5D index.9 A minimal clinically important difference or a substantial benefit of the calculated EQ-5D (cEQ-5D) index was defined as a difference of more than 0.05.9 We applied it for the difference between each measure before and after the treatment in the present study. Surgical outcomes were defined as 'improvement', a postoperative improvement in the cEQ-5D index more than 0.05 (>0.05); 'aggravation', postoperative worsening of cEQ-5D index more than 0.05 (<-0.05); 'no change', cEQ-5D index between improvement and aggravation as -0.05≤ difference of cEQ-5D index ≤0.05. Also, EQ-VAS for general health status between the preoperative and postoperative 1 year measures were compared and defined as 'improvement', the difference of the general health status >0; 'aggravation' the difference of the general health status <0; 'no change', the difference the general health status=0, from postoperative 1 year measure to preoperative measure.
Statistical analysis
The stepwise logistic linear regression analysis was performed to predict the highest successful outcome using binary variables which were defined as 1 'improvement' of cEQ-5D and general health status and as 0 'aggravation' and 'no change' of cEQ-5D and general health status with given sets of the 5 items of the EQ-5D. The classification and regression tree (CART) method was utilized to introduce a formula score to decide the cutoff value based on the classification mismatch rate of the actual surgical outcome and the expected outcomes calculated from the preoperative measure of the EQ-5D instrument.
A p value of less than 0.05 was considered to be statistically significant. Other basic statistics including ANOVA, independent t test and multivariate regression analysis were also used. All statistical analyses were done with the support of the Department of Applied Statistics, School of Business, Yonsei University, Seoul, Korea.
RESULTS
Practice patterns
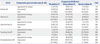
Surgical procedures included postero-lateral fusion with instrumentation (222 procedures, 59.0%) and posterior interbody fusion with instrumentation (154 procedures, 41.0%), and 166 cases (44.2%) of single level surgery and 210 (55.8%) of multilevel surgery (Table 1). At postoperative 1 year, each of 12 patients demonstrated adjacent segment problem (3 cases), pseudoarthrosis/non-union (7 cases) and spinal instrument related complication such as pedicle screw pulling-out (1 case) and rod breakage (1 case).
Changes in patients' quality of life
Scores for all items on the EQ-5D significantly improved at three months and 1 year after surgery compared to their preoperative measures, including the dimensions of M, S, A, P, D, and cEQ-5D (p<0.05, ANOVA). Preoperative measures were: M=2.06±0.52, S=1.77±0.62, A=2.06±0.56, P=2.40±0.52, D=1.75±0.60, and cEQ-5D=0.32±0.30. At 3 months postoperative, each measure improved to M=1.66±0.54, S=1.64±0.58, A=1.77±0.54, P=1.84±0.47, D=1.30±0.47, and cEQ-5D=0.59±0.22. At 1 year postoperative, each measure improved to M=1.60±0.52, S=1.45±0.53, A=1.77±0.54, P=1.31±0.50, D=1.31±0.47, and cEQ-5D=0.63±0.21.
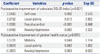
In the logistic regression analysis, preoperative S, A, P, and D significantly affected the postoperative improvement of the cEQ-5D (p<0.05) (Table 2).
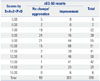
In total, 283 patients demonstrated 'improvement' in cEQ-5D measure but 93 patients showed 'aggravation/no change' at postoperative 1 year, shown in Table 3. Preoperative level of each dimension in EQ-5D scale depending on the 'improvement', 'aggravation', and 'no change' status of cEQ-5D index is also presented in Table 3.
Cut-off value and mismatching rate based on cEQ-5D
In the CART analysis, the surgical indication formula was suggested to be as follows, using each dimension of the EQ-5D instrument:
The surgical outcome of the cEQ-5D was affected most strongly by the score of the P dimension as P was weighted 2 fold compared with the other dimensions S, A, and D in the formula (Table 2).
Changes in the general health status
The average general health status was 58.42±20.58 preoperatively, which increased significantly to 71.49±15.41 at postoperative 3 months and to 73.84±16.23 at 1 year after the operation (p<0.05).
In the logistic regression analysis, preoperative M significantly affected the postoperative improvement of general health status positively (p<0.05) (Table 2). Although, preoperative A and D indicated each positive and negative correlation coefficient with postoperative improvement of general health status, they were only statistically marginally significant (p=0.062, 0.063).
At postoperative 1 year, in the general health status measure, 266 patients demonstrated 'improvement', but 110 patients showed 'aggravation/no change' (Table 6).
Subgroup analysis (Table 7)
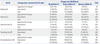
Among 68 patients with a formula score of ≤8, only 18 (27.3%) patients showed improvement in the cEQ-5D at 1 year postoperatively (p<0.05, CART analysis). 265/308 (86.0%) of patients with a formula score of ≥9 demonstrated significant improvement in the cEQ-5D at 1 year postoperatively (p<0.05, CART analysis).
EQ-5D measures and cEQ-5D indexes depending on the surgical outcome between score group of ≤8 and ≥9, are presented in Table 7.
There were no differences in the demographic statistics including age, the distribution of gender, diagnosis, surgical procedures, and the level of surgery between groups. In the additional multiple regression analysis, age over 70, co-existing morbidity, presence of pseudoarthrosis (non-union) and/or implant failure, and level of surgery demonstrated negative correlation with cEQ-5D and general health status at 1 year postoperative (p<0.05). There were no statistically significant correlation with gender, diagnosis and surgical procedure.
DISCUSSION
The superiority of surgical outcomes in treating DLSD was proven by the Spine Patients Outcome Research Trial (SPORT) study up to 8 years postoperatively10111213141516 and also by postoperative improvements in terms of serum vitamin D levels and risk of falling.171819
Severity of stenosis or instability among most degenerative spine conditions does not correlate with the patients' symptoms.20 During the past decades, reports of health related quality of life (HRQOL) related to low back pain and degenerative spine conditions have increased, reflecting a better understanding of the psychometrics and clinical utility of these measures. Therefore, the importance of these aspects should be weighted in the clinical setting when considering surgical indications based on HRQOL.21
As for the short form-36 (SF-36) and oswestry disability index (ODI), clinicians have been introduced to the concept of the minimal clinically important difference212223 and substantial clinical benefit.24 Likewise, the EQ-5D to determine health state values in patients with DLSD may be more appropriate than the SF-6D.21 Thus, we studied the sensitive cut-off line based on patients' HRQOL based outcome measurer, the EQ-5D.
Health state utility values in patients undergoing lumbar fusion surgery after short-term and long-term follow-up and in comparison with other diseases, were shown to have similar values to those in patients with chronic renal disease, Crohn's disease, or coronary artery disease.21 After lumbar fusion surgery, patients have health state utility gains similar to those of patients after interventional treatment for unstable angina.25
However, conservative treatment also has the capacity to improve patients' symptoms and HRQOL. The physician should negotiate with patients about the timing of the surgery in case the patients' symptoms are refractory to non-operative treatment, which hampers the QOL of the patient. Then, when can the surgery-indicated patients obtain best outcomes?
For answer to this question, we found only an article that reported that mental health among the SF-36 domain affects the surgical outcomes rather than the decision making to undergo surgery.26
In the present study, we found that among the 5 dimensions P is the most affective factor, which had a 2-fold weighted value of measure to ensure the favorable outcome of surgery, compared with other dimensions. In other words, as shown in other papers, the pain component affected the surgical outcomes as well as played a major role in the decision making to undergo surgery, similar to the equivocal domain of bodily pain in the SF-36.
Statistically, the p value of P demonstrated the lowest value, which means that it is the most affective factor among the 5 dimensions in the regression model. The positive value of the regression coefficient indicated that the preoperative higher score (the worst status) was more likely to be improved postoperatively. Interestingly, the regression coefficient of D was also a positive correlation of the cEQ-5D, although the coefficient was the lowest among others (S, U, and P), differing from the result that better mental health status resulted in the better outcomes in treating low back pain.27
This could be explained by the fact that the cEQ-5D is calculated based on each dimension to better present the objective overall health status. In other words, the mental component scores were measured based on the subjective self-health status in line with other dimensions, which could be easily affected by the depressive mood of individuals.
In the general health status using the EQ-5D VAS scale, only the worst preoperative M scores demonstrated significant correlation with the better surgical outcomes. Therefore, careful interpretation between an objective cEQ-5D standard and a subjective general health status should be taken into account, since the worse (higher) preoperative score of each EQ-5D scale could get a better postoperative result, but it could be recorded as the opposite or non-correlative in reporting general health status.
It is well proven that the most powerful predictor of a good outcome after surgery for lumbar SPS is a patients' favorable self-assessment of their own health (as good or excellent).126 If the patients have a psychological weakness, the surgical outcome of DLSD could be worse than expected. We confirmed that all of the EQ-dimensions could be utilized as tools of decision making and surgical outcome estimators, with the exception of the M dimension. This exception would be due to self-limitation of activity of daily living, depending on the overall health status of patients.
Up until now, health status outcome measurements were used to determine the postoperative QOL change. The use of SF-36 bodily pain and physical functioning followed a dose-response model in which worse (lower) scores tended to lead to more patients choosing surgery at an equal rate. In contrast, the ODI followed a threshold model in which scores above 30 led patients to choose surgery more often.26
However, this is the first report in which each domain of the EQ-5D instrument can be used to establish the surgical outcome of expecting models based on the actual surgical outcomes of enrolled patients. This model could also be applied to determine the expected surgical outcome for surgical candidates when planning DLSD surgery.
Our formula could be used as a predictor and possible decision making tool simultaneously, because it demonstrated a positive anticipation of clinical outcomes in as many as 86% of the involved cases with a cutoff value of 9 or over.
This study has several limitations to discuss. Firstly, enrolled patients were limited to those who underwent their first surgery for DLSD. In general, primary cases have better health related outcomes than the revision cases.21 To optimize the surgery effect, having the first surgery at the proper timing should be emphasized.21 Because this study aimed to determine the best surgical indication for primary cases, further investigation on revision surgeries is necessary in future.
Another limitation is that we did not separate the diagnostic sub-categories of the DLSD, such as SPS (central, foraminal or lateral recess stenosis) and DS, which has been done in the SPORT study.132628 But, in these studies, they failed to present direct comparisons of each outcome related to the surgery of each diagnosis. They concluded only the difference between the two surgical outcomes that was better in the DS and would be related to the additional fusion surgery rate to secure the instability between DS and SPS.28 In the present study, therefore, only patients who underwent fusion surgery were enrolled. Furthermore, we had greater number of loss during follow-up period in patients who underwent decompressive surgery only, consequently we decided to analyze the decompressive and fusion surgery patients group first.
Finally, there might be a ceiling effect of our suggested formula when considering the less than 8 scored patients. Those patients mostly tend to score each dimension of S, A, P, D as 1 or 2, which could not be improved after surgery. Therefore, this formula could be better for the higher (worse) scorers to evaluate the postoperative improvement.
This study also demonstrated the primary outcomes of only 1 year postoperatively in treating DLSD. However, as Weinstein, et al.14 suggested, it is highly likely that the surgical treatment and any improvements in the patients' symptoms can be discerned as of 1 year postoperative. Further secondary long-term follow-up data for up to 2 years could enlighten these results.
In conclusion, we suggest that S+A+2×P+D≥9 in the EQ-5D can quantitatively describe the surgical indications for DLSD. With a definite DLSD lesion confirmed by an imaging study, patients who meet the formula scores of 9 or over and have refractory symptoms to non-operative treatment could be better surgical candidates, resulting in satisfactory surgical outcomes of over 86% based on cEQ-5D scores, than 8 or lower scored patients.


 XML Download