

 PDF
PDF ePub
ePub Citation
 Print
Print


INTRODUCTION
Although there are no generally accepted criteria for surgical treatment of partial anterior cruciate ligament (ACL) tears, interest on rupture pattern with respect to individual bundles based on the double bundle (DB) anatomy of the ACL and its biomechanical properties has increased recently,123456789101112 and these studies suggest that partial ruptures, depending on injury mechanism, can exclusively affect individual bundles. For example, an anteriorly directed force has the potential to damage the anteromedial (AM) bundle, whereas a pivoting action can injure the posterolateral (PL) bundle.12 In addition, rupture patterns of AM and PL bundles vary widely, and depend on whether injuries result from mild elongation or severe stretching. Based on this anatomically and biomechanically orientated DB concept, researchers have focused recently on anatomical DB ACL reconstruction71314151617 and the treatment of symptomatic partial ACL tears using individual bundle reconstruction techni-ques.51819 However, surgeons are posed with a dilemma as to how to evaluate the viabilities and functionalities of remaining bundles and how to determine which bundle should be preserved or sacrificed. As a result, surgeons must rely on subjective feelings of the relative laxity of bundles intraoperatively.19
Recent studies reported 10–25% of ACL surgery provides a good indication of ACL augmentation.5 In the present retrospective study, we performed selective bundle reconstruction in a more active manner, that is, we tried to preserve moderately attenuated bundles, and only reconstructed bundles that were considered completely torn or remained tensionless during arthroscopic probing. Also, we conducted DB ACL reconstruction for cases with completely torn both bundles.
The purpose of this study was to compare the clinical outcomes of arthroscopic anatomic DB ACL reconstruction with selective AM or PL bundle reconstruction while preserving a relatively healthy ACL bundle. The study hypothesis was that postoperative antero-posterior, rotational, and knee scores in three groups would significantly improve compared to preoperative data. We also hypothesized that there would be no postoperative clinical differences between DB ACL reconstruction and selective bundle ACL reconstruction.
MATERIALS AND METHODS
Demographic data
Herein, 98 patients who underwent DB ACL reconstruction or selective AM or PL bundle reconstructions between September 2007 and February 2011 with a mean follow-up of 30.8±4.0 months were included in this study. The study protocol of this retrospective comparative study was approved by our Institutional Review Board. The final decision to proceed to DB ACL reconstruction or selective bundle reconstruction was made during arthroscopy. Patients with remnant ACL fibers corresponding to the AM or PL bundles were surgically indicated for selective bundle reconstruction.
Remnant fibers corresponding to the AM or PL bundles were preserved when their thickness was at least one third of its original diameter, remnant fibers were still bridging the femur and tibia,5 and when there was acceptable tension under arthroscopic probing while applying an anterior drawer force (less than 5 mm laxity). Using this protocol, 34 individuals underwent selective AM bundle reconstruction (group B), and another 30 received selective PL bundle reconstruction (group C). The remaining 34 patients, in which ACL fibers were completely torn from the intercondylar notch or reattached to PCL fibers, underwent DB ACL reconstruction (group A). Mean follow-up periods of each group were 29.0±19.7 months in group A, 31.9±3.8 months in group B, and 31.8±3.6 months in group C. The inclusion criteria were as follows: patient was diagnosed as having ACL injury by Lachman test, pivot shift test, and magnetic resonance imaging (MRI); patient underwent selective bundle reconstruction or DB ACL reconstruction. Patients who received single-bundle ACL reconstruction due to a small femoral footprint (smaller than 14 mm in diameter)20 or revision surgery were excluded. In addition, we also excluded patients with multiple ligament injury, such as a concomitant posterior cruciate ligament rupture or PL corner injury, and patients who underwent bilateral ACL reconstruction.
There were 91 men and seven women. Mean age at time of surgery was 31±10.2 years (16–53 years). Injuries were sports related in 72 cases, a fall from height in 17 cases, and a traffic accident in 9 cases.
The average delay between injury and operation was 23 weeks (range 1 week to 250 weeks). The surgical procedures were performed by the senior author, and a double looped tibialis anterior allograft was used in all cases. Patient demographic data are summarized in Table 1.
Operative procedure
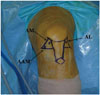
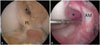
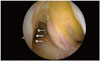
All patients were operated in the supine position using a leg-holding device under tourniquet control. Standard AM and anterolateral portals were used for arthroscopic intraarticular inspection, and the AM portal was used to inspect the ACL femoral attachment. This portal enables visualization of the entire medial wall of lateral femoral condyle and the identification of the various ACL injury patterns. An accessory anteromedial (AAM) portal was then established to remove the torn bundle while preserving the remnant. This portal was also used later to establish the femoral tunnel (Fig. 1). The advantage of the AAM portal has been well described previously.2122232425 We decided to perform DB ACL reconstruction or selective bundle reconstruction according to the status of the bundles. Selective ACL reconstruction was performed if ACL remnants met the above criteria, which comprised remnant fibers corresponding to the AM or PL bundle still bridging the femur and tibia and relatively good tension under proper probing while applying a force to translate the tibia anteriorly (Fig. 2). Meanwhile, DB ACL reconstruction was performed when both bundles were completely torn or when the ACL was absent, as in chronic cases (Fig. 3).
In case of selective bundle reconstruction, a torn AM or PL bundle was removed. The size of the femoral tunnel was determined by the size of the AM or PL femoral footprint. In case of DB reconstruction, 2-mm bony bridge between two femoral tunnels was considered, while the center of the tunnel was marked.20 For the femoral PL bone tunnel, the center of the PL footprint was marked with a microfracture awl through the AAM portal under 90° of knee flexion. A guidewire was inserted at the center of the PL footprint under 110° of knee flexion through the AAM portal, and reaming was performed while maintaining the same degree of knee flexion. For the femoral AM bone tunnel, we positioned the microfracture awl in the center of the AM footprint through the AAM portal under 90° of knee flexion.26 A guidewire was then positioned at the previously marked center of the AM footprint and over drilled using the reamer, which was inserted through the AAM portal under 130° of knee flexion. For double-bundle ACL reconstruction, the PL femoral tunnel was made first. Graft sizes and tunnel lengths were measured intraoperatively. The diameters of the AM and PL grafts in each group were compared. Tunnel lengths in each group were also compared.
Under visualization from the AM portal, the tibial footprints of the AM and (or) PL bundles were marked using a thermal device (ArthroCare, Sunnyvale, CA, USA). To create the tibial AM bone tunnel, the tip of the ACL guide system (Acufex Smith & Nephew, Andover, MA, USA) was placed at the AM footprint about 5 mm lateral to the medial tibial spine and 5 mm posterior to the anterior rim of the of the native AM bundle, while maintaining an angle of 55° to the tibial plateau.18 A tibial bone tunnel with an equal diameter to corresponding femoral tunnel was then made taking care not to damage the anterior tibial cortex or intermeniscal transverse ligament. To create the tibial PL bone tunnel, the tip of the guide at the PL footprint was positioned 5 mm medial to the lateral tibial spine and 5 mm anterior to posterior root of the lateral meniscus at an angle of 45 degrees to the tibial plateau.15
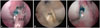
A doubled loop of tibialis anterior allograft over an EndoButton CL (12 mm in length, Smith & Nephew Endoscopy, Andover, MA, USA) was used as a graft for both selective and DB reconstruction, and both ends of tendon grafts were whipstitched with FiberWire sutures. During DB ACL reconstruction, the allograft was split to obtain two suitable grafts for the AM and PL bundles with diameters of 6, 7, or 8 mm corresponding to the tunnel diameter. Prepared grafts were then passed from the tibial bone tunnel to the femoral bone tunnel. Femoral fixation was performed by using the EndoButton. Grafts were preconditioned by pulling tibial sides during 20 knee flexion-extension cycles. Tibial fixation was performed using bioabsorbable interference screws of the same diameter as the tunnel, and reinforced with staples. Both AM and PL grafts were fixed at full knee extension, based on the findings of our previous biomechanical study.11 Finally, grafts were inspected to confirm a full range of knee motion and the absence of roof or lateral wall impingement. An arthroscopic view of reconstruction of both bundles or selective bundles is illustrated in Fig. 4.
Rehabilitation
The rehabilitation protocol used in all patients was similar to that of standard ACL reconstruction. Full extension and quadriceps exercises were encouraged during the first postoperative week and heel-gliding exercise was allowed to obtain full range of knee motion thereafter. We recommended partial weight bearing during the 1st postoperative week and full weight bearing thereafter. Bracing was permitted without motion restriction for 12 weeks. Running was authorized at 12 weeks after surgery, and contact sports were permitted from 6 months postoperatively.
Evaluations
Patients were assessed preoperatively and at final follow-up after the surgery. Every test was performed by the same surgeon (Y.J.S). Degree of translation in stress X-ray was checked with the knee under 90° of flexion. Lachman test and a KT-2000 arthrometer (MED metric Corp, San Diego, CA, USA) were checked under 30° of knee flexion.
Anterior instability
Side-to-side anterior instability was assessed using a KT-2000 arthrometer, stress X-ray, and Lachman test. Lachmann test was done under anesthesia on the day of the operation. Objective data using KT-2000 was obtained at 30° of knee flexion under an anterior drawer force of 133N (30 lbs). A stress X-ray was checked at 90° of knee flexion under anterior drawer force using a Telos device. Results of the arthrometer measurement and degree of translation on the stress X-ray were recorded as a side-to-side difference between the injured and uninjured knees. Lachman test was conducted at 30° knee flexion. Lachman test results were classified as grades I (<5 mm), II (5–10 mm), and III (10–15 mm).
Pivot shift test
Intraoperative pivot shift test results under anesthesia were collected as preoperative data. Postoperative pivot shift test was performed at final follow up. Both the injured and uninjured knees were assessed. Pivot-shift test results were classified as grades 0 (normal), I (Glide), II (Clunk), and III (Gross).
Functional score
Lysholm knee score was used to evaluate subjective data concerning daily living activities. The International Knee Documentation Committee (IKDC) score was obtained to evaluate objective data concerning the affected knee. Preoperatively, the two scores were recorded on first day at admission. Postoperatively, the scores were recorded at final follow up (at a mean of 30.8±4.0 months after the operation).
Statistical analysis
Based on the results of difference in STS difference measured by KT-2000 between pre- & post-op assessment, when the total sample size across the three groups was 98 (DB group: n=34; AM group: n=34; PL group: n=30), an one-way analysis of variance (ANOVA) had 99% power to detect at a 0.05 level a difference in means, assuming that the common standard deviation of 2.0.
The paired t-test was used to compare preoperative and postoperative data in each group, and the differences between the data of each group (including demographic data except gender ratio) were analyzed statistically using one-way ANOVA, with the Tukey honestly significant difference test for pair wise comparisons. Chi-square test was used to compare the data regarding gender ratio, Lachman test, and pivot shift test. Significance was accepted for p-values <0.05. All analyses were performed using SPSS for Windows (version 21.0, SPSS Inc., Chicago, IL, USA).
RESULTS
Assessment of demographic data
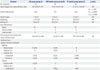
No statistical differences were noted preoperatively among the three groups with regard to age, height, weight, body mass index and mean time between injury and operation. Gender ratio was significantly different between group A and groups B and C, respectively. The overall demographic data are illustrated in Table 1.
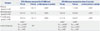
The average AM graft diameter in group A was 6.5±0.6 mm, and PL graft diameter was 6.7±0.5 mm. Average graft diameters were 7.6±0.6 mm in group B and 7.3±0.8 mm in group C. In group A, mean AM and PL tunnel lengths were 34.8±2.3 and 39.4±1.6 mm, respectively. In group B, mean AM tunnel length was 38.7±6.9 mm, and in group C, mean PL tunnel length was 40.1±2.0 mm, without significant difference between the two groups. The mean length of the PL femoral tunnel in group A was significantly longer than that of the AM femoral tunnel in the same group (p<0.001). The data are summarized in Table 2.
Anterior instability
Mean side-to-side instrumented laxities using the KT-2000 device at 30° of knee flexion were 8.3±1.7 mm in group A, 6.6±1.6 mm in group B, and 5.8±1.5 mm in group C preoperatively, and these improved significantly to 1.8±1.4 mm in group A, 2.2±1.4 mm in group B, and 1.9±1.0 mm in group C at last follow-up (all p<0.001). Regarding intergroup differences in terms of preoperative KT-2000 values, although there was no significant differences between groups B and C, the preoperative values of group A were found to be significantly greater than those of groups B and C (p=0.001, respectively). No significant intergroup difference was noticed with respect to postoperative side-to-side instrumented laxities (Table 3).
Degree of side to side translation in stress X-ray conducted at 90° of knee flexion were 7.5±2.5 mm in group A, 5.6±2.0 mm in group B, and 5.1±1.6 mm in group C preoperatively, and these improved significantly to 1.1±0.8 mm in group A, 0.9±0.6 mm in group B, and 0.6±0.7 mm in group C at last follow-up (all p<0.001). The preoperative translation in group A was significantly greater than that in groups B and C (p=0.001, p<0.001, respectively) (Table 2).
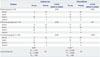
In the preoperative Lachman test, all patients showed positive results in all groups. In group A, 7 patients showed grade I, 20 patients showed grade II, and 7 patients showed grade III. In group B, 12 patients showed a grade I, 20 patients showed grade II, and 2 patient showed grade III. In group C, 14 patients demonstrated grade I instability, 16 patients demonstrated grade II, and 0 patients demonstrated grade III. A significant difference was found in preoperative Lachman test results between groups A and C. There were no significant differences among three groups postoperatively (Table 4).
Pivot shift
In preoperative pivot-shift test, all of the patients in group A had positive results; grade I (Glide) in 18 cases and grade II (Clunk) in 16 cases. In group B, 17 of 34 patients (50%) showed positive results; grade I (Glide) in 14 cases and grade II (Clunk) in 3 cases. In group C, 20 of the 30 patients (67%) showed positive results; grade I (Glide) in 18 cases and grade II (Clunk) in 2 cases. Significant differences were found in preoperative data between groups A and B and between groups A and C (p<0.001, p<0.001, respectively). There was no significant difference between the data of groups B and C, preoperatively.
The postoperative pivot-shift test at last follow up was positive in 14 cases (grade I) in group A (41%), 13 cases (grade I: 10 cases, grade II: 3 cases) in group B (38%), 11 cases (grade I) in group C (37%). There were no significant differences among three groups in terms of postoperative pivot shift data. Table 4 shows overall pre- and postoperative pivot shift data.
Functional score
In IKDC score, preoperative test results were abnormal and severely abnormal in 23 patients (68%) in group A, 17 patients (50%) in group B, and 13 patients (43%) in group C. Whereas, postoperative test results were normal and nearly normal in 32 patients (94%) in group A, 30 patients (88%) in group B, and 28 patients (93%) in group C (all p<0.001) (Table 4).
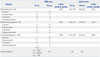
Lysholm knee scores improved significantly from 59.4±14.9 to 86.0±6.9 in group A, 56.0±13.3 to 85.9±4.8 in group B, and from 57.4±14.6 to 85.5±5.6 in group C (all p<0.001). No significant intergroup difference was found with respect to postoperative IKDC and Lysholm knee scores (Table 5).
DISCUSSION
This study highlights several interesting aspects. First, it compares the clinical results of selective bundle and DB ACL reconstruction. Little information is available in the literature on this subject, although Adachi, et al.27 compared the clinical outcomes of ACL augmentation and ACL reconstruction. Their augmentation procedure used single bundle graft with over-the-top femoral tunnel position, whereas both the DB reconstruction and selective procedures in this study have the same purpose in terms of restoring the anatomical DB structure of the ACL. Postoperative data exhibited significant improvement compared to preoperative data in all groups. Also, postoperative clinical outcomes between the three groups showed no significant differences, except anterior displacement measured by stress X-ray at 90° of knee flexion. These results support our hypothesis. Second, group A (DB group) showed significantly greater anterior translation at 30° of knee flexion with KT-2000 and 90° of knee flexion with stress X-ray, compared to groups B (AM bundle group) and C (PL bundle group). These results partly concur with a previous study suggesting that remnant ACL fibers could contribute to resisting forces to anterior translation loads.28 Furthermore, greater preoperative rotational instability checked by pivot shift test was found in group A (100% positive), compared to groups B (50% positive) and C (67% positive). We believe precise preoperative clinical evaluation including anteroposterior instability and pivot shift test could provide a clue for operative options for selective bundle reconstruction.
Siebold reported that AM bundle tears show greater instability at anterior drawer test at 90° of knee flexion and KT-1000 at 30° of knee flexion rather than PL bundle tear. Some have suggested that PL bundle tears have a greater effect on rotational stability than AM bundle tears.18 In contrast to these theoretical concepts, our data revealed that there was no significant difference between groups B (AM bundle group) and C (PL bundle group) in terms of preoperative anterior instability and pivot shift test. The possible explanation for this disparity between the theoretical concept and the present clinical data is that a pure AM or PL bundle tear in clinical situations is very rare. Although the tear patterns of groups B and C in the present study varied and the degree of attenuation differed between the AM and PL bundles, both the AM and PL bundles exhibited considerable attenuation. Regardless of which bundle was saved, moderate attenuation of the remaining bundle caused greater preoperative side-to-side anterior instability and rotational instability than those in previous reports.18
The clinical appearances, imaging characteristics, and treatment plans of partial tears are topics of debate. It is difficult to achieve a definite diagnosis of an isolated bundle tear by MRI, because how much intact ligament remains cannot be estimated, and no conclusive criteria are available for the assessment of individual bundle quality. Several treatment options are available for preserving ACL remnants in partial ACL tears. Both conservative and surgically options based on augmentation and selective bundle reconstruction techniques are available. Good clinical results have been reported after conservative treatment due to the intrinsic healing ability of ruptured ACLs.2930 However, these results are still subjects of debate, and as yet, there is no clear understanding of the indications for conservative treatment.
Meanwhile, the proven biologic and biomechanical advantages of preserving the ACL remnant have motivated development of current augmentation and selective bundle reconstruction procedures. Preservation of the ACL remnant during ACL reconstruction may contribute to knee function due to its proprioceptive and biomechanical properties and because of its vascularity, which may facilitate vascularization of grafted tendons, as has been demonstrated recently.1256791112
Adachi, et al.,27 in their clinical study, showed that joint stability and proprioceptive function in patients that underwent arthroscopic-assisted ACL augmentation were superior to those of patients that underwent conventional ACL reconstruction. Ochi, et al.5 in a series of 45 consecutive ACL augmentation cases concluded that the procedure produced improved joint stability, joint position sense, and Lysholm scores. Also, they found that only 10% of ACL surgeries were indicated for selective bundle reconstruction. Furthermore, Siebold and Fu18 reported a frequency of partial ACL tear of between 5 and 10%, and Zantop, et al.,12 in a report on ACL rupture patterns, found that 25% of ACL tears involved a partial rupture. In our series of 185 ACL surgeries (except patients with revision surgery and multiple ligament injury), including 87 patients who received single bundle ACL reconstructions because of a small femoral footprint, which was estimated to be less than 14 mm, 64 cases (34.6%) could undergo either AM or PL selective bundle reconstruction. This is much higher than the previously cited 10–25% which is indicated for selective bundle reconstruction. The possible explanation for this higher percentage of patients with selective bundle reconstruction is that we performed selective bundle ACL reconstruction in a more aggressive manner based on broader indications.
Operative treatment of partial ACL tears is technically demanding due to the difficulties associated with preserving healthy fibers and differentiating between them and a torn bundle. In the present study, a review of the anesthesia record was performed in order to compare operation times between DB ACL reconstruction, selective bundle reconstruction, and typical single bundle ACL reconstruction without remnant preservation. Cases in which the operation was performed with meniscal repair or resection were excluded due to difficulty in defining an accurate ACL reconstruction time. The operative time was defined as beginning with initial portal placement and ending when the skin incisions were closed. The average operation time for DB ACL reconstruction was 102.5±25.7 minutes (range 84–135 minutes), while selective bundle reconstruction cases averaged 95.7±18.5 minutes (range 64–125 minutes) with no statistical significance. Meanwhile, the average operation time for single bundle reconstruction without remnant preservation was significantly shorter than DB ACL and selective bundle reconstruction (p<0.001 respectively, average 78.2±15.3 minutes with a range of 54–107 minutes). During the operation, most decisions to perform selective bundle reconstruction are made based on precise preoperative clinical assessment and a surgeon's subjective feelings on probing the ACL remnants during arthroscopy.19 It is important that surgeons accurately understand the DB anatomy of the ACL and have wide experience with this procedure to avoid erroneous preservation of dysfunctional bundles. In particular, an isolated PL bundle tear can be missed because of an overlying intact AM bundle. Sonnery-Cottet and Chambat31 advocated the importance of the figure of four position to prove stretching of the PL bundle. Based on clinical outcomes in the present study, we believe that given a wide indication for a selective bundle reconstruction procedure, such as that used in the present study, selective bundle reconstruction produces postoperative results comparable to DB reconstruction. Although postoperative STS antero-posterior translation measured by stress X-ray showed a significant difference between groups A and C, a 0.5 mm difference could be considered to be clinically negligible. Our data support the report by Ochi, et al.5 who postulated that preserved loose remnant bundles can gradually become tight, resulting in good stability postoperatively. This study shows that selective bundle reconstruction is a reasonable treatment option for partial ACL injury patients with appropriate indications.
Despite our results, this study has some limitations that need to be addressed. First, this is a retrospective comparative study rather than a prospective study where the evaluator is blinded to the surgical procedure. Also, the relatively short follow-up period and heterogenous gender ratio could be a bias to affect the outcome analysis obtained in this study. Second, even though the preoperative Lachmann test and pivot shift test were performed under anesthesia, other stability evaluations including postoperative test were performed while the patients were awake. Thus, muscle guarding by the patients would be a confounding variable. Third, the graft size was not controlled resulting in heterogenous graft diameter in each case. However, in the present study, the graft diameter was determined according to the patient's footprint size based on the concept of individualized surgery. Fourth, our study compared selective bundle reconstruction in partial ACL tears to DB reconstruction in complete ACL tears, rather than DB reconstruction with sacrificing the remnant fibers in partial ACL tears. Therefore, the injury starting point in terms of rupture patten was not homogenous. Fifth, our study did not assess the biological advantages of selective bundle reconstruction with remnant preservation, compared to DB reconstruction. In particular, from a joint position sense, the potential advantages of a remnant preserving procedure could be included in the future study. A better understanding of proprioception in the context of remnant preservation is required, and could provide additional advantages for selective bundle reconstruction.

 XML Download