

 PDF
PDF ePub
ePub Citation
 Print
Print


INTRODUCTION
In the National Lung Screening trial, screening with low-dose computed tomography (CT) resulted in a 20% decrease in lung cancer-specific mortality.1 Accordingly, the National Comprehensive Cancer Network Clinical Practice Guideline in Oncology recommends lung cancer screening with low-dose CT of the lung in high-risk patients.2 However, lung cancer screening also results in the over-diagnosis of indolent lung cancers, formerly known as bronchioloalveolar carcinoma (BAC).3 Accordingly, a preoperative noninvasive diagnostic tool that can discriminate these indolent cancers from invasive cancer needs to be established to help guide the application of alternative treatments, such as limited resection, stereotactic radiation therapy, ablative therapy, or even watchful waiting, instead of standard lobectomy in cases of indolent cancer, thereby decreasing healthcare costs and the risks associated with aggressive treatment, such as increased mortality and morbidity, particularly in elderly and high-risk populations.4
In the new International Association for the Study of Lung Cancer (IASLC)/American Thoracic Society (ATS)/European Respiratory Society (ERS) classification, the term BAC is no longer used. Instead, the concept of adenocarcinoma in situ (AIS) with pure lepidic growth and minimally invasive adenocarcinoma (MIA) with predominant lepidic growth and invasion of ≤5 mm has been introduced.5 AIS and MIA are associated with an excellent prognosis (100% or near 100% disease-free survival after complete resection).567 Recently, the correlation between pathologic and radiologic features has been studied. A lepidic growth pattern was found to be correlated with a ground glass opacity (GGO) area, and the foci of fibrosis or a tumor with a solid growth pattern was found to correlate with consolidation. 89 However, measurement of GGO was not standardized. To eliminate inter-observer variability, automated volumetric measurement was studied.1011 However, the relationship between volumetric parameters and tumor invasiveness according to the IASLC/ATS/ERS classification of lung adenocarcinoma has not been clarified. Therefore, in this study, we investigated relationships between various parameters, including volumetric parameters, and tumor invasiveness according to the IASLC/ATS/ERS classification, using receiver operating characteristic (ROC) analysis.
MATERIALS AND METHODS
Patients
This retrospective study was approved by the Institutional Review Board of Severance Hospital (4-2013-0412), and the need for consent from individual patients was waived. Between January 2004 and December 2010, 356 patients with non-small cell lung cancer who underwent complete resection at Severance Hospital, Yonsei University College of Medicine were confirmed to have pathologic stage IA cancer. Among these patients, 99 patients underwent CT scans in Severance hospital and had available thin-section chest CT data, which were suitable for three-dimensional (3D) reconstruction; these patients were included in the study. Their medical records, CT images, and pathologic data were reviewed.
Chest CT and imaging analysis
All patients were scanned using a 64-slice CT machine (Sensation 64, Siemens Healthcare, Forchheim, Germany). A standard scanning protocol was applied [64×0.6 mm section collimation, 0.5 s rotation time, 120 kVp, and automatic exposure control (CARE Dose) with a quality reference value of 200 mAs, covering the thorax]. Axial images were reconstructed with a 1.25-mm slice thickness and a soft reconstruction kernel.
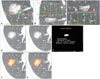
All images were evaluated on an off-line workstation (Aquarius Intuition Edition V4.4.6, Terarecon, San Francisco, CA, USA), using multiplanar axial, coronal, and sagittal images. A radiologist (SR Hong) performed 3D segmentation of the nodule using the lung window setting [window width=1465 Hounsfield unit (HU); level=−498 HU]. The threshold value for GGO was determined after plotting line histograms on multiplanar axial, coronal, and sagittal images. Using the threshold values obtained from the line histogram, segmentation was performed by including the entire nodule and adjacent parenchyma within the volume of interest and then extracting the pixel over the threshold values. Of the three threshold values, the most suitable one was selected by visual assessment upon comparing the nodule on the source image and that on the extracted image. The threshold value for the solid portion was considered either −290 HU or −190 HU11 based on the comparison of the border between the GGO and the solid portion on the source image with that on the color-coded segmentation image. After segmentation, the volume of the total nodule, the volume of the GGO portion, the volume of the solid portion, and the volume percentage of the GGO and solid portion were calculated. On the axial plane of the greatest area of the nodule, the longest diameter of the nodule and the maximum perpendicular diameter were measured using electronic calipers on the color-coded image. On the axial plane with the greatest area of solid portion, the longest diameter and maximum perpendicular diameter of the solid portion were measured (Fig. 1). The parameters evaluated in the present study were calculated as follows:
One-dimensional GGO ratio (1D GGO ratio, %)=(1−the longest diameter of solid portion/the longest diameter of the total nodule on the axial plane of the greatest area of the nodule)×100
Two-dimensional GGO ratio (2D GGO ratio, %)=(1−the longest diameter×maximal perpendicular diameter of solid portion/ longest diameter×maximal perpendicular diameter of the total nodule on the axial plane of the greatest area of the nodule)×100
Three-dimensional GGO ratio (3D GGO ratio, %)=(1−the volume of solid portion/the volume of the total nodule)×100
1D solid size (cm)=the longest diameter of solid portion on the axial plane of the greatest area
2D solid size (cm2)=(the longest diameter×maximal perpendicular diameter of solid portion on the axial plane of the greatest area of the nodule)×100
3D solid size (cm3)=the volume of the solid portion
Pathology
A single pathologist (JS Lee) reviewed the pathologic slides with reference to the new classification of lung adenocarcinomas proposed by IASLC/ATS/ERS in 2011.5 AIS and MIA were referred to as noninvasive adenocarcinoma, and others types of tumors were referred to as invasive adenocarcinoma.9 Tumor size, lymphovascular invasion, and perineural invasion were evaluated.
Statistical analysis
Continuous data are expressed as medians, and categorical data are expressed as numbers. Box plots were created using SPSS version 18.0 (SPSS Inc., Chicago, IL, USA) to display the distribution of each parameter for noninvasive and invasive adenocarcinoma. ROC curves of the parameters were used to evaluate the prediction of pathologic invasive adenocarcinoma. The Youden index was used to define the optimal cut-off points. ROC analysis was performed using MedCalc 15.10 (MedCalc Software, Ostend, Belgium), and ROC curves were compared in a pairwise manner.
RESULTS
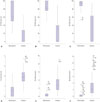
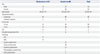
Between January 2004 and December 2010, 356 patients with non-small cell lung cancer underwent complete resection at our institute and were confirmed to have pathologic stage IA cancer. Of these, 99 had available thin-section chest CT data that were suitable for 3D reconstruction. The clinicopathological characteristics of the patients are summarized in Table 1. There were 31 patients with noninvasive adenocarcinoma and 68 patients with invasive adenocarcinoma. Most of the patients had undergone lobectomy (except three with noninvasive adenocarcinoma). The median values of the 1D, 2D, and 3D GGO ratios in patients with invasive adenocarcinoma were 0% [interquartile range (IQR), 0-28], 0% (IQR, 0-40), and 0% (IQR, 0-63), respectively. The median values of the 1D, 2D, and 3D GGO ratio in patients with noninvasive adenocarcinoma were 62% (IQR, 50-100), 82% (IQR, 76-100), and 94% (IQR, 86-99), respectively (Fig. 2A, B, and C). The median values of the 1D, 2D, and 3D solid size in patients with invasive adenocarcinoma were 1.9 cm (IQR, 1.5-2.4), 2.8 cm2 (IQR, 1.6-4.2), and 2.2 cm3 (IQR, 1.0-4.0), respectively. The median values of the 1D, 2D, and 3D solid size in patients with noninvasive adenocarcinoma were 0.5 cm (IQR, 0-0.9), 0.2 cm2 (IQR, 0-0.6), and 0.1 cm3 (IQR, 0-0.6), respectively (Fig. 2D, E, and F).
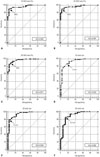
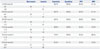
Fig. 3 shows the results of the ROC curve analysis for the performance of parameters in predicting invasive adenocarcinoma. The area under the curve (AUC) values for 1D, 2D, and 3D GGO ratios were 0.962 [95% confidential interval (CI), 0.903-0.990], 0.967 (95% CI, 0.910-0.993), 0.971 (95% CI, 0.915-0.994), respectively. The optimal cut-off values for the 1D, 2D, and 3D GGO ratios were 38%, 62%, and 74%, respectively. The AUC values for 1D, 2D, and 3D solid size were 0.933 (95% CI, 0.864-0.973), 0.944 (95% CI, 0.878-0.980), 0.903 (95% CI, 0.826-0.953), respectively. The optimal cut-off values for 1D, 2D, and 3D solid size were 1.2 cm, 1.5 cm2, and 0.7 cm3, respectively. There was significant difference in the ROC curves of the 3D GGO ratio and 3D solid size (p=0.01). The relationship between the GGO proportions and pathologic invasiveness of lung adenocarcinoma according to the cut-off values are shown in Table 2. With these cut-off values, the positive predictive value of all these parameters was more than 90%.
DISCUSSION
In the present study, we retrospectively reviewed the data of 99 patients with pathologic stage IA lung adenocarcinoma who underwent complete surgical resection. We evaluated various radiologic parameters, including volumetric parameters, based on preoperative thin-section CT imaging, to determine their ability to predict tumor invasiveness according to the new IASLC/ATS/ERS classification. The AUC for each parameter was higher than 0.9, and thus, all of the studied parameters may be useful in predicting invasive adenocarcinoma. Among the 3D volumetric parameters, 3D GGO ratio was more accurate for this prediction than 3D solid size.
Screening for lung cancer with low-dose CT has the potential to reduce mortality. However, more than 18% of all lung cancers detected by low-dose CT seem to be indolent.3 The indiscriminate application of standard lobectomy to patients with these indolent cancers could increase healthcare costs and risks associated with aggressive treatment, such as increased mortality and morbidity, particularly in high-risk patients or patients with multiple lesions.4 For these patients, alternative treatments, such as limited resection, stereotactic radiation therapy, ablative therapy, or even watchful waiting, could be an option. Pathologic examination of the whole tumor and/or regional lymph nodes may be impossible in patients who receive these alternative treatments. Thus, precise prediction of pathology using a non-invasive method is important.
While CT parameters associated with pathologic tumor invasiveness have been previously investigated;12131415 studies examining the relationship between radiologic parameters and pathologic findings based on the new IASLC/ATS/ERS classification are limited.916 Takahashi, et al.9 tested three parameters, the GGO ratio, tumor disappearance rate, and consolidation diameter. All parameters were found to have high AUCs (0.91 for the GGO ratio, 0.90 for the tumor disappearance rate, and 0.91 for the consolidation diameter), and the cut-off points for predicting tumor invasiveness according to the IASLC/ATS/ ERS classification were found to be 50%, 75%, and 10 mm, respectively.
In the present study, the AUC values for all parameters were greater than 0.9. The cut-off points for 1D GGO, 2D GGO, 3D GGO, 1D solid size, 2D solid size, and 3D solid size in predicting tumor invasiveness according to the IASLC/ATS/ERS classification were 38%, 62%, 74%, 1.2 cm, 1.5 cm2, and 0.7 cm3, respectively. Thus, GGO-related parameters might be useful, regardless of dimensionality. This is consistent with the results of the study by Takahashi, et al.9 To overcome the inter/intraobserver variability associated with manual measurements and to improve reproducibility, the automated volumetric measurement of GGO and its correlation with pathologic findings have been investigated.1011 We found that the cut-off values for 3D GGO ratio and 3D solid size could predict pathologic invasiveness according to the new IASLC/ATS/ERS classification, and that the 3D GGO ratio was significantly more accurate in predicting invasiveness than 3D solid size.
Pathologically, MIA is defined as a small adenocarcinoma with ≤5 mm invasion in its greatest dimension.6 However, the cut-off value for 1D solid size was 1.2 cm. Furthermore, 5 patients with a 1D solid size of ≥1.2 cm were pathologically diagnosed with MIA. Lampen-Sachar, et al.17 investigated the correlation between lung adenocarcinoma tumor size measured by CT and that measured by formalin-fixed specimen. Pathologic measurements were smaller than CT measurements, with a mean percent relative difference of 18% (standard deviation 28.2%). They stated that the discordance in measurements was caused by deep inspiration during CT scanning and infiltration and/or edema surrounding the tumor. In addition, the sectioning axis used for pathological measurements could be different from the CT axial direction.18 We measured 1D solid size on the axial plane of the greatest area, and this axial plane could differ from the sectioning plane used for pathological measurements.
Our study had several limitations. First, this was a single-arm, retrospective, observational study with a relatively small sample size. Second, the 1D and 2D parameters were measured with color-coded images after segmentation. Therefore, the cut-off values in the present study cannot be directly applied in clinical settings. However, this method could decrease inter/ intra-observer variability and more accurately demonstrate the differences in cut-off values according to the 1D, 2D, and 3D measuring methods.1119 Third, the prognostic value of the parameters was not investigated in this study. The cut-off values and their ability to predict survival could differ from the values suitable for the prediction of pathologic invasiveness.
In conclusion, CT-based parameters related to GGO were well correlated with and predicted invasiveness according to the IASLC/ATS/ERS classification. The cut-off value was 38% for 1D GGO, 62% for 2D GGO, 74% for 3D GGO, 1.2 cm for 1D solid size, 1.5 cm2 for 2D solid size, and 0.7 cm3 for 3D solid size. The 3D GGO ratio was more accurate in predicting pathologic invasiveness than 3D solid size.
 XML Download