

 PDF
PDF ePub
ePub Citation
 Print
Print


INTRODUCTION
Coronary computed tomographic angiography (CCTA) is considered as an appropriate non-invasive test for the detection and exclusion of coronary artery disease.1234 Thus, CCTA has an increasing role in the decision-making process evaluating the necessity of invasive conventional coronary angiography, particularly in patients with a low to intermediate risk of coronary artery disease.567 However, considering that the primary role of any diagnostic test is to inform the decision making process for the best therapeutic strategy, understanding the clinical usefulness of CCTA for further therapeutic strategies, such as the need for coronary revascularization in the symptomatic patients, is important. The circumstances under which such therapeutic decisions are made based on CCTA images are frequently encountered in daily clinical practice. However, the actual ability of CCTA to aid in the therapeutic decision-making process has only been cursorily evaluated and in relatively small populations.89
In this multicenter study, we evaluated whether CCTA can accurately predict the need for revascularization in symptomatic patients with stable angina who were referred to a cardiac catheterization laboratory as potential candidates for coronary revascularization after CCTA examination.
MATERIALS AND METHODS
Study population
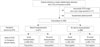
Between July 2011 and December 2013, we retrospectively identified 2633 consecutive patients from six hospitals with suspected significant coronary stenosis after CCTA examination, who were referred to the cardiac catheterization laboratory for as potential candidates for coronary revascularization. Exclusion criteria were as follows: history of any cardiac surgery, coronary artery bypass graft surgery, percutaneous coronary intervention, atrial fibrillation; refusal of percutaneous coronary intervention, or coronary artery bypass graft surgery; or clinical presentation of acute coronary syndrome including acute myocardial infarction. Of the 2633 patients, CCTA images were not accessible in 171 patients due to poor image quality. Additionally, 616 asymptomatic patients were also excluded in the final analyses. Thus, 1846 symptomatic patients with stable angina were finally enrolled for analysis in this study. All patients had ischemic symptoms and objective evidence of positive stress test. The reason for CCTA in these study population was patients' preference for non-invasive anatomical evaluation of coronary arteries with CCTA. Of the 1846 patients, 877 patients (48%) were indicated for coronary revascularization by CCTA findings of significant coronary artery stenosis (>70% luminal narrowing of at least one segment). Nine-hundred sixty nine patients (52%) were not indicated for coronary revascularization due to coronary artery stenosis less than 70% assessed by CCTA. In these 969 patients, 946 had clinically suspected significant coronary artery stenosis. Revascularization might expect little clinical benefit in the remaining 23 of 969 patients (i.e., patients had significant stenosis in small vessels) (Fig. 1). Pre-test probability of coronary artery disease was assessed according to the predictive model using the patient's age, gender, and typicality of chest pain symptoms.4 The study protocol was approved by the Institutional Review Boards at each hospital.
CCTA assessment and decision making for the need of revascularization
All patients underwent CCTA examination prior to conventional coronary angiography using different 64-channel CT scanner platforms (Somatom Sensation and Definition CT, Siemens, Forchheim, Germany; Philips Brilliance 64, Philips Medical System, Best, the Netherlands; LightSpeed VCT, GE Healthcare, Waukesha, WI, USA) with the standardized protocols for image acquisition as defined by the Society of Cardiovascular Computed Tomography at each participating center.4 Briefly, a bolus of 60 to 80 mL of iopamidol was injected into the antecubital vein at a flow rate of 5 mL/s, followed by a 50 mL saline flush at a flow rate of 5 mL/s. Sublingual nitroglycerin (0.2 mg) was administered immediately before contrast injection, and oral metoprolol was administered for any patient with a baseline heart rate of ≥70 beats/min.
Using the American Heart Association coronary tree model with 15 segments classification,10 all CCTA images of coronary artery segments with a diameter greater than 2.0 mm were visually evaluated at a core laboratory (Severance Cardiovascular Hospital, Seoul, Korea) by single experienced radiologist (BWC, 15 years), who was blinded to patient and coronary angiographic information. Any available post-processed reconstructed images including two-dimensional axial, three-dimensional maximal intensity projection, multiplanar reformat, cross-sectional analysis, or using the volume rendered technique using a three-dimensional CT workstation (Wizard, Siemens Medical Solutions, Erlangen, Germany) were utilized for the assessment of coronary artery stenosis. Segments with more than 70% luminal narrowing of the coronary artery diameter were considered as a significant stenosis for need of revascularization. CCTA was used to assess the need for coronary revascularization by two experienced interventional cardiologists (YJ and MKH) among those patients with more than 70% diameter stenosis in any segment (coronary artery diameter more than 2.5 mm by visual estimation). They were also blinded to patient and coronary angiographic information. Any disagreement regarding the need for revascularization was settled by consensus. We additionally analyzed the need of revascularization according to the references of more than 50% luminal narrowing of the coronary diameter by CCTA.
The plaque characteristics were also assessed as follows: calcified (plaques with high CT attenuation compared to contrast enhanced lumen), mixed (non-calcified and calcified elements in a single plaque), or non-calcified plaques (plaques with lower CT attenuation compared to contrast-enhanced lumen without any evidence of calcification).1112
Conventional coronary angiography and revascularization
Coronary angiogram in the cardiac catheterization laboratory was performed within 3 months after the initial CCTA examination in all patients. The decision whether actual revascularization (percutaneous coronary intervention or coronary artery bypass graft) was performed or not was made at the interventional cardiologists' discretion at each center based on all clinical information and conventional coronary angiographic findings. The actual revascularization was performed in the lesions with angiographic diameter stenosis >70% by visual estimation. To determine the ability of CCTA to predict the need of revascularization, we investigated whether patients' arteries and arterial segments, which were pre-determined to require revascularization by CCTA, actually underwent the revascularization procedure (regardless of procedural success or failure) or not.
Statistical analysis
Continuous data are presented as mean±standard deviation when they follow a normal distribution, and categorical data are presented as a number (%). Accuracy was assessed according to the sensitivity, specificity, and positive and negative predictive value on a per-patient, per-artery, and per-segment analysis. The accuracy was also measured according to the plaque characteristics. Categorical variables were compared using a chi-square test. A p-value less than 0.05 was considered significant. All statistical analyses were performed with SPSS 18.0 (SPSS Inc., Chicago, IL, USA).
RESULTS
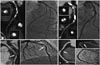
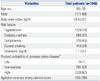
Baseline clinical characteristics are summarized in Table 1. On a per-patient analysis, 451 (51%) of the 877 patients indicated for revascularization by CCTA with more than 70% stenosis had two or more segments requiring revascularization as determined by CCTA. The actual number of patients who underwent revascularization in the cardiac catheterization laboratory was 600 (68%) of 877. The remaining 277 patients (32%) did not undergo revascularization (Table 2, Fig. 1). The reasons for the false-positive indication for revascularization in these 277 patients were as follows: calcification in 137 patients (49%), prohibitively small vessel size for revascularization in the side-branch/distal segment in 47 patients (17%), artifact in 30 patients (11%), overestimation in 44 patients (16%) and a borderline diameter of stenosis on coronary angiogram without actual revascularization in the cardiac catheterization laboratory in 19 patients (7%). Representative cases of such false-positives are shown in Fig. 2. Conversely, actual revascularization was performed in 285 (29%) of the 969 patients not indicated for revascularization due to an underestimation of stenosis because of side branch or distal segments (n=77, 27%), calcification (n=60, 21%), artifact (n=29, 10%), an underestimation (n=80, 28%), and a borderline diameter stenosis on CCTA with actual revascularization in the cardiac catheterization laboratory (n=39, 14%).
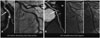
Fig. 3 shows a representative case of discordance between segmental level analysis and the patient level analysis in the therapeutic decision making process based on CCTA findings. Among the 1713 separate segments identified to be in need of revascularization by CCTA with more than 70% stenosis, 658 (38%) were proximal segments, 474 (28%) were mid segments, and 581 (34%) were side branch or distal segments; 382 (22%) were calcified plaques, 847 (49%) were mixed plaques, and 484 (28%) were non-calcified plaques (Table 3). In a per-segment analysis, the sensitivity, specificity, positive predictive value, and negative predictive value of CCTA for therapeutic decision making were 42%, 96%, 40%, and 96%, respectively (Table 4). The positive predictive value of CCTA findings for actual revascularization was lower in the side branch/distal segments (28%) compared to proximal or mid segments (46% or 47%, respectively) (p<0.001). It was also lower in the calcified plaques (33%) compared to mixed or non-calcified plaques (41% or 43%, respectively) (p<0.001) (Table 4).
DISCUSSION
The main findings of this study are 1) 32% of patients who were indicated for revascularization by CCTA did not undergo the actual procedure in the cardiac catheterization laboratory, and 29% of patients who were not indicated for revascularization by CCTA underwent actual revascularization; 2) a per-segment analysis showed that the sensitivity and positive predictive value of CCTA findings for actual revascularization were low (42% and 40%, respectively); 3) despite a higher proportion of segments observed with calcified plaques or side branch/distal segments, these segments had a much lower positive predictive value of actual therapeutic revascularization.
Because it is a non-invasive procedure, CCTA is a promising tool for coronary imaging and the evaluation of patients with suspected coronary artery disease.123 As a diagnostic test, CCTA would be more valuable if it could accurately indicate appropriate therapeutic decision. However, to date, the ability of CCTA to predict the need for revascularization has been insufficiently investigated, particularly for symptomatic patients. In the present study, we found that CCTA results are an inadequate indicator for revascularization in symptomatic patients with stable angina. Its positive predictive value is insufficient to replace conventional coronary angiography. Importantly, the present study utilized symptomatic patients who were already at a substantial risk for significant coronary artery stenosis, which required revascularization, differing from previous studies examining the diagnostic accuracy of CCTA.123 This makes our study more accurately assess the ability of CCTA to predict the requirement for revascularization procedures in an at-risk population, not those with screening of asymptomatic individuals for the presence or absence of coronary artery disease. Most patients (99%) in our study had intermediate and high pre-test probability of coronary artery disease, and the Agaston coronary artery calcium score was higher than previous studies, which could be the reasons for low accuracy compared to previous studies.123 Similar to our findings, a previous study, investigating the predictive ability of CCTA for revascularization in 60 patients, also reported that the sensitivity, specificity, positive, and negative predictive values were 97%, 48%, 75%, and 92%, respectively.8 These data suggested that CCTA is inadequate for definitive therapeutic decision-making with regard to revascularization procedures in patients with suspected significant coronary artery stenosis.8 Our present results are significantly strengthened beyond previous investigations because of large number of patients, the multicenter design, and the inclusion of symptomatic subjects with stable angina who were referred to the cardiac catheterization laboratory as potential candidates for revascularization. This patient population better reflects the sample of patients seen daily in the clinical setting.
In addition to its use as an indicator for appropriate therapeutic strategies, three previous multicenter studies demonstrated that CCTA has also various range of positive predictive value (64% to 91%) for detection of significant coronary artery disease.1213 Meta-analysis has also demonstrated a false positive rate of up to 35% for detection of significant coronary artery disease even in a low- to intermediate-risk population.14 These limitations of using CCTA as a diagnostic tool, as well as the current finding of it's being insufficient to predict the therapeutic decision, may be attributed to several factors. Previous studies demonstrated that the presence of calcium, vessel tortuosity, or a smaller luminal caliber could affect the diagnostic accuracy, and the main cause of higher false-positive values may depend on the existence of calcium in the stenotic lesions.21516 In the present study, in symptomatic patients with suspected significant coronary artery stenosis, only 28% of the 1713 segments determined to require revascularization by CCTA were non-calcified plaques, while the remaining 72% of these segments contained calcified plaques. In addition to the presence of calcification, Kruk, et al.17 found that the calcium length, volume, and thickness were also associated with the inaccuracy of CCTA. This indicates that specific calcium characteristics may impact the accuracy of CCTA. We also found that the accuracy of CCTA to predict the therapeutic decision varied according to the plaque characteristics; the calcified plaques had a lower positive predictive value.
In addition to difficulties posed by the presence of calcification, the resolution of CCTA might also be insufficient to discern the need for revascularization. The resolution of CCTA (200 µm) is inferior to that of invasive coronary imaging modalities (intravascular ultrasound, 100 µm, and optical coherence tomography, 10–15 µm).18 Precisely delineating the lumen and vessel borders in cross-sectional analysis poses difficulties when using CCTA. Therefore, inaccurate measurements of the lumen and/or plaque dimensions assessed by CCTA were more frequent due to the lower resolution. Further, several factors (i.e., motion artifacts, arrhythmia, coronary calcification, inadequate intravascular contrast and reconstruction artifact) affect CCTA images which are digitally reconstructed and, therefore, reconstructed CCTA images do not accurately examine the various conditions of the lesions (i.e., calcification, severe tortuosity, or segment size). Conversely, the images generated from conventional coronary angiogram, intravascular ultrasound, or optical coherence tomography in the cardiac catheterization laboratory are real, direct images. Owning to these differences, disagreement regarding lesion stenosis severity frequently occurs between two imaging modalities.18 We showed that this disagreement is accentuated when examining small-sized vessels (i.e., side-branch/distal segments of coronary arteries). The present study also showed that CCTA had a lower positive predictive value in the side-branch/distal segments. Furthermore, intravenous injection, not intracoronary injection, of contrast dye may result in insufficient filling and in difficulties maintaining constant dye concentration within the coronary artery lumen. In accordance with this, previous studies have reported that attaining greater contrast enhancement of the lumen independently lowers the risk of false negative diagnosis.1619 Recent imaging study on CCTA and intravascular ultrasound reported significant limitations of CCTA for delineating the lumen and vessel contour of coronary arteries; the minimal lumen area assessed by CCTA exhibited very weak correlations with those obtained by intravascular ultrasound intravascular ultrasound (r=0.23, 0.24, 0.15, 0.25, and 0.28, respectively).20 In aspects of clinical benefits, one randomized study reported the use of CCTA to screen for coronary artery disease in high-risk patients with diabetes mellitus did not reduce the composite rate of death, nonfatal myocardial infarction or unstable angina requiring hospitalization.21 Recent randomized study with 10003 symptomatic patients also showed that, compared with functional testing (n=5007), a strategy of initial CCTA (n=4996) did not improve clinical outcomes over a median follow-up of 2 years.22
This study had several limitations. First, this was a retrospective study. However, patients were enrolled consecutively in order to minimize selection bias. Second, there is no physiologic assessment by ischemic measurement such as fractional flow reserve to determine the need of revascularization, which could be important, particularly for intermediate lesions, 50–70% stenosis. However, we defined the necessities of revascularization as the more than 70% stenosis in the coronary angiography and CCTA images to avoid an underestimation of CCTA accuracy. In addition, measurement of fractional flow reserve with pressure-wire is reasonable to assess angiographic intermediate lesions (50 to 70% diameter stenosis), not in significant lesions (more than 70% diameter stenosis) in current practical guideline for percutaneous coronary intervention.23 More importantly, we excluded all asymptomatic patients. Thus, all decisions regarding the necessities of revascularizations were made for symptomatic patients with objective evidence of positive stress test.
In conclusion, CCTA without conventional coronary angiography may be insufficient to assess coronary artery stenosis in symptomatic patients with stable angina. Conventional coronary angiography is needed to decide the need of revascularization in this patient population.


 XML Download