

 PDF
PDF ePub
ePub Citation
 Print
Print


INTRODUCTION
Although the gold standard method for the diagnosis of urinary tract infections (UTI) is urine culture, 99mTc dimercaptosuccinic acid (DMSA) renal scanning is the best tool for discriminating acute pyelonephritis (APN) or the presence of a renal cortical defect on a DMSA scan (true APN) from its absence in infants with febrile UTI.1 Nevertheless, obtaining urine culture results can be time consuming, typically requiring at least 48 h. Furthermore, some parents of children with febrile UTI do not provide consent for their child to undergo urethral catheterization or suprapubic aspiration for urine collection in the emergency room or outpatient department, although it is strongly recommended by the American Academy of Pediatrics.2 Therefore, pediatricians require simpler or less burdensome tools that may help promptly discriminate APN from other febrile illnesses in children with abnormal urinalysis findings mimicking APN.
In the present study, we investigated whether C-reactive protein (CRP) levels, urine protein-creatinine ratio (uProt/Cr), and urine electrolyte values can be useful tools for discriminating APN from other febrile illnesses or true APN from the absence of a renal cortical defect on DMSA scans in infants with febrile UTI.
MATERIALS AND METHODS
Among 208 infants who were consecutively admitted to our hospital with their first febrile UTI from January 2010 to December 2012, 150 infants with completed data sheets were included in this study. Fifty-eight infants who were missing data for the required parameters or the results of urine electrolytes sampled 24 h after hydration were excluded. Febrile UTI was defined as follows: high fever ≥38℃, pyuria (>5 white blood cells/high-power field) and positive leukocyte esterase results on urinalysis, significant bacteriuria, positive CRP results (>0.3 mg/dL), and the lack of any other fever focus. Bacteriuria was defined as the presence of >1×10⁵ colony-forming units/high-power field for a single-strain isolate. The clean catch bag method was used to collect urine samples. The infants' prenatal sonograms revealed no remarkable findings. The mean duration of admission was 4.3 days. All enrolled infants with UTI underwent renal ultrasonography (US) and a DMSA renal scan upon admission. In addition, blood [CRP, electrolytes, Cr, and serum osmolarity (Osm)] and urine tests (uProt/Cr, electrolytes, urine Cr, and urine Osm) were performed. Urine samples obtained for electrolyte analysis that were collected 24 h after hydration were excluded from this study, because renal compensation for plasma volume could alter the urine electrolyte values. CRP levels were measured by turbidimetry. Urine proteins were analyzed using pyrogallol red dye (7600 DP; Hitachi Ltd., Tokyo, Japan). DMSA scanning was performed using the planar technique, and the findings were interpreted by both a nuclear medicine consultant and a pediatric nephrologist. True APN was defined as the presence of a cortical defect on a DMSA scan that showed reduced or the absence of localization of the tracer and indistinct margins that did not deform the renal contour. Voiding cystourethrography (VCUG) was performed only when DMSA scanning revealed cortical defects at the first febrile UTI episode. Written informed consent was obtained from the parents of all infants with UTI prior to performing DMSA scanning and VCUG. However, the parents of 39 patients with true APN did not provide consent for performing VCUG. The doctors in charge read the informed consent form in front of their parents at admission, and the parents signed the consent form together with the doctors in charge and responsible researchers. The CHA University Institutional Review Board approved this study, including the consent procedure (CHA IRB No. BD2014-125).
The controls comprised 100 infants with completed data sheets, among 192 infants who were admitted with other febrile illnesses to our hospital during the same period. Ninety-two infants with missing data for the required parameters or the results of urine electrolytes sampled 24 h after hydration were excluded. The controls included 8, 4, 2, 16, 5, 4, 7, 5, 10, 27, 8, and 3 patients with acute bronchiolitis, bronchitis, croup, pharyngitis, acute suppurative otitis media, tonsillitis, herpangina, exanthem subitum, an unspecified fever, acute gastroenterocolitis, unspecified sepsis, and pneumonia, respectively.
All blood and urine data were collected prospectively. All data were compared between infants with febrile UTI and the controls, between infants with UTI with and without a cortical defect on DMSA scanning, and between patients with high CRP-UTI and low CRP-UTI (CRP <3 mg/dL).
Statistical analysis
All variables are presented as the median±interquartile range, and continuous variables were analyzed using the Mann-Whitney U test (2-tailed probability), as well as Student's t-test. Qualitative variables and correlations were analyzed using the Pearson chi-squared test and Pearson correlation coefficient (two-tailed probability), respectively. To investigate the ability of parameters to predict true APN in infants with a UTI, multiple logistic regression analysis (MLRA) and predictive values [sensitivity (Ss), specificity (Sp), positive predictive value (PPV), and negative predictive value (NPV)] were used. The cutoff values of relevant factors were calculated from the receiver operating characteristic (ROC) curve. Statistical analysis was performed using SPSS statistics 20 (SPSS Inc., Chicago, IL, USA). Statistical significance was defined as p≤0.05.
RESULTS
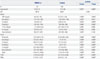
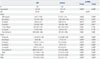
The demographic characteristics of patients with UTI and the controls are shown in Table 1. Among 150 infants with UTI, US revealed normal findings, hydroureter, hydronephrosis, increased parenchymal echogenicity, swelling, bladder wall thickening, and a duplex kidney in 60, 23 (22, <7 mm), 49 [all, grade 1-2 (classification of the Society for Fetal Urology)3], 26, 8, 10, and 2 patients, respectively. Abnormal US findings exhibited a Ss of 65%, Sp of 45%, PPV of 40%, and NPV of 70% for predicting true APN. VCUG was performed in 15 patients [10 kidney units, grade 1-3; 5 kidney units, grade 4-5 (classification of the International Reflux Study Committee)4].
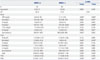
Infants with true APN had higher CRP, uProt/Cr, urine potassium (uK), and uCr values than the controls (p=0.000, 0.000, 0.001, and 0.001, respectively), whereas infants with true APN had lower urine sodium (uNa), urine chloride (uCl), and uNa-potassium ratio (uNa/K) values than the controls (p=0.000, 0.000, and 0.000, respectively) (Table 1). Concomitantly, infants with true APN had statistically lower serum Na (sNa) and Cl and higher serum K (sK) values than controls, although only a small difference was noted (p=0.002, 0.000, and 0.042, respectively) (Table 1). The comparison between patients with UTI and controls was similar to that between infants with true APN and controls (Table 2). We compared the patients with true APN to the controls because the urine culture samples collected with a urine bag had potentially high false positivity.
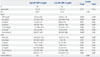
Infants with UTI and true APN had higher CRP levels than infants with UTI with no cortical defect on DMSA scanning, whereas they had lower uNa and uNa/K values (p=0.000, 0.043, and 0.000, respectively) (Table 3). Statistically, infants with UTI and true APN had lower serum Cl levels than those with no cortical defect on DMSA scanning, although only a small difference was noted (p=0.000) (Table 3). True APN was most strongly positively correlated with CRP levels, whereas it was negatively correlated with uNa/K and uNa values (CRP: r=0.62067, p=0.000; uNa/K: r=-0.16945, p=0.038; uNa: r=-0.16996, p=0.037).
By using MLRA including CRP, urine electrolyte, uNa/K, urine Osm, uProt/Cr, uCr, serum electrolyte, serum Osm, sCr, and serum T-CO2 values, we noted that CRP and uNa/K were relevant factors for predicting true APN in infants with UTI (p=0.000 and 0.003, respectively).
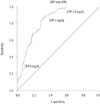
High CRP levels in UTI were associated with higher uProt/Cr values than low CRP levels in UTI (p=0.002) (Table 4). The cutoff value of CRP ≥3 mg/dL was determined using the ROC curve between CRP and true APN [area under the ROC curve (AUC)=0.836; 95% confidence interval (CI)=0.77-0.90; p=0.000] (Fig. 1). CRP ≥3 mg/dL had a Ss of 93%, Sp of 59%, PPV of 56%, and NPV of 93% for predicting true APN (CRP ≥8 mg/dL: Ss=41%, Sp=92%, PPV=73%, and NPV=73%; CRP ≥1 mg/dL: Ss=100%, Sp=27%, PPV=44%, and NPV=100%) (Fig. 1).
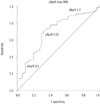
The AUC between uNa/K and true APN was 0.698 (95% CI=0.607-0.788; p=0.000) when the value of the state variable was 0 (Fig. 2). uNa/K ≤0.55 had a Ss of 61%, Sp of 74%, PPV of 57%, and NPV of 77% for predicting true APN (uNa/K ≤0.3: Ss=26%, Sp=90%, PPV=59%, and NPV=69%; uNa/K ≤1.2: Ss=83%, Sp=33%, PPV=41%, and NPV=78%) (Fig. 2).
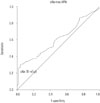
The shape of the ROC curve between uNa and true APN was not significant; however, the AUC was 0.602 (95% CI=0.51-0.695; p=0.044) when the value of the state variable was 0 (Fig. 3). uNa ≤30 mg/dL had a Ss of 91%, Sp of 31%, PPV of 42%, and NPV of 88% for predicting true APN.
uProt/Cr was higher in infants with true APN than in controls (p=0.000) (Table 1). uProt/Cr ≥0.4 had a Ss of 96%, Sp of 31%, PPV of 41%, and NPV of 94% for predicting true APN. However, uProt/Cr was not a significantly relevant factor for predicting true APN by MLRA as well as by ROC curve analysis.
DISCUSSION
The development of an alternative diagnostic method for diagnosing true APN would obviate the need for urethral catheterization, which is required for diagnosing APN via urine culture in infants with UTI. A positive urine culture indicates the presence of significant bacteriuria; however, it does not confirm the diagnosis of true APN as accurately as DMSA scanning.5 Printza, et al.6 reported that acute-phase DMSA scanning revealed renal changes in 16 (16.3%) of 98 infants experiencing their first febrile UTI, which was confirmed by urine culture with suprapubic paracentesis or catheterization. Most infants with APN or other febrile illnesses only present with a fever. Furthermore, among infants, 0.5% of males and 1.8% of females have asymptomatic bacteriruia.7 Although true APN is an important disease that should not be overlooked, because it can result in acquired renal scarring, particularly in infants, some infants with febrile illnesses mimicking APN are unnecessarily treated for true APN until their urine culture results are finally obtained. Furthermore, acute pyelitis cannot be diagnosed solely via a urine culture, and DMSA scanning is also required. Thus, instead of urine culture, a method involving factors predictive of true APN should be developed and utilized when considering admission for UTI treatment or recommending an imaging study of the urinary tract in febrile infants with a UTI.
Urinalysis alone exhibits a high Ss and NPV for diagnosing UTI.8 However, abnormal urinalysis findings do not indicate APN. Aseptic pyuria, urethritis, vaginitis, and lower UTI are also associated with other febrile illnesses. Cases in which only a fever is noted at presentation, particularly in infants, are difficult to differentiate from APN until urine culture results are obtained or a DMSA scan is performed. In such cases, CRP levels can be useful for differentiating lower and upper UTI. The present study suggests that CRP levels are the strongest predictor of true APN. Moreover, CRP testing is 7-fold less expensive than procalcitonin testing in our hospital, and therefore, CRP testing is primarily used. However, some reports have indicated that CRP levels have low Sp for detecting true APN.910 Ansari Gilani, et al.11 reported in their study that CRP levels were not predictive of true APN in patients experiencing their first episode of a UTI using MLRA, although CRP was found to be significant by univariate analysis (CRP cutoff value, ≥3 mg/dL). They reported that a therapeutic delay time ≥48 h, therapeutic response time ≥24 h, axillary temperature ≥39℃, leukocyte count ≥13500/mm3, and age ≥18 months were predictors of true APN.
Our focus on urine electrolytes as variables for differentiating true APN from the absence of a cortical defect on DMSA scans in patients with febrile UTI arose from the following hypothesis: if inflammation occurs in the renal cortex, which features a profuse microvascular structure, changes of renal plasma flow in the affected area, especially the perfusion of the juxtaglomerular apparatus, diameters of microvessels, or release of catecholamines, could affect activation of the renin-angiotensin-aldosterone system (RAAS). RAAS activation can result in the strong tubular reabsorption of uNa and secretion of uK.12 If our hypothesis is correct, uNa levels would be lower and uK levels would be higher in true APN than the values observed in the absence of a cortical defect on DMSA scans. Furthermore, as uNa/K has been found to be a useful index of the renal response to aldosterone,13 we believed that uNa/K would be a more accurate parameter for detecting changes in RAAS activity than uNa or uK alone. To our knowledge, this is the first study to consider uNa/K as a predictive factor of true APN, and thus, articles supporting our hypothesis in the literature are scarce.
When venipuncture is not permitted or only urinary screening is performed in the outpatient department or emergency room for differentiating APN from acute febrile illnesses, uProt/Cr and uNa/K values are useful in addition to urinalysis. Only 3.7% of infants with UTI and true APN had uProt/Cr values <0.4, whereas 84% of controls had uProt/Cr values <0.4 in the present study. According to reports, 63-83% of patients with culture-confirmed UTIs exhibit positive results for protein tests.8141516 Several studies have attempted to distinguish between upper and lower UTIs in children on the basis of tubular proteinuia.171819 However, patients with lower UTIs also exhibit proteinuria.520 The present study also suggests that uProt/Cr is not a relevant factor for predicting true APN in infants with UTI. An increased uProt/Cr in infants with UTI may be related to the presence of significant bacteriuria. Among urinary parameters, only uNa/K was a significantly relevant factor for predicting true APN in the present study. The uNa level alone was not a relevant factor for predicting true APN, although it showed high Ss and NPV for predicting true APN.
When DMSA scanning was performed in infants with febrile UTI, the following method demonstrated a Ss of 84%, Sp of 70%, PPV of 59%, and NPV of 89% for predicting true APN when applied sequentially: 1) exclude infants with uProt/Cr values <0.4; 2) exclude infants with uNa values >30 mg/dL; and 3) exclude infants with uNa/K values ≥1.2 at presentation. These scores are comparable to those of CRP ≥3 mg/dL alone and superior to those of uNa/K alone. Moreover, this method had a Ss of 94%, Sp of 65%, PPV of 60%, and NPV of 95% for predicting true APN when we applied the following: 1) include infants with CRP ≥8 mg/dL; 2) exclude infants with CRP ≤1.0 mg/dL; 3) exclude infants with uProt/Cr <0.4; 4) exclude infants with uNa >30 mg/dL; and 5) exclude infants with uNa/K ≥1.2 at presentation. The Ss and NPV of this method were superior to those of other combinations of these parameters. This second method could be helpful for the following reasons: 1) diagnosis of APN therewith is faster than use of urine culture. 2) Together with urinalysis, it could play a supportive role in differentiating APN from other acute febrile illnesses or suspicious febrile UTI being treated with antibiotics prior to urine sampling. 3) Culture-negative pyelonephritis can be treated appropriately. Tsao, et al.21 reported that among children with UTI with a cortical defect on DMSA scanning, 31% had negative results on urine culture sampled by suprapubic aspiration.5 4) These urinary parameters can be assessed without urethral catheterization or suprapubic aspiration. 5) Use of the method could shorten the admission period in UTI infants with a low risk of renal cortical defect. 6) Finally, its use could reduce the number of patients receiving imaging studies in infants with UTI. A disadvantage of this guideline is that if urine sampling is performed >24 h after hydration and intravenous antibiotic treatment is initiated, then the uProt/Cr and urine electrolyte values tend to return to their normal levels.
The exact pathogenesis of the change in urinary electrolytes in APN (relatively lower uNa and higher uK values than those in controls) is not known. We believe that RAAS activation may be stronger in patients with APN than in controls. Moreover, a certain factor that either activates the systemic or local RAAS, other than volume depletion, or induces powerful tubular reabsorption of Na may contribute to the pathogenesis of APN. However, when considering the concomitant changes of serum electrolyte levels in patients with APN (relatively lower sNa and higher sK values than those in the controls) in the present study, APN appears to exhibit a tendency to progress toward pseudohypoaldosteronism-like features in the blood. Gil-Ruiz, et al.22 reported that a pseudohypoaldosteronism-like phenomenon occurs in APN. However, the results of the present study are diametrically opposed to those reported in their study. Herein, we revealed that uNa levels and fractional Na excretion were lower in infants with APN than in the controls (p=0.000 and 0.000, respectively). Furthermore, uK levels and the transtubular K gradient in infants with APN were higher than those in the controls, although the infants with APN were younger than the controls (p=0.001 and 0.001, respectively). These changes may have resulted from a normal response to aldosterone. As well, their report22 had the following limitations: 1) the selection process of the controls was not clear, and therefore, they might have included patients with abnormal urinalysis findings or culture-negative pyelonephritis; 2) the patients with UTI enrolled in their study did not represent patients with true APN, because none of the patients underwent a DMSA scan. We believe that relatively higher sK values in APN may be caused by a decreased distal nephron flow rate resulting from powerful proximal tubular Na reabsorption rather than by renal tubular unresponsiveness to aldosterone, as the distal nephron flow rate is a primary determinant of renal K excretion.23 For instance, reduced renal perfusion pressure may increase fractional Na reabsorption at the proximal tubule.24 Additionally, an increased blood K level may result in an increase in aldosterone secretion to a greater extent.
The finding that US has low Ss and PPV for predicting true APN was determined in our previous study.25 However, US in patients with UTI is an important method for identifying several urinary tract anomalies, such as hydronephrosis or complications of APN.
The present study has the following limitations: urine culture was collected using a sterile urine bag. This method does not provide any information about renal scarring in APN infants. Also, the effect of urinary tract anomalies on the changes of urine electrolyte levels could not be evaluated, because VCUG was not performed in all infants with UTI.
In conclusion, we suggest that serum CRP, uProt/Cr, and uNa/K are useful for discriminating APN from other febrile illnesses or differentiating true APN from the absence of a cortical defect on DMSA scans in infants with febrile UTI.
 XML Download