

 PDF
PDF ePub
ePub Citation
 Print
Print


INTRODUCTION
High levels of dietary fat are metabolically harmful to one's health. Several cardiometabolic disorders, such as obesity, hyperlipidemia, diabetes mellitus, and cardiovascular disease, have been shown to be associated with high fat diets (HFDs).1 Recently, epidemiologic studies have shown that a HFD is also associated with lower bone mineral density (BMD) and higher risk of osteoporotic fractures.2,3 Animal studies have demonstrated that HFDs also exert adverse effects on bone metabolism.4,5,6,7 Although the mechanisms for these effects are unclear, metabolic derangements, such as dyslipidemia or oxidative stress, resulting from excess fat intake, may mediate the harmful effects of dietary fat on bone.8,9,10,11,12
The majority of dietary fat consists of triacylglycerol (TAG), a glyceride composed of three fatty acid chains covalently bonded to a glycerol molecule through ester linkages. Diacylglycerol (DAG) is a glyceride that comprises two fatty acid chains esterified to a glycerol molecule. DAG oil is similar in taste, appearance, and fatty acid composition to conventional edible oils that predominantly consist of TAG. In fact, various edible oils contain small quantities of DAG, ranging from 0.8% in rapeseed oil to 9.5% in cottonseed oil.13 DAG exists in two isoforms, 1,2 (or 2,3)-DAG and 1,3-DAG. Typically, DAG in edible oils exists as the 1,3-isoform DAG due to migration of the acyl group in an equilibrium reaction. This 1,3-DAG is believed to offer metabolically beneficial effects, compared to TAG, due to differences in absorption and metabolism.14,15 As demonstrated in both animal and human studies, DAG appears to be more effective than TAG in preventing hyperlipidemia and excess body fat accumulation.16,17,18,19,20,21,22,23,24,25 Regarding the safety of DAG, most studies that have investigated the dietary toxicity of DAG report no severe adverse effects related to its consumption.14
While previous animal studies have demonstrated the effects of HFDs on bone and bone metabolism,4,5,6,7 no studies have investigated the effects of a HFD containing DAG (HFD-DAG) on bone. We hypothesized that a HFD-DAG may affect bone and its metabolism differently than a HFD containing TAG (HFD-TAG), owing to the beneficial effects of DAG on fat mass, lipid metabolism, and/or oxidative stress. To test this hypothesis, we measured body composition, bone microstructure, and biochemical parameters in mice fed three different diets, including a chow diet, a HFD-TAG, and a HFD-DAG, for 20 weeks. Gene expression for osteogenic or adipogenic differentiation of bone marrow cells was also investigated.
MATERIALS AND METHODS
Animals
Four-week-old male C57BL/6J mice were purchased from Central Laboratory Animal Inc. (Seoul, Korea). During the study, the mice were housed in standard cages placed in a room at 21±2℃ and 50±5% relative humidity, with a 12-hour light-dark cycle. The animals used in this study were treated in accordance with the Guide for the Care and Use of Laboratory Animals (Institute of Laboratory Animal Resources, Commission on Life Sciences, National Research Council, 1996), as approved by the Institutional Animal Care and Use Committee of Yonsei University.
Experimental protocol
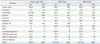
Mice were fed a standard laboratory diet for one week in order to acclimatize them. They were then divided into three weight-matched groups (n=13 per group) of three different diet types: the chow diet group, the HFD-TAG group, and the HFD-DAG group. The chow diet consisted of a purified diet based on the AIN-93G rodent diet, which contains 7 gm% (16 kcal%) of fat;26 the chow diet in the present study comprised 4.0 kcal per gm of fat. Both the HFD-TAG and HFD-DAG contained 24 gm% (45 kcal%) of fat. Although the amount of fat in the HFD-DAG was identical to that in the HFD-TAG, the fat content was different. Seventy grams of soybean oil and 130 g of lard were used for the HFD-TAG, while 150 g of DAG oil and 50 g of lard were used for the same total amount of fat in the HFD-DAG. Both diets comprised 4.8 kcal per gm of fat. Detailed ingredients of each diet are listed in Table 1. All mice were allowed free access to food and water throughout the 20-week test period. The mice were weighed every week from the beginning of the study. Every four weeks, mice were anesthetized using a mixture of Zoletil and Rompun, and body composition was measured. At the end of the experimental period, mice were sacrificed following 12-h fasts. Blood was drawn by cardiac puncture from mice into EDTA-coated tubes. Plasma was obtained by centrifuging the blood at 2000× g for 15 min at 4℃. The plasma was then frozen and stored at -20℃ until ready for analysis. Femora and tibiae from the hind legs were dissected and bone marrow cells were immediately isolated from the tibiae. The Yonsei University Institutional Animal Care and Use Committee approved all animal experiment protocols.
Body composition and bone microstructure
Body composition (lean mass, fat mass, bone mineral content, and BMD) of the mice was measured using dual X-ray absorptiometry (DXA) (QDR-4500A, Hologic, Waltham, MA, USA). The instrument was calibrated before scanning sessions using a phantom with known BMD, according to the manufacturer's guidelines. Body composition excluding the skull was assessed every four weeks from the fourth week of experimental period. All scans were performed with the animals positioned prone and spread, with tape attached to each limb on the platform. The lean or fat mass percentage was calculated as lean or fat mass divided by total body weight. At the end of the study, the microarchitectures of the femora and the fifth lumbar vertebrae from sacrificed mice were analyzed using micro-computed tomography (micro-CT) scanning (SMX-90CT, Shimadzu, Kyoto, Japan). The cortical bone and trabecular bone were separated manually on each slice by a cursor line. The three-dimensional structure was analyzed using the TRI 3D-BON (RACTOC System Engineering Co., Tokyo, Japan) program. In this study, the morphometric parameters calculated for both skeletal sites included bone volume fraction (BV/TV, %), trabecular thickness (µm), trabecular number (1/mm), and trabecular separation (µm). Femoral images were also evaluated for cortical thickness (µm) and cortical cross-sectional area (mm2).
Total RNA isolation, RT-PCR, and quantitative real-time RT-PCR
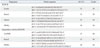
The total RNA of tibial bone marrow cells (n=5 for each group) was extracted using Trizol reagent (Invitrogen, Carlsbad, CA, USA), and then reverse transcribed into cDNA using M-MuLV reverse transcriptase (Promega, Madison, WI, USA) according to the manufacturer's recommendations. For reverse transcription-polymerase chain reaction (RT-PCR) analysis, one microliter of the RT product was used as a template for PCR amplification of Runx2, osterix, PPARγ, and β-actin using the following cycles: Runx2, 94℃ for 40 s, 55℃ for 40 s, and 72℃ for 1 min over 28 cycles; osterix, 94℃ for 40 s, 55℃ for 40 s, and 72℃ for 1 min over 30 cycles; PPARγ, 94℃ for 40 s, 58℃ for 40 s, and 72℃ for 1 min over 30 cycles; β-actin, 94℃ for 40 s, 55℃ for 40 s, and 72℃ for 1 min over 20 cycles. The measured mRNA levels were normalized to the β-actin mRNA levels. Sequence information on the oligonucleotide primers used for RT-PCR is presented in Table 2. PCR products were separated by electrophoresis on a 1.5% agarose gel and visualized by ethidium bromide staining. Real-time RT-PCR quantitation of Runx2 and PPARγ mRNA was performed in an iCycler IQ detection system (Bio-Rad, Hercules, CA, USA) using SYBR Green I (Molecular Probes, Eugene, OR, USA) as a double-strand DNA-specific binding dye. The sequence information of oligonucleotide primers for quantitative real time RT-PCR is also presented in Table 2.
Biochemical analyses
Plasma concentrations of glucose, total cholesterol, triglyceride, and high density lipoprotein (HDL)-cholesterol were measured using an ADVIA 1650 Chemistry system (Siemens, Tarrytown, NY, USA). Plasma insulin levels were measured with an enzyme-linked immunosorbent assay kit (Mercodia, Uppsala, Sweden), and the inter-assay and intra-assay variations were 4.8±1.3% and 2.6±0.6%, respectively. The homeostatic model assessment of insulin resistance (HOMA-IR) was calculated from fasting plasma glucose and insulin concentrations.
Statistical analyses
Statistical analyses were performed using SPSS 15 (SPSS Inc., Chicago, IL, USA). Data are reported as mean±standard error. Comparisons across groups were performed by one-way analysis of variance (ANOVA) with a post hoc Duncan's test. A repeated measures ANOVA was performed to test for significant differences in the means of body weight, fat mass, lean mass, and BMD over time between groups. Multiple comparisons after repeated measures ANOVA were carried out using Bonferroni's method. A doubly multivariate analysis of variance with a post hoc Turkey's honestly significant difference test was also performed to compare the mean differences among groups for univariate analysis of BMD after adjusting for body weight. All p-values<0.05 were considered statistically significant.
RESULTS
Body weight and composition
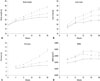
Body weight, lean mass, and fat mass measured at each time point for the three diet groups are shown in Fig. 1A, B, and C. The body weights, lean masses, and fat masses of mice fed a HFD were greater than those of mice fed the chow diet at each time point. Among mice that were fed a HFD, the HFD-TAG group showed greater body weight (p<0.001), lean mass (p=0.008), and fat mass (p<0.001) than the HFD-DAG group. The difference between the groups increased from the beginning of the experimental period. The fat mass percentage of the HFD-TAG group was also greater than that of the HFD-DAG group (p<0.001). However, the lean mass percentage was higher in the HFD-DAG group than in the HFD-TAG group (p<0.001).
BMD and bone microstructure
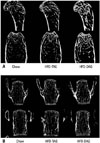
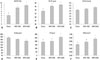
BMD measured by DXA at each time point is presented in Fig. 1D. BMD was higher in mice fed a HFD containing either TAG or DAG than in those fed the chow diet, which is probably due to the greater body weight of mice fed the HFD. Among mice fed a HFD, however, those fed the HFD-DAG had greater BMD than those fed the HFD-TAG, despite having lower body weight (p=0.016). After statistical adjustment for body weight, mice fed the HFD-DAG had greater BMD at 20 weeks than those fed the chow diet (p<0.001) or HFD-TAG (p=0.017). However, there was no statistical difference in BMD at 20 weeks between the chow diet group and the HFD-TAG group after adjusting for body weight (p=0.128). Micro-CT was conducted after sacrificing the animals to analyze the microstructures of cortical and trabecular bone. The femur of the posterior limb and the fifth lumbar vertebra were used for micro-CT analysis. Compared to mice fed the HFD-TAG, mice fed the HFD-DAG showed increased cortical thickness and cross-sectional area in their femoral bones (Figs. 2A and 3) and increased trabecular thickness in their vertebrae (Figs. 2B and 4), despite having lower body weight.
Differentiation of bone marrow cells
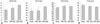
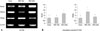
Bone marrow cells were isolated from mice tibiae (n=5) to determine the effect of diet on cell differentiation. The gene expression levels of transcription factors for osteogenic and adipogenic lineage in bone marrow cells are presented in Fig. 5. RT-PCR (Fig. 5A) and quantitative real time RT-PCR (Fig. 5B) reveal significant up-regulation of Runx2 and osterix, transcription factors for osteoblastic differentiation, in mice fed the HFD-DAG, compared with those fed the HFD-TAG. In contrast, the adipocyte-specific transcription factor PPARγ was up-regulated in mice fed the HFD-TAG.
Metabolic parameters
Biochemical parameters, including fasting plasma glucose, insulin, and lipid profiles, are presented in Table 3. Mice fed a HFD containing either TAG or DAG had higher fasting glucose, HOMA-IR, total cholesterol, and triglyceride than mice fed the chow diet. Among mice fed a HFD, however, metabolic derangement was more severe in the mice fed the HFD-TAG than in those fed the HFD-DAG.
DISCUSSION
The present study revealed that mice fed a HFD-DAG have greater BMD and superior bone microstructure, compared to those fed a HFD-TAG. The HFD-DAG group also showed increased expression of Runx2 and decreased expression of PPARγ in bone marrow cells, compared to the HFD-TAG group. These findings suggest that the beneficial effects of DAG on bone might result from increased differentiation of bone marrow cells into an osteogenic rather than adipogenic lineage. This study also showed that mice fed a HFD-DAG gained less body weight and fat mass than mice fed a HFD-TAG. Furthermore, biochemical tests in this study revealed lower levels of plasma glucose, insulin, total cholesterol, and triglyceride in the HFD-DAG group than the HFD-TAG group, findings which are consistent with previous studies on the metabolic effects of DAG.16,17,18,19,20,21,22,23,24,25 Based on the results of our study, we speculate that the beneficial effects of DAG on bone are partly due to less glucotoxicity and lipotoxicity. Another interesting finding in our study was that mice fed an HFD-DAG also had greater BMD, superior bone microstructure, and increased expression of Runx2 in bone marrow cells, compared to those fed a chow diet, although the HFD-DAG group had higher levels of plasma glucose, insulin, total cholesterol, and triglyceride. This finding suggests that metabolic derangements associated with a HFD-DAG are not severe enough to exert a negative effect on bone metabolism in mice. On the contrary, greater body weight of mice fed a HFD-DAG might have positively affected their bone.
Dietary fat intake can affect bone metabolism in several ways. Excess body fat accumulation resulting from a HFD has both positive and negative effects on bone. The mechanical loading of accumulated fat mass can stimulate osteogenesis and estrogen produced in adipose tissue and inhibit bone resorption by osteoclasts.27 In contrast, adipocytes may exert lipotoxic effects on osteoblasts, as shown in an experiment where adipocytes induced the inhibition of osteoblast proliferation in in vitro cocultures.28 Adipocytokines secreted by adipose tissue can also affect bone metabolism in both positive and negative ways. For example, leptin inhibits bone formation through a central mechanism that involves the sympathetic nervous system.29,30 However, peripheral administration of leptin increases cortical bone growth and differentiation of mesenchymal stem cells into osteoblasts rather than adipocytes,31,32 and reduces ovariectomy-induced bone loss in rats.33 Adiponectin also seems to have both positive and negative impacts on bone metabolism.34 The overall effect of adipocytokines on bone remains unclear.
Recently, oxidative stress was suggested as an important mediator of HFD-induced bone loss.7 Studies showed that excess fat intake increases oxidative stress by overproducing reactive oxygen species and decreasing antioxidant enzyme activity.35,36 Oxidative stress may be a cause of the development of osteoporosis. In previous clinical studies, oxidative stress exhibited an inverse association with bone mass in humans.11,12,37,38 In vitro and animal studies have also shown that oxidative stress can inhibit the differentiation of osteoblasts39,40 while stimulating the formation and activation of osteoclasts.41,42 Parhami, et al.10,43,44,45 also suggested that oxidized lipids play a role in bone metabolism. They suggested that lipoproteins and lipids accumulate in bone and undergo oxidation, after which these oxidized lipids can inhibit the differentiation of preosteoblastic cells and marrow stromal cells, as well as induce RANKL-dependent osteoclastic differentiation of marrow preosteoclasts. They speculated that the effects of oxidized lipids on bone cells may be mediated through direct interactions via receptor-mediated responses and/or through the generation of other inflammatory cytokines, such as MCP-1, M-CSF, and IL-6.
Although DAG is almost identical to TAG in terms of digestibility and caloric value, this study and previous studies have found that DAG may be metabolically beneficial in terms of preventing hyperlipidemia and excess body fat accumulation.16,17,18,19,20,21,22,23,24,25 While not fully understood, the underlying mechanism for this physiological difference between TAG and DAG is likely due to differences in absorption and metabolism.14,15 It appears that the position of the fatty acid on the glycerol skeleton is responsible for the metabolic differences in DAG and TAG.14,15 After TAG is ingested in the form of dietary oil, it is hydrolyzed by lipase to produce free fatty acids and 2-monoacylglycerol in the small intestinal lumen, and these molecules are absorbed into intestinal cells. In intestinal cells, they are reconstituted to form TAG via the 2-monoacylglycerol pathway through the action of monoacylglycerol acyltransferase (MGAT) and diacylglycerol acyltransferase (DGAT). TAG is then incorporated into chylomicrons, which are released into the intestinal lymph and poured into the bloodstream. The absorption pathway of 1,3-DAG in intestinal cells is different from that of TAG. In the small intestine, dietary DAG oil, mainly in the form of 1,3-DAG, is hydrolyzed to 1-monoacylglycerol and then to glycerol and free fatty acids. These free fatty acids may be less readily resynthesized to TAG via the 2-monoacylglycerol pathway in intestinal cells, because 1-monoacylglycerol cannot be a substrate for both MGAT and DGAT. Instead, TAG is synthesized by the glycerol-3-phosphate pathway, which is less active than the 2-monoacylglycerol pathway. Moreover, compared with TAG, larger amounts of fatty acids may be released from digested DAG into portal circulation rather than being incorporated into chylomicrons, and this hepatic exposure to fatty acids leads to greater β-oxidation by the liver. This metabolically positive effect of DAG likely results in less lipotoxicity and/or oxidative stress in the body, which is probably beneficial for skeletal health.
This study has some limitations. First, bone histomorphometry was not conducted. Although bone formation and resorption markers were measured in the plasma, how a HFD-DAG affects bone remodeling differently than a HFD-TAG or chow diet is unclear. Dynamic histomorphometry study might have provided a more definitive explanation. Second, plasma concentrations of adipocytokines, such as leptin and adiponectin, were not measured, and these adipocytokines might play a role in mediating metabolism of a HFD and bone. In addition, mice used in the present study were 4 weeks of age, corresponding to pre-pubertal stage of development. Therefore, we must be careful about extrapolating the current findings to humans.
In conclusion, we demonstrated that DAG exerts positive effects on bone metabolism in mice. Accordingly, consuming a diet rich in DAG instead of TAG may be beneficial to preventing bone loss and managing osteoporosis. Further research is needed to elucidate the mechanisms behind the beneficial effects of DAG on bone.

 XML Download