

 PDF
PDF ePub
ePub Citation
 Print
Print


INTRODUCTION
Chronic inflammation affects several pathologic processes in type 2 diabetes, cardiovascular disease, and metabolic syndrome.1 In particular, chronic low-grade inflammation has been identified as an integral part of the pathogenesis of vascular diseases, such as hypertension,2 and vascular inflammation has been shown to play a crucial role in the development of hypertension through endothelial dysfunction mediated by a reduced availability of nitric oxide and increased activity of the rennin-angiotensin system.3 Dysfunctional insulin action, insulin resistance, and metabolic syndrome are noted causes of type 2 diabetes: metabolic syndrome increased the risk for diabetes in Framingham Offspring Study subjects,4 and obesity was the most important risk factor for insulin resistance, independent of sex, age, or race in adolescents in a study conducted in the United States.5 In Asians, body mass index (BMI) was also revealed to be an independent risk factor for metabolic syndrome and insulin resistance in Chinese subjects,6 while waist circumference (WC), triglyceride (TG), and glucose were independent risk factors for Homeostasis Model Assessment for Insulin Resistance (HOMA-IR) in non-diabetic Taiwanese subjects.7
Humans are typically exposed to organic mercurial compounds, especially methyl mercury, via consumption of marine mammals and fish,8 which is increasingly emerging as an environmental source of potential mercury toxicity.9 Methyl mercury is produced environmentally by biomethylation of the inorganic mercury present in aquatic sediments. In particular, consumption of contaminated fish can lead to the accumulation of mercury in the human body.10 This bioaccumulation may be associated with chronic inflammation and many clinical diseases, such as hypertension, cardiovascular disease, and stroke,11 as well as insulin resistance,12 mainly due to mercury-induced mitochondrial dysfunction, oxidative stress,13 and lipid peroxidation.14
HOMA-IR is widely used to represent insulin resistance, and the respective cutoff value for HOMA-IR in Korean non-diabetic adults has been reported as 2.34 (sensitivity 62.8%, specificity 65.7%).15 Meanwhile, few studies have evaluated the relationships between blood mercury levels and insulin resistance according to HOMA-IR in Korean nondiabetic subjects. Accordingly, the aim of this study was to demonstrate the impact on blood mercury levels on insulin resistance by HOMA-IR in a nondiabetic Korean population using data from the Korean National Health and Nutrition Examination Survey (KNHANES).
MATERIALS AND METHODS
Study population and data source
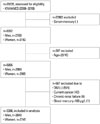
The KNHANES, conducted periodically by the Korea Centers for Disease Control and Prevention since 1998, provides comprehensive information on health status, health behavior, nutritional status, socio-demographics, and biomarkers of environmental exposure for 600 national districts across Korea. The health interview component in KNHANES is conducted through face-to-face interviews at the participants' homes by trained interviewers. Blood mercury data from the fourth (IV-2, 3, 2008, 2009) and fifth (V-1, 2010) KNHANES data samplings were utilized in this cross-sectional analysis. From an initial total of 29235 men and women, 23847 subjects were excluded for missing data of blood mercury (22883 subjects), age under 20 years (397 subjects), type 2 diabetes (515 subjects), current cancers (42 subjects), chronic renal failure (nine subjects), and blood mercury >498.5 nmol/L (one subject). Diabetes was defined as a fasting glucose level ≥126 mg/dL (6.99 mmol/L), current use of antidiabetic medications, or a self-reported physician diagnosis of diabetes. For the exclusion of current cancers and chronic renal failure, we used personal medical history recorded at the initial KNHANES interview. A final total of 5388 subjects (2643 males and 2745 females) were included for analysis in this study (Fig. 1). Although we suffered from a loss of much of the population data, blood mercury data remained evenly distributed for three years studied (33.9% in 2008, 33.9% in 2009, 32.1% in 2010), suggesting that the data were still representative. All participants provided written informed consent to participate in the survey.
Measurements
Body weight and height were measured in light indoor clothing without shoes to the nearest 0.1 kg and 0.1 cm, respectively. WC was measured at the narrowest point between the lower border of the rib cage and the iliac crest. BMI was calculated as the ratio of weight/height2 (kg/m2). Systolic blood pressure (SBP) and diastolic blood pressure (DBP) were measured in the right arm using a Baumanometer standard mercury sphygmomanometer (Baum, Copiague, NY, USA). The average of two SBP and DBP readings recorded at a 5-min interval was used for analysis. Blood samples were collected year round after an 8 h fast. They were immediately processed, refrigerated, and transported in cold storage to the NeoDin Medical Institute (Seoul, Korea) for analysis within 24 h. Total cholesterol (TC), TG, and high density lipoprotein cholesterol (HDLC) levels were measured using a model 7600-110 chemistry analyzer (Hitachi, Tokyo, Japan). Fasting blood glucose concentrations were measured using a Pureauto S GLU automated analyzer with an enzymatic assay (Daiichi, Tokyo, Japan), and serum insulin concentrations were measured using an INS-Irma gamma counter with an immunoradiometric assay (Biosource, Nivelles, Belgium). Insulin resistance was estimated using HOMA-IR calculated as: [fasting insulin (mU/L)×fasting glucose (mmol/L)]/22.5. Blood mercury was measured by the Gold-Amalgam method using a DMA-80 apparatus (Milestone, Italy); the inter-assay coefficients of variation were 0.47-6.08%. Physical examinations were performed by trained investigators following a standardized procedure. Current smokers were defined as those who had smoked more than five packs of cigarettes during their life and were currently smoking; past-smokers included smokers who had smoked in the past but had quit; and non-smokers had no history of smoking. Regular alcohol drinkers comprised those who drank alcohol currently more than one time per month, while nondrinkers included all others.
Statistical analyses
Complex sample analysis was used for the KNHANES data to weight all values, as recommended by the Korea Centers for Disease Control and Prevention. At first, clinical characteristics for all study subjects, including age, BMI, WC, blood pressure, metabolic markers including fasting blood glucose, insulin, TC, HDLC, TG, and blood mercury level were analyzed by a simple descriptive method after data weighting. Smoking status and alcohol consumption were evaluated by the χ2 test. To determine correlations between blood mercury level and other metabolic parameters, Pearson correlation coefficients were generated after log transformation of blood mercury concentrations to create a normal distribution. To elucidate the relationships between blood mercury levels and HOMA-IR, as well as other metabolic parameters, blood mercury levels were divided into quartiles, and HOMA-IR, as well as the other metabolic parameters (as dependent variables), and blood mercury quartiles (as a fixed factor) were compared by ANCOVA test. In addition, to evaluate further correlations between blood mercury and HOMA-IR, linear regression analysis was conducted. Finally, the odds ratio (OR) of having the highest quartile of HOMA-IR according to blood mercury quartiles was calculated by logistic regression analysis after dividing HOMA-IR into quartiles with adjustment for age, TC, and TG. P for trend was used to assess the significance of all analyses. Data were analyzed using SPSS 19.0 (SPSS Inc., Chicago, IL, USA) to account for the complex sampling design.
RESULTS
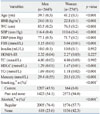
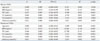
The clinical characteristics of all study subjects are presented in Table 1. A total of 5388 subjects, including 2643 men and 2745 women, were evaluated in this cross-sectional study. The mean ages of the men and women were 39.7 years and 41.2 years, respectively. Mean BMI and WC were 24.0 kg/m2 and 83.5 cm, respectively, in men and 22.8 kg/m2 and 76.5 cm in women. Other respective values in men and women comprised average fasting blood sugar (FBS; 5.15 and 5.04 mmol/L), insulin (10.0 and 10.0 mU/L), HOMA-IR (2.32 and 2.27), TC (4.80 and 4.80 mmol/L), HDLC (1.29 and 1.47 mmol/L), and TG (1.69 and 1.18 mmol/L). Blood mercury levels in men (29.4 nmol/L) were higher than those in women (20.5 nmol/L). As expected, current smokers and regular alcohol consumption were higher in men than in women.
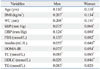
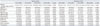
In the analysis of correlations between log-transformed blood mercury and metabolic parameters, all metabolic parameters showed significant differences, except for HDLC in men and TG in women. The overall number of correlations between blood mercury and metabolic parameters was greater in men than in women. Among metabolic parameters, blood mercury showed relatively good correlation with BMI (r=0.207, p<0.001 in men and r=0.134, p<0.001 in women) and WC (r=0.206, p<0.001 in men and r=0.151, p<0.001 in women). Markers of glycemic control such as FBS, insulin, and HOMA-IR showed significant correlations with blood mercury, which were also greater in men than in women (Table 2). Blood mercury levels were divided into quartiles for comparison with other metabolic parameters. In men, FBS and HOMA-IR increased in a step-wise manner as the quartiles of blood mercury increased. FBS showed significant differences for all quartiles of blood mercury when compared with the first quartile. Additionally, HOMA-IR differed significantly for the third and fourth quartiles of blood mercury, compared with the first quartile, even though there was no significant difference in insulin levels. In women, FBS and HOMA-IR differed significantly for the third and fourth quartiles of blood mercury, compared with the first quartile. Blood insulin levels also showed no difference among the quartiles of blood mercury (Table 3).
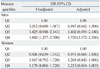
To elucidate lineal relationships between HOMA-IR and other metabolic parameters that exhibited a significant influence on HOMA-IR, we conducted a linear regression an-alysis of age, BMI, WC, TC, TG, and blood mercury, using HOMA-IR as a fixed factor and the other metabolic parameters, including blood mercury, as dependent factors. As expected, BMI and WC showed a good linear relationship with HOMA-IR in both sexes. In addition, TC and TG showed weak but significant linear relationships with HOMA-IR. Blood mercury levels in both sexes also showed a significant but weak linear relationship with HOMA-IR (Table 4). To further evaluate the association of HOMA-IR with blood mercury, HOMA-IR levels were divided into quartiles, and the ORs of having the highest quartile of HOMA-IR according to quartiles of blood mercury were calculated after adjustment for age, TC, and TG. Because BMI and WC were correlated with blood mercury and HOMA-IR levels, we only adjusted for age, TC, and TG. The OR of having the highest quartile of HOMA-IR was greatest for the highest quartile of blood mercury levels [OR=1.720, 95% confidence interval (CI); 1.172-2.526], compared with the lowest quartile, in men. There was no significant OR for blood mercury quartiles in women (Table 5).
DISCUSSION
In this cross-sectional study of the associations of blood mercury levels with insulin resistance, blood mercury concentrations showed a weak but positive association with insulin resistance. In particular, blood mercury concentration showed a greater effect on insulin resistance in men than in women. Even though blood mercury levels were not an independent or strong risk factor for insulin resistance and their correlation with HOMA-IR was weak, their use as a risk factor for insulin resistance may be possible if coupled with other metabolic parameters.
Mercury overload from various sources, including consumption of elemental mercury or inhaled mercury vapor, methyl and ethyl mercury are converted by biomethylation to inorganic divalent mercury, the toxic form that accumulates in human organs and tissues.9 Disruption of metal ion homeostasis may lead to oxidative stress, a state where increased formation of reactive oxygen species overwhelms the body's antioxidant protection and subsequently induces DNA damage, lipid peroxidation, protein modification, and other effects, which are all symptomatic for numerous diseases, including cancer, cardiovascular disease, diabetes, atherosclerosis, neurological disorders such as Alzheimer's disease and Parkinson's disease, and chronic inflammation.16 In our study, we noted consistent increases HOMA-IR with increasing blood concentrations of mercury. In both men and women, HOMA-IR was significantly elevated in the third and fourth quartiles of blood mercury compared with the first quartile, in which HOMA-IR values were over 2.34 in men, the typical cut-off value for insulin resistance in Korean non-diabetic adults, and around 2.34 in women. As for blood mercury concentrations, blood mercury levels over 30.4 nmol/L (range of blood mercury levels; 25.5-36.9 nmol/L) in men and 20.7 nmol/L (range of blood mercury levels; 17.7-24.6 nmol/L) in women were significantly associated with increases in HOMA-IR, indicating that HOMA-IR can be increased at lower levels of blood mercury in women. Nevertheless, the ORs of having the highest quartile of HOMA-IR were significant only for the highest quartile of blood mercury (range of blood mercury levels; 36.9-284.0 nmol/L) in men, not in women, after adjustment for age, TC, and TG. This was partially due to gender differences in blood mercury levels and the corresponding OR of having the highest quartile of HOMA-IR. In addition to the difference in blood mercury levels, women may also respond differently to mercury exposure: in a study that evaluated neuropsychiatric symptoms according to omega-3 and mercury exposure among freshwater fish-eaters, a positive association was noted between hair mercury and neuropsychiatric symptoms solely for women, suggesting that men may respond differently to mercury exposure.17
In 2012, the National Institute of Environmental Research in Korea announced that blood mercury levels among Koreans were higher than those of other countries.18 In a 2009-2011 examination of 6000 Korean men and women, the average blood mercury level was 3.08 µg/L (15.4 nmol/L), which was more than three times those for the United States (0.94 µg/L, 4.69 nmol/L), Germany (0.58 µg/L, 2.89 nmol/L), and Canada (0.69 µg/L, 3.44 nmol/L). In a biomonitoring study of lead, cadmium, and mercury in the blood of New York city adults, the geometric mean blood mercury concentration was 2.73 µg/L (13.6 nmol/L) and more than three times that at the national level. Interestingly, blood mercury levels were elevated 39% in the highest income group relative to the lowest, and concentrations in adults who reported consuming fish or shellfish 20 times or more in the last 30 days were 3.7 times higher than that in those who reported no consumption of fish and shellfish.19 In the Korean population, the geometric mean of blood mercury levels (3.08 µg/L, 15.4 nmol/L) was more prevalent in subjects over 40 years of age than in those younger than 40 years, higher in those who consumed alcohol, and increased with more frequent fish consumption.20 As a blood mercury level of 3.08 µg/L (15.4 nmol/L) is not particularly toxic, we cannot conclude a causal effect thereof on general health including insulin resistance. However, in view of our results, we can cautiously presume a possible effect on vascular inflammation or insulin resistance. Even though blood mercury levels did not display a strong linear relationship with HOMA-IR, compared with BMI, WC, TC, TG, and C-reactive protein (not analyzed in our study), HOMA-IR increased as blood mercury levels increased, and subjects with blood mercury levels higher than the geometric mean showed HOMA-IR values significantly greater than the cutoff value of HOMA-IR for insulin resistance in Koreans. This may indicate that blood mercury is an important risk factor for insulin resistance. In addition to insulin resistance, several cross-sectional studies have shown positive links between methylmercury exposure and higher blood pressure or prevalent hypertension.21,22 mainly due to vascular inflammation. These results may also support the notion of blood mercury as a risk factor for insulin resistance in the general population and provide further evidence of the risk of environmental exposure to mercury.
There were several limitations in this study. This was a cross-sectional study, which has a limitation in demonstrating the causality of insulin resistance and blood mercury. Second, study data were based on the KNHANES, which involves one nation and ethnicity; the results cannot be generalized globally. However, the data provide an important reference for studies conducted in other nations and with other ethnicities. Third, we could not adjust for all possible confounders that may affect insulin resistance or HOMA-IR, such as hormones23 or lower BMI.24 We only adjusted for age, TC, and TG to evaluate the OR of being in the highest quartile of HOMA-IR according to quartiles of blood mercury, because BMI and WC had stronger correlations with HOMA-IR than blood mercury concentration. Despite these limitations, this is the first study to demonstrate an association between blood mercury concentration and HOMA-IR in a large population-based data.
In conclusion, blood mercury showed a weak but significant association with HOMA-IR and may be a potential risk factor for insulin resistance in Koreans. Careful consideration of blood mercury levels in relation to insulin resistance is warranted.
 XML Download