

 PDF
PDF ePub
ePub Citation
 Print
Print


INTRODUCTION
Small for gestational age (SGA) is a clinically significant pregnancy disorder. Commonly, SGA is defined as a birth weight at or below the 10th percentile for gestational age.1
Infants of low birth weight for gestation are at increased risk for neonatal morbidity and mortality and consequently may require intensive care. Moreover, the prevalence of long-term developmental problems is high during adolescence and early adulthood among infants of low birth weight. SGA is also frequently associated with serious perinatal complications. For example, fetal distress and intrauterine fetal death may occur during the fetal period, and neonatal distress such as pneumonia, sepsis, pulmonary hemorrhage, hypoglycemia, hypoproteinemia, and electrolyte abnormalities may present during the neonatal period. Many studies have suggested that in children born SGA, there is an association with the development of metabolic syndrome in adult life, such as hypertension and renal diseases,2 and there is an increased incidence of immune diseases, such as asthma, during school age.3
SGA has several different causes, such as intrauterine infections, multiple gestation, abnormality of the placenta, umbilical cord, and chromosomes, congenital malformation, congenital birth defects, maternal complications (pre-eclampsia, hypertensive disorder, diabetes, asthma, anemia, and hyperthyroidism), and drug intake; however, most cases of SGA are of unknown origin.4 According to a recent review article, SGA fetuses constitute a large heterogenous group that includes healthy small fetuses, chromosomally abnormal fetuses, and fetuses suffering from utero-placental insufficiency leading to intrauterine growth restriction (IUGR).5 Recent studies have shown that IUGR represents a human model of chronic fetal hypoxia, and a relationship between IUGR and pro-inflammatory cytokines has been described.5,6 Hypoxia and inflammation reaction, which are indicated as a cause of IUGR, can lead to varied responses in the body. In particular, it is reported that this hypoxia and inflammation reaction induce changes of the immune system by producing fractional (subset) changes in lymphocyte blast cells in the body.7,8,9,10
Regulatory T cells are lymphocytes expressed as CD4+ CD25highFoxP3+, and these play an important role in the maintenance of self-tolerance and immune homeostasis. When immune system variation is represented in vivo, fractional changes of regulatory T cells occur. There is no doubt that regulatory T cells expand in the periphery in human pregnancy and are present in significant numbers at the fetal-maternal interface.11
In SGA, the immune system is likely to be changed by hypoxia and inflammatory reaction during pregnancy. While many early studies focused on the depressed immune responses of SGA infants, more recent research suggests that these defects may persist beyond infancy. However, in spite of this probability, efforts to explore the condition of the immune system by directly investigating changes of lymphocytes in the blood of SGA infants have so far proven to be unsatisfactory.
In this study, we attempted to compare the distribution of lymphocyte subsets including regulatory T cells in cord blood between appropriate for gestational age (AGA) neonates and SGA neonates.
MATERIALS AND METHODS
Study population
This study was performed using a sample of 108 pregnant mothers who delivered full-term neonates, based on a pregnancy period of 37-41 weeks at Konkuk University Hospital during the period from November 2010 to April 2012. Cases of multiple gestation, congenital malformation, placental abnormalities (placenta previa, placenta accrete, and velamentous insertion of the cord), and maternal conditions [Behcet's disease, Herpes Simplex Virus (HSV) infection, viral meningitis, tuberculosis, and systemic lupus erythematosus] were excluded from the sample. There were 31 SGA neonates among a total of 108, and at the time of birth, depending on the gestational age, the diagnostic standard of SGA was established based on a weight below the 10th percentile (37 weeks: 2.541 g; 38 weeks: 2.714 g; 39 weeks: 2.852 g; 40 weeks: 2.929 g; 41 weeks: 2.948 g).1 The number of neonates with a normal weight was 77, and this was established based on the weight between the 10th percentile and 90th percentile (37 weeks: 2.542-3.755 g; 38 weeks: 2.715-3.867 g; 39 weeks: 2.853-3.980 g; 40 weeks: 2.930-4.060 g; 41 weeks: 2.949-4.094 g).1 The study was approved by the Institutional Review Board. Written informed consent was obtained from all participants.
Sample collection
We drew blood from the umbilical cord intravenously for research shortly after birth. The 9-mL cord blood samples were collected in sterile EDTA tubes, dividing each sample by placing about 3 mL into each EDTA tube. We gently agitated the tubes from side to side for about 30-60 seconds in order to prevent clotting, and these specimens were then stored in a refrigerator. All experiments were performed within 24 hours after blood sampling.
Flow cytometry analysis
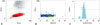
Multicolor flow cytometry analysis was performed using Cytomics FC500 and CXP software (Beckman Coulter, Fullerton, CA, USA). In order to separate mononuclear cells in the cord blood, 6 cc of each specimen was used for density gradient centrifugation using a Ficoll filter (Ficoll-Paque, GE Healthcare Life Sciences, Milan, Italy). By floating the obtained mononuclear cell layer in phosphonate-buffered saline, its concentration was maintained as 1×10⁶ cells/mL. In order to find the regulatory T cells among the mononuclear cells, a Human Regulatory T Cell staining Kit (eBioscience, San Diego, CA, USA) containing CD4, CD25, and FoxP3 was used. This kit included fluorescein isothiocyanate (FITC)-CD4, phycoerythrin (PE)-CD25, and PE-cyanin5-FoxP3. To create isotype-negative controls that would in turn define the positive population, cells were stained with PE-cyanine 5-conjugatd rat IgG2a for 30 minutes at 4℃. After gating, the percentage of FoxP3+ cells (CD4+CD25highFoxP3+) was counted in the CD4+ population (Fig. 1).
For lymphocyte subsets, 3 mL of cord blood was incubated for 15 minutes at room temperature with the following two-color antibody combinations: CD3-FITC/CD8-PE, CD3-FITC/CD4-PE, CD3-FITC/CD19-PE, and CD3-FITC/CD16 plus CD56-PE. Cytomics FC500 software was used to analyze cytotoxic T cells (CD3+CD8+), helper T cells (CD3+CD4+), B cells (CD3-CD19+), and natural killer cells (CD3-CD16+CD56+).
Statistical analysis
In order to comparatively analyze clinical features and the lymphocyte blast cell ratio of the SGA and AGA groups, Student's t-test was used, and the mean, maximum, and minimum values were also obtained. Statistical analysis was performed using SPSS 18 software (SPSS Inc., Chicago, IL, USA). p values equal to or less than 0.05 were considered statistically significant.
RESULTS
Comparison of general clinical features between the two groups
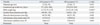
The maternal age, gestational age, birth weight, systolic BP, diastolic BP, and proteinuria of each group were compared. Significant differences were not present in maternal age, gestational age, systolic BP, diastolic BP, and proteinuria. Birth weight was significantly different between the infant group of normal weight (3.270 g) and the SGA group (2.540 g; p<0.001) (Table 1).
Comparison of regulatory T cells of the two groups
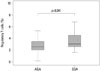
In the AGA group, the mean value of regulatory T cells was 2.59%, the minimum value was 0.13%, and the maximum value was 8.06%. In the SGA group, the mean value of regulatory T cells was 3.02%, the minimum value was 0.60%, and the maximum value was 6.81%.
Comparison of lymphocyte subsets of the two groups
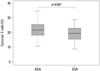
The distribution of lymphocyte subsets in the cord blood is summarized in Table 2. When compared according to birth weight, there were no statistical differences in helper T cells (AGA: 49.96% [12.49-72.72%]; SGA: 52.23% [35.31-82.64%]; p=0.148), B cells (AGA: 16.79% [16.38-36.85%]; SGA: 16.96% [4.46-29.60%]; p=0.821), or NK cells (AGA: 8.46% [0.65-31.66%]; SGA: 9.38% [1.58-25.49%]; p=0.421). However, the distribution of cord-blood cytotoxic T cells showed a significant difference between AGA and SGA groups (AGA: 21.64% [10.72-36.51%]; SGA: 19.30% [8.60-28.68%]; p=0.007) (Table 2, Fig. 3).
DISCUSSION
Lymphocytes are cells that create an immune response in the body; they include T cells, B cells, and natural killer cells, and when these lymphocytes become abundant, they respond to antigens with high sensitivity, potentially resulting in the occurrence of allergic diseases. T cells include helper T cells, cytotoxic T cells, and regulatory T cells. Helper T cells induce a greater immune response by secreting various cytokines, and cytotoxic T cells eventually inhibit the immune response by directly attacking or removing other cells through apoptosis. Regulatory T cells that positively inhibit the activation of other T cells are expressed as CD4, CD25, and FoxP3. This regulatory T cell plays an important role in maintaining self-tolerance and immune homeostasis and preventing autoimmune disease.12,13,14,15 In addition, regulatory T cells are able to prevent organ transplant rejection by inhibiting the response of CD4+ cells.16,17
In order to maintain a successful pregnancy, the immune system of pregnant women during the gestational period shows special variation that involves regulatory T cells positively inhibiting activation of various T cells.11 An increase of regulatory T cells of pregnant women during the gestational period is observed at an early stage of pregnancy.18,19 This change implies that regulatory T cells in the blood of pregnant women apparently recognize the fetus as an antigen derived from a paternal line.20,21 These regulatory T cells are considered to play an important role in maintaining immune homeostasis for the fetus in pregnant women during the gestational period.22,23 In a study, it was reported that the number of regulatory T cells in the blood of pregnant women during pregnancy was significantly increased and this value dropped after delivery;18 additionally, the number of regulatory T cells in the blood of pregnant women during the second trimester was found to be mostly increased.24 When spontaneous abortion was compared with normal pregnancy for the first time in 2004, it was reported that the number of regulatory T cells in the blood of pregnant women was low,25 and another study reported that in the case of abortion at an early stage of pregnancy, a decrease of regulatory T cells was shown as well.26 The immunology mechanisms taking place in the placenta during pregnancy have been investigated since the 1990s, and it was reported that as implantation progressed, the ratio of lymphocytes increased in the decidualized endometrium.27,28 In addition, as a result of analyzing regulatory T cells in the endometrial tissue of infertile females, an insufficiency of regulatory T cells was found.29
Large amounts of research relevant to pregnancy have been performed in a similar way; however, most of this research has focused on the maternal blood and placenta. Although umbilical cord blood reflects the condition of the fetus during pregnancy, the research on cord blood from SGA neonates is still far from satisfactory.
The distribution of regulatory T cells in normal cord blood has not yet been defined. In several previous studies, the distribution of regulatory T cells in cord blood was reported as 2-3%,30 2.63-8.94%,11 and 4.0-10.0%.31 However, these studies were limited in that they enrolled small sample numbers. In 2012, an investigative study on the lymphocyte subset in cord blood was undertaken for the first time. This study provided the reference intervals for lymphocyte subsets including regulatory T cells in umbilical cord blood from healthy full-term neonates. In this study, the reference intervals for lymphocyte subsets were: helper T-cells (CD3+/CD4+), 15.40-70.06%; cytotoxic T-cells (CD3+/CD8+), 9.65-34.28%; B-cells (CD19+), 4.50-29.59%; and natural killer cells (CD3-/CD16+/CD56+), 1.42-28.03%. The reference interval for regulatory T cells was 0.35-9.07%, and this value was shown to have a wider range than the reference values (1.7-7.0%) of adult peripheral blood.22
As a follow up study, we attempted to compare the distribution of lymphocyte subsets including regulatory T cells in cord blood between AGA and SGA neonates for the first time. In our study, regulatory T cells were increased (p=0.041); however, cytotoxic T cells were decreased (p=0.007) in the SGA group compared with normal controls. Additionally the distribution of helper T cells, B cells, and NK cells did not differ according to fetal body weight.
SGA fetuses are a heterogeneous group comprising fetuses that have failed to achieve their growth potential due to intrauterine growth restriction and fetuses that are constitutionally small.5 According to a recent study, SGA of which specific cause has not been clarified has a close relationship with hypoxia and increased inflammation response.5,6
In the context of hypoxia, hypoxia inducible factor-1 (HIF-1) is expressed, and this factor plays the important role of regulating glycolysis, angiogenesis, erythropoiesis, and cell survival.32 HIF-1 is able to function throughout all aspects of normal and abnormal placental differentiation, growth, and function, including during the first trimester (physiologically low oxygen), during mid-late gestation (where there is an adequate supply of blood and oxygen to the placenta), and in pathological pregnancies complicated by placental hypoxia or ischemia.33
One study investigated hypoxia-inducible transcription factor in IUGR placentas, comparing placentas from normal pregnant, pre-eclampsia, and IUGR patients. In this study, the pre-eclampsia-to-normal pregnant placenta ratio for HIF-1 was 1.67 (p<0.001), and the IUGR-to-normal pregnant placenta ratio was 1.03 (p=not significant).34
Generally, hypoxia causes fractional changes of lymphocyte blast cells.7,8,9,10 In a hypoxic environment, these lymphocyte fractional changes may lead to variation in inflammation response markers. According to a recent study, HIF-1 regulates the balance of the lymphocyte fraction.7 HIF-1 also increases T helper cell type 2 (Th2) yet decreases T helper cell type 1 (Th1).35,36,37 In general, Th2 cells are excellent helpers for B-cell antibody secretion; however, Th1 cells also interact with cytotoxic T cells and macrophages.38 Additionally, Th1 cells produce pro-inflammatory cytokines such as interleukin (IL)-2, gamma-interferon, and tumor necrosis factor-beta,39 whereas Th2 cells secrete anti-inflammatory cytokines such as IL-4 and IL-5.39 Other cytokines, such as IL-3, IL-6, and tumor necrosis factor-alpha, are produced by both Th1 and Th2 cells.39 Anti-inflammatory cytokines play a critical role in pregnancy maintenance.40 From the formation of the placenta there tends to be bias toward Th2 cytokine production, which is typically anti-inflammatory.41 This bias is thought to protect the developing blastocyst by down-regulating inflammatory and cytotoxic Th1-type activity until the placental barrier is established.42,43
In our study, cytotoxic T cells were decreased (p=0.007), and B-cells (p=0.821) were increased in the SGA group compared with normal controls. It has been hypothesized that SGA can be compensated by regulation of cytokine production favoring anti-inflammation. The expressed HIF-1 in a hypoxic environment such as in SGA increases Th2 cells, which secrete anti-inflammatory cytokines yet decrease Th1 cells, which secrete pro-inflammatory cytokines for pregnancy maintenance. Consequently, an anti-inflammatory environment, due either to increased production of anti-inflammatory cytokines or to decreased production of pro-inflammatory cytokines, could be an important factor in the etiology of intrauterine growth restriction.
Recent data suggest that hypoxia and its principal molecular signature HIF-1 may tune down inflammation by dictating anti-inflammatory programs.9 Hypoxia has been demonstrated to up-regulate the expression of FoxP3 in human and murine mononuclear cells.9 The effects of hypoxia on FoxP3 expression were found to be HIF-1-dependent as they were abolished upon transfection with short-interfering RNAs for HIF-1 and promoted by HIF-1 overexpression.9 Thus, it was determined that HIF-1 increases regulatory T cells.9 The conclusion of this previous study is similar to our present finding that the number of regulatory T cells in the cord blood of SGA infants was higher than AGA.
A limitation of this study is that the number of SGA infants as an experimental group was limited to 31, and a more reliable result would have been obtained if the targets of the experimental and control groups were higher in number.
However, our data suggest that the hypoxic environment in SGA may lead to a change of lymphocyte distribution in umbilical cord blood for the preservation of pregnancy.
To our knowledge, this is the first study to compare the distribution of lymphocyte subsets including regulatory T cells in cord blood between AGA and SGA neonates.

 XML Download