

 PDF
PDF ePub
ePub Citation
 Print
Print


INTRODUCTION
The polycystic ovary syndrome (PCOS) is a common endocrine-metabolic disease, affecting 5-10% of all women in reproductive age. It is characterized by a combination of hyperandrogenism, chronic anovulation, and polycystic ovaries. PCOS appears to be associated with an increased risk of metabolic aberrations, including insulin resistance and hyperinsulinemia, type 2 diabetes mellitus, dyslipidemia, and cardiovascular disease.1 The insulin resistance resulting in hyperinsulinemia is common in PCOS.2
At the heart of the pathophysiology of PCOS for many is the insulin resistance and hyperinsulinemia, and it may also lead to hyperglycemia and an adverse profiles of cardiovascular risk factors. Although the links between the insulin resistance and the associated dyslipidemia, hypertension, and atherosclerosis are complex, dysregulation of fatty acid metabolism seems central to the pathophysiology of the insulin resistance syndrome, as it is related to cardiovascular disease.1 The homeostasis model assessment (HOMA) of β-cell function and insulin resistance (IR) is the most widely used index to evaluate the insulin resistance by using measures based on fasting parameters.3,4
HOMA-IR has proven to be reliably used in a large scale or epidemiological studies by demonstrating good correlations with the hyperinsulinemic-euglycemic glucose (HIEG) clamp.5 However, the use of HOMA index is not available easily, because the insulin levels are not measured during the usual health examination and in clinical practice. It is important for us to be able to evaluate insulin resistance by measuring the liver or lipid profiles, which are inexpensive and routinely measured in the clinical setting.
Triglyceride (TG), high-density lipoprotein cholesterol (HDL-C),6,7 and total cholesterol (TC)/HDL-C ratio are associated independently with insulin resistance and risk factors of cardiovascular disease (CVD).8 In insulin resistant states, non-esterified fatty acids are mobilized from the muscle and adipose tissues to the liver, thereby increasing the substrate for TG production. On the other hand, insulin resistant person can also have a characteristic dyslipidemia,9 and measuring these variables might help identify insulin resistance.
Extensive research has been carried out in the last decade to ascertain the role of alanine aminotransferase (ALT), aspartate aminotransferase (AST), and gamma-glutamyltransferase (γ-GT) levels that independently predict type 2 diabetes,7,10 metabolic syndrome,6,9 and CVD.7 These markers have been shown to be associated with indirect measurements of insulin resistance, including fasting insulin levels and HOMA-IR. Additionally, recent several studies have discussed on the relationship between high sensitivity C-reactive protein (hs-CRP) and insulin resistance.11,12,13,14
In this study, we evaluated that lipid profiles and liver enzymes are surrogate markers for recognizing insulin resistance in Korean women with PCOS.
MATERIALS AND METHODS
Subjects
We recruited 458 women with PCOS from gynecology and endocrinology clinics at Ewha Womans University Mokdong Hospital from July 2010 through December 2013. In accordance with the European Society for Human Reproduction and Rotterdam Embryology/American Society for Reproductive Medicine (ESHRE/ASRM)-sponsored PCOS consensus workshop group, the diagnoses were based on Rotterdam criteria. The PCOS was diagnosed when at least two of the three criteria were met, which are as follows: 1) oligo- and/or anovulation, 2) clinical and/or biochemical signs of hyperandrogenism, 3) polycystic ovaries by transvaginal or transrectal ultrasonography.15 Furthermore, the diagnosis of PCOS was made only after excluding the following conditions: congenital adrenal hyperplasias, androgen-secreting tumors, Cushing's syndrome, hyperprolactinemia, thyroid dysfunction, an ovarian tumor, current pregnancy within 1 year of enrollment, autoimmune disease, malignancy, central nervous system disease, current use of oral contraceptives within 6 months of enrollment, the use of medications known to affect the hypothalamic-pituitary-ovarian axis, such as antiandrogens, ovulation induction agents, antidiabetic medications, antiobesity medications, and glucocorticoids, heavy smokers and alcohol drinkers.
On the basis of their body mass index (BMI), women with PCOS were divided into two groups: non-obese (with a BMI<25.0 kg/m2) and obese group (with a BMI≥25.0 kg/m2). The Institutional Review Board of the Ewha Womans University Mokdong Hospital approved the study protocol, and written informed consent was obtained from all of the participants.
Data collection
Weight and height were measured for all subjects, and BMI was calculated as weight (kg)/height (m2). Blood pressure was determined as the mean of two manual sphygmomanometer readings with the patient in the sitting position. The venous blood samples were taken from all subjects, after overnight fasting for at least 8 hours, and on the third day of their follicular phase of menstrual cycle. In the case of women with amenorrhea, blood was sampled, considering the ovarian morphology investigated by ultrasound. Ultrasound examination was performed with a 7-MHz transvaginal transducer (Logic 400 General Electric, Milwaukee, WI, USA) or transrectally for virginal women.
Total testosterone (TT) levels were measured by chemiluminescent immunoassay method by using a commercially available kit (Siemens, Tarrytown, NY, USA), and sex hormone-binding globulin (SHBG) levels were measured by immunoradiometric assay by using a commercial kit (Diagnostic Products Corporation, Los Angeles, CA, USA). Free testosterone levels were calculated by using the formula available on the web site of the International Society for Study of the Aging Male (http://www.issam.ch/freetestos.htm), for TT, SHBG, and albumin levels in the same sample from each subject. 17α-hydroxyprogesterone (OHP) levels were measured for exclusion of congenital adrenal hyperplasia.
The 75 g oral glucose tolerance test was performed on the subjects in the morning, after an overnight fasting. Therefore, a polyethylene catheter was placed into the antecubital vein before the test. Venous blood samples were drawn at the baseline and at 120 minutes after the 75 g glucose load. Plasma glucose levels were measured by the glucose oxidase method (Beckman Model Glucose Analyzer 2, Fullerton, CA, USA) and insulin levels were measured by radioimmunoassay with commercially available kit (Biosource, Nivelles, Belgium).
TC, TG, HDL-C, low-density lipoprotein cholesterol (LDL-C), fasting plasma glucose (FPG), uric acid, hs-CRP, γ-GT, ALT, AST, and immunoreactive insulin (IRI) were measured during fasting. Participants with TG levels ≥400 mg/dL were excluded. HOMA-IR was calculated from FPG and IRI levels using the following formula: [FPG (mg/dL)×IRI (mU/mL)]/405; and a level of insulin resistance was defined as HOMA-IR≥2.5.3,16,17,18
Statistical analysis
Statistical analysis was performed by using IBM SPSS Statistics Version 20 (Statistical Package for Social Science Japan, Inc., Tokyo, Japan). Quantitative variables are given as means±standard deviation. Data for TC, TG, LDL-C, γ-GT, TT, SHBG, 17α-OHP, ALT, and AST were skewed and presented as median (interquartile range) values, and were log-transformed for analysis.
Subjects were divided into two groups, based on BMI (non-obese<25.0 kg/m2; obese≥25.0 kg/m2), and differences between the two groups were determined by Student's t-test and χ2 test. In addition, areas under the receiver operating characteristic (ROC) curves were used to compare the power of these serum markers. Areas under the ROC curves are provided with standard errors.
Sensitivity and specificity for TG were calculated based on the point of inflection in these ROC curves. Likelihood ratios were calculated as the ratios of sensitivity/(1-specificity) for positive likelihood ratio and (1-sensitivity)/specificity for negative likelihood ratio. Multiple linear regression analysis was used to evaluate the contribution of each confounding factor for HOMA-IR. Two tailed p-values of <0.05 were considered to be significant.
RESULTS
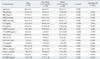
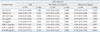
The clinical and biochemical characteristics of PCOS women were categorized by BMI (Table 1). The patients with PCOS included 352 non-obese women in 26.2±3.8 years of age and 106 obese women in 28.2±4.7 years of age. The mean BMI of non-obese (BMI<25.0 kg/m2) PCOS women was 20.4±2.0 kg/m2 and the mean BMI of obese group (BMI>25.0 kg/m2) was 28.2±3.6 kg/m2. The following data were significantly different between the non-obese and the obese groups: systolic blood pressure, diastolic blood pressure, TG, TC, HDL-C, LDL-C, ALT, AST, ALT/AST ratio, γ-GT, and hs-CRP. The calculated free testosterone was significantly higher in obese women with PCOS by different SHBG, although TT level was not different between the non-obese and obese groups by BMI. All of these differences remained similarly significant in non-obese and obese groups after adjustment of age.
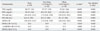
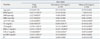
In obese patients, fasting and post-load 2 hour plasma glucose, fasting and post-load 2 hour insulin, and HOMA-IR were significantly higher (Table 2). The prevalence of insulin resistance (HOMA-IR≥2.5) was significantly higher in obese group than in non-obese group. These significant differences also did not change in both non-obese and obese groups after adjustment of age.
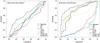
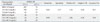
In both non-obese and obese groups, the ROC curve analyses demonstrated that the best marker for insulin resistance was TG, with the areas under the ROC curve of 0.617 and 0.837, respectively (Table 3, Fig. 1). In non-obese PCOS patients, serum HDL-C and hs-CRP were significant markers for insulin resistance, as they had areas under the ROC curve of 0.413 and 0.610, respectively. In obese subjects, HDL-C, LDL-C, ALT, AST, ALT/AST ratio, and hs-CRP were significant markers for insulin resistance, with the areas under the ROC curve of 0.266, 0.698, 0.623, 0.746, 0.219, and 0.734, respectively.
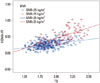
TG had a significant association with HOMA-IR in both non-obese (R2=0.095, p<0.001) and obese subjects (R2=0.336, p<0.001) (Fig. 2). We applied multiple linear regression analysis of the correlation between various confounding factors and HOMA-IR (Table 4). TG and LDL-C were independently and significantly associated with HOMA-IR in both non-obese (β=0.312, p<0.001 and β=0.254, p=0.024) and obese PCOS women (β=0.335, p=0.002 and β=0.437, p=0.040), respectively.
The ROC scatter plot revealed optimal cut-off points of TG for verifying insulin resistance (Table 5). TG of ≥68.5 was a marker for predicting insulin resistance (HOMA-IR ≥2.5) in non-obese PCOS patients. In obese group, TG ≥100.5 was the cut-off point of insulin resistance. In non-obese subjects, the positive likelihood ratio value demonstrated that the odds of insulin resistance were increased by 1.36-fold if TG was 68.5 or more. In obese PCOS patients, the positive likelihood ratio value showed that the odds of insulin resistance were increased by 2.86-fold if the value of TG was 100.5 or more. The negative likelihood ratios manifested decreasing odds of insulin resistance when the values of TG were lower than the cut-off points.
DISCUSSION
The present study evaluated whether lipid and liver profiles were associated with insulin resistance in Korean PCOS patients, categorized by BMI. We classified the participants with HOMA-IR of ≥2.5 as insulin resistant.3,16,17,18 Some previous studies have demonstrated that HOMA-IR strongly correlates with HIEG clamp.3,19 Although HOMA-IR is less accurate than the glucose clamp method in measuring insulin resistance, HOMA model is widely used as clinical and epidemiological tool20,21 because HIEG clamp method is not cost-effective. Thus, we used HOMA-IR as the marker for insulin resistance in this study. Our study showed that insulin resistance was significantly higher in obese PCOS patients than in non-obese PCOS patients.
In non-obese patients, 19.9% of them were insulin resistant, whereas 66% of obese patients have insulin resistance. These percentages are twice as much compared to non PCOS patients categorized by BMI, meaning that even lean women with PCOS showed significantly higher insulin resistance than normal population.22,23,24 Furthermore, TG showed a good correlation with HOMA-IR, and it is a useful marker to predicting insulin resistance in non-obese and obese PCOS patients, since AUC of TG were greater than those of other parameters. Thus, ROC curve analysis indicated that the best cutoff values for TG in identifying insulin resistance were ≥68.5 in non-obese and ≥100.5 in obese patients. The positive likelihood ratio was 2.86, which was the largest for TG in obese PCOS patients.
In previous studies, several liver enzymes and lipid profiles have been proposed as simple and useful clinical indicators of insulin resistance. Kawamoto, et al.18 proposed ALT/AST ratios as simple and useful clinical indicators of insulin resistance in community-dwelling adults. Our present study showed that ALT, AST, and ALT/AST ratio were useful markers for insulin resistance in all normal subjects and obese subjects. However, these markers were not useful in non-obese PCOS subjects because of weak discrimination power compared to TG. Moreover, TG/HDL-C, TC/HDL-C, and LDL-C/HDL-C ratios showed similar potential for insulin resistance, but the reports are not entirely consistent.25,26,28 TG and HDL-C were useful markers of insulin resistance in all subjects and BMI categorized group also. These results are in good agreement with those of previous studies which compared discrimination power with liver enzyme lipid profiles. On the other hand, TG was found to be an acceptable marker for insulin resistance in 50 white Americans, with the area under ROC curve of 0.763, which it was a poor predictor in 99 African Americans with the value at 0.625.18,25
Our results are different from those of Lewis, et al.29 who showed that discrimination power was weaker in obese subjects than non-obese subjects. It is well established that increasing adiposity is associated with insulin resistance. Hypertriglyceridemia and low HDL-C almost never occur as isolated disorders, but they are nearly always associated with insulin resistance, because insulin affects very low-density lipoprotein and HDL-C metabolism.
Some of the limitations in this study are; TG does not necessarily mirror physiological condition of constant changes in glucose and insulin. Furthermore, it has recently been suggested that reliable reference values of HOMA-IR should be established according to age and gender in Korea.30,31 However, no method will ever be capable of truly measuring the insulin sensitivity.5 Nevertheless, this study is a new trial with lipid profiles, which is inexpensive and can routinely be performed in clinical settings, and it would strengthen the models currently being used for identifying subjects with insulin resistance.
In conclusion, TG is inexpensive and routinely measurable clinical variables, which can be used as a surrogate marker for evaluating the insulin resistance in Korean women with PCOS, especially for obese patients.
 XML Download