

 PDF
PDF ePub
ePub Citation
 Print
Print


INTRODUCTION
Autism spectrum disorder (ASD) is a well-known neurodevelopmental disorder that critically impairs social function. The defining symptoms of ASDs include social and communicative deficits,1 as well as restricted and repetitive behaviors and interests.2 Among brain imaging modalities, functional magnetic resonance imaging (fMRI) has been proven to be a useful tool for investigating aberrant neurobiological function in social brain areas of children with ASD due to its excellent contrast properties, spatial resolution, temporal resolution, and noninvasive property; it is also helpful for observing the brain activities of subjects while the subjects perform certain task stimuli.3 Previous studies have taken multiple approaches to examining social brain abnormalities in ASDs. Many researchers have demonstrated aberrant neural mechanism in social cognition of those with ASD in facial processing studies using fMRI.4,5,6 Other prior studies have examined differences of functional connectivity between ASDs and a healthy control group. They reported that ASDs showed significantly reduced functional connectivity compared to TDCs.7,8,9
ASDs are known to be less reinforced by positive social reward such as praise or smiling toward them. Some researchers reported that deficit in social reward leaning would result in qualitative impairment of social function in children with ASD.10 There have been few functional studies related to the reward system of a social learning mechanism of ASDs. One previous study reported that the lateral prefrontal cortex was involved in the integration of cognitive and motivational information and made accurate reward-related decisions in complicated circumstances.11 Another study demonstrated that children with ASD fewer frontostriatal responses to social rewards than TDCs. These decreased responses suggested the neural impairment of social learning in children with ASD.12 There have been several attempts to find social brain abnormalities in Asian children with ASD,13,14 however none of these have included a functional brain imaging study using Korean subjects with ASD.
In this study, we aimed to demonstrate a neural mechanism related to a reward system during a social learning task with Korean children with ASD. We postulated two hypotheses. The first hypothesis was that social reward learning in children with ASD would be less complete than in the healthy controls. The second hypothesis was that the neural mechanisms of social reward systems would differ between children with ASD and TDCs and that the social reward leaning process of an aberrant neural system in children with ASD could contribute to the social deficit of ASDs. Both ASDs and TDCs were asked to perform a social learning task during a functional MRI scan in this study. During the task, subjects sought the correct answers using social cues.
MATERIALS AND METHODS
Subjects
ASDs and TDCs were recruited from a child and adolescent psychiatric clinic in Severance Children's Hospital affiliated with Yonsei University College of Medicine and from an ongoing community epidemiological study in the city of Goyang in South Korea. We initially enrolled and scanned 45 children (39 boys, 6 girls); however, six boys met at least one exclusion criterion. Accordingly, we analyzed the data of 39 subjects (27 ASDs, mean age 9.9±2.5; 12 TDCs, mean age 9.2±1.8) (Table 1). For all children with ASD, the ASDs diagnosis was obtained independently by two child and adolescent psychiatrists based on the Diagnostic and Statistical Manual of Mental Disorders, 4th Edition, Text Revision (DSM-IV-TR) criteria.15 The following characteristics were exclusionary for ASDs: 1) a past or present history of brain damage or convulsive disorder; 2) intellectual disability or language delay; and 3) comorbid child and adolescent psychiatric disorders. All TDCs were screened by two child and adolescent psychiatrists with assessments including a psychological assessment and a neurological examination. None of the TDCs had a past or current developmental, medical, or psychiatric diagnosis. Participants were not sedated for the MRI scanning, and none were taking any psychoactive medications on the day of the scanning. This study was approved by the respective Institutional Review Boards for research with human subjects at Yonsei University Severance Hospital, where this study was performed, and at the Gachon Neuroscience Research Institute in Incheon, South Korea, where all subjects were scanned. All subjects and their parents were given a full description of the study and provided prior written informed assent and consent, respectively.
Screening and diagnostic tools
Social Responsiveness Scale (SRS)-Korean version
The SRS-K was used to screen those with ASD and TDCs before the confirmative diagnostic procedure. The severity of autism symptoms was quantified by the SRS, which consists of a 65-item rating scale commonly used with clinical and general populations. Measurements of social impairments of children were reported by their parents or teachers in their social situations. All items were rated between 0 and 3 and consisted of social awareness, characteristic autistic preoccupations/traits, social information processing, social anxiety/avoidance, and capacity for reciprocal social responses. The SRS is designed to determine a singular scale score that presents the severity of social implements in those with ASD.16 The English version of the SRS strongly correlates with DSM-IV-TR criteria scores estimated from the Autism Diagnosis Interview-Revised (ADI-R). It also shows high test-retest reliability and separates children who show pervasive developmental disorders from children who show other psychiatric disorders.17 We completed the translation and back-translation of the English version of the SRS and gathered the screening data of approximately 1280 children. In male children, the recommended cut-off score (above 70) of American children corresponded to the 97th percentile scores in the Korean sample. This indicated an 83% positive predictive value of ASDs diagnoses (in submission).
Autism Diagnosis Interview-Revised-Korean version (ADI-R-K) and Autism Diagnostic Observation Schedule-Korean version (ADOS-K)
The ADI-R-K and ADOS-K were used in the diagnosis of ASDs. The ADI-R18 is an interview of caregivers and is common and semi-structured. The ADI-R provides algorithms for the 10th revision of the International Statistical Classification of Diseases and Related Health Problems (ICD-10) and DSM-IV-TR for definitions of autism. In this interview, more than 100 items cover information about language, communication, play, social development, developmental milestones, and unusual behaviors and interests. ADI-R diagnostic criteria require a specified threshold on four algorithm domains: communication, repetitive behaviors, social interaction, and age at which certain symptoms start. The ADOS19 is also a common diagnosis tool that contains a semi-structured assessment of social interaction, communication, play, and imaginative use of materials in subjects with ASD. Compared with the ADI-R, which estimates current and earlier development of ASDs, the ADOS estimates the current status. In the ADOS, planned social activities are created in which a range of social initiations and responses are likely to appear, and communication opportunities are designed to elicit a range of interchanges. This includes play situations to allow observations of a range of imaginative activities and social role-play. It also provides standard contexts of materials, structured activities, and less structured interactions for understanding ASDs. The ADOS includes four modules which are appropriate for children and adults at different developmental and language levels. The ADI-R and ADOS have long been the gold standard for autism diagnosis.18,19 We also translated and back-translated the ADI-R and ADOS and estimated their validities in Korean children (personal communication, Dr. Y.S. Kim, December 2009).
Scanning procedures
We performed our experiment using a 3-Tesla MRI scanner (MAGNETON Verio, Siemens, Muenchen, Germany). Functional and anatomical images were acquired through different MRI sequences. Functional images were obtained with a gradient echo single-shot echo planar image sequence [repetition time (TR)=2000 ms; echo time (TE)=30 ms; in-plane resolution=3.4×3.4 mm2; slice thickness=3 mm]. After acquiring a functional image, we also scanned a T1 weighted image to acquire an anatomical image with specific scan parameters (TR=1900 ms; TE=2.93 ms; in-plane resolution=1×1 mm2; slice thickness=1 mm). T1 weighted and functional images had the same orientation for better co-registration in three-dimensional space (3D-space).
Experimental design
An auditory discrimination task was used, where subjects had to judge the direction of the presented auditory stimulus. Linear frequency modulated (FM) tones with a duration of 600 ms served as acoustic stimuli. The FM tones differed in direction of frequency modulation (20 upward/ascending, 20 downward/descending) and in center frequency (Fc=1100-3000 Hz in steps of 100 Hz), with starting and ending frequencies calculated by Fc (Hz)±Fc (Hz)/2×Δt (s). A total of 73 FM tones were presented pseudo-randomly in an event-related design with a jittered intertrial interval of 6, 8, and 10 s. At the beginning of each trial, subjects were shown a real facial image (front view) of an unknown male person in color with a neutral facial expression. The same image was used as a control for the whole experiment. After the presentation of this image, which jittered at intervals of 6, 8, and 10 s, subjects were required to judge the direction of acoustic stimuli by pressing the correct button. They were asked to press either the right or left button; however, they needed to guess which one for ascending or descending stimulus at first trial in which they did not receive any cues for the answer. Immediately following the button press, either a positive or negative emotion shown on a real facial image of an unknown female person was presented to allow the subjects to determine whether their response was correct. The image was a frontal view with the hand in either a thumbs-up (in the case of positive emotion in the face) or thumbs-down (negative) position.
Data analysis
Behavior data analysis
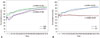
The correct answer was defined as "1," and the wrong answer was defined as "0". From the first trial to the last trial, all correct answers were added to the next trial. These accumulative correct answers were calculated as percentage values. If the accumulative accuracy curve showed an increasing pattern (i.e., the gradient value of the curve was greater than zero by a regression analysis, and the final accuracy was above 50%), it was defined as a learning effect of social reward.
Functional data analysis
Functional data were analyzed using Brain Voyager QX (Brain Innovation B.V., Maastricht, the Netherlands). Anatomical data were preprocessed by a spatial normalization (Talairach transformation). Functional data were preprocessed using slice-timing correction, head-motion correction, and temporal filtering. These functional data were co-registered with each of the normalized anatomical images. We performed an individual analysis of selected subjects in the first step and a group analysis in the subsequent step. The activation map was made by the contrast of all feedback phases >base phase (non-feedback phase). In the group analysis, several brain regions were found using an analysis of variance (ANOVA) with a random effect included in Brain Voyager QX. All regions of interest (ROIs) were selected based on a threshold of p<0.05. Beta values of ROIs were extracted and analyzed using a two-way ANOVA to confirm the statistical significance of all ROIs.
RESULTS
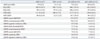
Table 1 showed no significant differences of age, FIQ, and PIQ; however, slightly significant differences of VIQ and SRS scores between the ASDs and TDCs were found (independent t-test, p<0.05). Two ASDs (ASDs with social reward learning effect and ASDs without social reward learning effect) also showed no significant differences of age, FIQ, PIQ, VIQ, SRS scores, and ADI-R scores, except for the ADI-restricted repetitive behavior (RRB) score and ADOS scores (independent t-test, p<0.05).
Behavior results of the subjects
20 children in total showed a social reward learning effect during the social reward task (Fig. 1). 15 children in the ASDs (55.6%) and 5 children in the TDCs (41.7%) showed a social reward learning effect in the behavior result (p<0.001).
Comparison of fMRI results between ASDs and TDCs showing a social reward learning effect
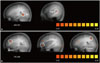
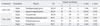
The fMRI results of the 20 children who showed social reward learning effects were analyzed. ASDs with a social reward learning effect showed more increased responses in the right parahippocampal gyrus (PG) [F(1,18)=7.166; p<0.05] and in the right superior temporal gyrus (STG) [F(1,18)=10.622; p<0.01] than TDCs with a social reward learning effect (Fig. 2). On the other hand, TDCs with a social reward learning effect showed significantly more responses than ASDs with a social reward learning effect in several areas, including the right dorsolateral prefrontal cortex (DLPFC) [F(1,18)=5.959; p<0.05], right orbitofrontal cortex (OFC) [F(1,18)=8.834; p<0.01), right parietal lobe [F(1,18)=6.464; p<0.05], and occipital lobe [F(1,18)=7.616; p<0.05] (Fig. 2, Table 2).
DISCUSSION
Our results showed a significant neural difference between ASDs and TDCs with a social reward learning effect. Among the involved brain areas, the DLPFC, OFC, and parietal lobe are known as the socially-related brain areas. However, the PG and STG are related to the perception of an emotional face.4,6 The DLPFC plays a crucial role in the integration of goals and the reward system. The weak responses of the DLPFC in ASDs suggest that ASDs might show an abnormality of executive function in dealing with social tasks. This would mean that those with ASD have difficulty in regulating their activities and determining their goals. The OFC is also a well-known area involved in sensory integration and reward-related behaviors.11,20 Additionally, the parietal lobe is also involved in the integration of different stimuli; however, the fundamental roles of this area are action prediction, planning, observation, and execution.21 Therefore, the reduced responses of the OFC and parietal lobe might be associated with a dysfunction of the social reward learning process in ASDs. This would mean that those with ASD use a different strategy of reward system during the social learning task compared to TDCs.
Interestingly, the ASDs showed more activation of the STG and PG. The STG is the brain area primarily responsible for perceiving emotional faces,4 processing eye-gaze,22 and detecting novel sounds.23 The increased response of the STG suggests that those with ASD are more sensitive than TDCs during the performance of a task. This is consistent with the findings of a previous study, which showed more activation in the left STG in the ASDs than in the TDCs during a sentence comprehension task.24 The PG is involved in the involuntary reactivation of the contextual fear memory that results in avoidance25 and is also a part of the limbic system, which was mentioned as a socially-related area of the brain.26 The hyper-activation of the PG is related to abnormal responses to social feedback. This dysfunction was reported in a previous study, which showed stronger connectivity of the STG and PG in ASDs than in TDCs.9 We found that the ASDs and the TDCs used different neural systems during the social reward learning task, and these neural mechanisms might reflect fundamental neurobiological changes in the brains of the subjects.
This study still has several potential limitations. The first is that we used a small sample size. Although every single subject fully practiced the task before the scanning procedure, they showed some difficulty in paying attention constantly during the actual scanning procedure. Some children complained that they had not understood the rules of the task due to confusion when pressing buttons after the beep sound. These problems made the subjects move and perform poorly during the task. The second limitation is related to the type of subjects observed. We used only high-functioning ASDs for this study, as lower-functioning ASDs with intellectual disabilities could not perform and understand social reward learning tasks. Therefore, our results cannot be generalized to all ASDs. We will need to specifically observe the various types of ASDs in future fMRI research with a much simpler task.
Despite these limitations, there still are novel findings in our investigation related to the neural mechanism of high-functioning ASDs. To the best of our knowledge, this is the first fMRI study investigating a neural mechanism in the social reward learning system of Asian ASDs. These results could be used as a biomarker of high-functioning ASDs. In addition, this study is also valuable due to its focus on young children with high-functioning ASDs. Although this report does not include a cross-cultural comparison, it provides a first step toward understanding the neural mechanism of the social reward system in children with ASD.
In conclusion, we found that there might be a neural abnormality of the social reward learning system in ASDs. Despite several limitations, our study presented novel findings in terms of the differences of the neural mechanism between ASDs and TDCs with a social learning effect and a potential useful biomarker of high-functioning children with ASD.
 XML Download