

 PDF
PDF ePub
ePub Citation
 Print
Print


INTRODUCTION
The incidence of end-stage renal disease (ESRD) is increasing worldwide, and Korea is one of the countries with a relatively high incidence.1 Although kidney transplantation is the definitive treatment for ESRD, most patients rely on hemodialysis (HD) or peritoneal dialysis (PD) due to a lack of organ donors or individual medical problems. Therefore, the population on maintenance dialysis continues to grow.
When initiating dialysis therapy in ESRD, clinicians should consider the patient's medical problems, barriers to treatment, geographic location, and survival benefits.2 It is most important to consider which modality confers improved survival or quality of life for each patient. However, the results of many previous studies that have compared survival by dialysis modality vary widely.2,3,4,5,6,7,8,9,10,11,12,13,14,15,16
We recently performed a study comparing survival between HD and PD patients initiating dialysis from 2005 to 2008 using population-based, large-scale Korean registry data. Data revealed overall higher survival rates in incident HD patients compared to incident PD patients.17 A subgroup analysis indicated that the survival rate likely improved during the study period. Given this flux of survival rates, the most up-to-date results are helpful to predict the current status. Therefore, in this study, we investigated whether the survival rate among Korean dialysis patients significantly changed during the period between 2005 and 2008. In addition, we evaluated the effect of dialysis modality on the survival rate of patients initiating dialysis in 2008.
MATERIALS AND METHODS
Data source and study population
In South Korea, all citizens are required by law to join the Healthcare Security System, which is divided by income level into National Health Insurance and Medical Aid. All claims of medical fees by medical care institutions are reviewed by the Health Insurance Review and Assessment Service (HIRA) and the National Health Insurance Claims Database. In receiving access to these sources of data, we were able to review the data of every patient with ESRD who visited a medical clinic in Korea and began renal replacement therapy.
We initially identified all incident ESRD patients who initiated dialysis between January 1, 2005 and December 31, 2008, using detailed methods described elsewhere.17 Among patients, those who were younger than 18 years or who survived for less than 90 days from the date of dialysis initiation were excluded. Patients who received kidney transplantation were censored. The end-point, time of death, was confirmed by the Certificate Database, which records the reasons for changes in eligibility for National Health Insurance or Medical Aid, including death or emigration, as well as by the National Health Insurance Claims Database. The patients included in this study were followed up to 4 years according to the year of dialysis initiation. The list of analyzed comorbidities was determined based on the suggestions by Charlson, et al.,18 and patients were divided into four groups [grade 0 (no comorbidity), grades 1-2 (mild), grades 3-4 (moderate), and grade 5 or higher (severe)] according to the modified Charlson Comorbidity Index for ESRD patients.19 International Classification of Diseases, Tenth Revision codes were used according to the proposed algorithms by Quan, et al.20
Statistical analyses
Statistical analysis was performed using SPSS software for Windows, version 16.0 (SPSS Inc., Chicago, IL, USA). All data are expressed as mean±SD or number (percent) unless otherwise specified. p-values<0.05 were considered statistically significant.
We compared patient characteristics according to the year they initiated dialysis from 2005 to 2008 by analysis of variance for continuous variables or the chi-square test for categorical variables. Kaplan-Meier survival curves were calculated, and the log-rank test was used to compare unadjusted survival rates. In addition, we constructed life tables to estimate the cumulative proportion of survivors at the end of every 1-year interval during the follow-up period. Proportionality was visually confirmed by log-minus-log plot. Cox proportional hazard analysis identified independent predictors of mortality. Significant variables in univariate analyses were included in multivariate analysis, and a threshold of 0.10 was set for retention. In the analysis of outcomes according to dialysis modality, we adopted the intention-to-treat model based on the type of renal replacement therapy at 90 days after dialysis initiation.
RESULTS
Comparison of baseline characteristics according to the year of dialysis initiation
A total of 32357 patients who began dialysis were eligible for analysis. Mean age was 57.3±14.0 years, 58.7% of patients were males, and 50.1% of patients had diabetes.
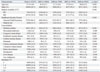
The comparison of baseline characteristics among the entire study cohort (2005-2008) according to the year of dialysis initiation revealed significant differences. From 2005 to 2008, the mean age and the proportion of patients with a higher modified Charlson Comorbidity Index significantly and gradually increased, whereas the proportion of PD patients and Medical Aid beneficiaries significantly decreased.
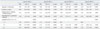
The median follow-up duration was 39.3 months (range: 3.0-48.0 months). A detailed description of the baseline characteristics of patients stratified according to the year of dialysis initiation is shown in Table 1.
Although we adopted the intention-to-treat model, we could also calculate the crude incidence rate of technique failure for all patients, which was 15 per 1000 patient-years. When comparing between HD and PD treatment types, the crude incidence rate of technique failure was higher in patients on PD (54 per 1000 patient-years) than in those on HD (3 per 1000 patient-years).
Comparison of survival rates according to the year of dialysis initiation
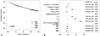
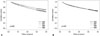
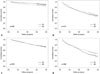
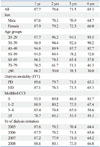
The life table (Table 2) showed that the survival rate was likely to have improved among patients initiating dialysis in 2008 compared to those in 2005. This was also evident in Kaplan-Meier curves according to the year of dialysis initiation (Fig. 1A), where the survival rate was significantly different by log-rank test (p=0.005). Furthermore, the year of dialysis initiation was a significant independent factor for mortality in multivariate Cox analysis (Fig. 1B). Of note, the improvement in the survival rate across the years of dialysis initiation was significant among PD patients (p<0.001), although not among HD patients (p=0.497) (Fig. 2). In subsequent subgroup multivariate analysis, however, patients initiating either HD or PD in 2008 had a significantly lower risk of mortality than those who began dialysis in 2005 (Fig. 3A). In addition, when we stratified patients by age categories and diabetes, there were no significant differences across the years of dialysis initiation only among non-diabetic patients less than age 65, whereas statistically significant differences were consistently observed in the other three subgroups (Fig. 3B).
Comparison of survival rates between PD and HD patients initiating dialysis in 2008
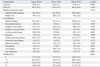
In 2008, a total of 8565 patients who began dialysis were eligible for analysis. Detailed baseline characteristics according to dialysis modality are presented in Table 3.
We initially analyzed all patients initiating dialysis between January 1, 2005 and December 31, 2008; detailed survival outcomes of the entire study period (2005-2008) are described elsewhere.17 Kaplan-Meier survival analysis of the entire cohort did not meet the proportional hazard assumption; thus, a more sophisticated analysis was needed, such as propensity score matching.
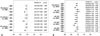
However, in a subgroup of patients initiating dialysis in 2008, the proportional hazard assumption was thought to be satisfied in the log-minus-log curve. Therefore, we performed survival analysis among patients initiating dialysis in 2008 and found that PD patients had a significantly better survival rate than HD patients (log-rank test, p=0.001) (Fig. 4A). In addition, we identified independent prognostic factors in multivariate Cox analysis (Fig. 4B). The following characteristics were significant independent predictors of mortality: age [per 1-year increase, hazard ratio (HR) 1.05, 95% confidence interval (CI) 1.05-1.06, p<0.001], female sex (vs. male, HR 0.85, 95% CI 0.78-0.92, p<0.001), Medical Aid (vs. National Health Insurance, HR 1.71, 95% CI 1.53-1.90, p<0.001), and modified Charlson Comorbidity Index (grades 1-2 vs. grade 0, HR 1.57, 95% CI 1.37-1.79, p<0.001; grades 3-4 vs. grade 0, HR 1.98, 95% CI 1.73-2.26, p<0.001; grade 5 or higher vs. grade 0, HR 2.67, 95% CI 2.32-3.06, p<0.001). However, dialysis modality was not an independent predictor of mortality (HD vs. PD, HR 0.91, 95% CI 0.82-1.00, p=0.052).
Subgroup analyses according to age categories and diabetes among patients initiating dialysis in 2008
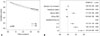
We divided patients into four subgroups according to age categories (<65 years or ≥65 years) and presence of diabetes and found that survival curves by Kaplan-Meier analysis differed among subgroups (Fig. 5). In non-diabetic patients aged less than 65, the survival rate was significantly higher among PD patients than among HD patients (p<0.001). In contrast, in diabetic patients aged 65 or older, the survival rate was significantly lower among PD patients than among HD patients (p=0.004). Among both diabetic patients aged less than 65 and non-diabetic patients aged 65 or older, the survival rates were not significantly different between PD and HD patients (p=0.974 and p=0.377, respectively).
The results of the subgroup multivariate Cox analysis are presented in Table 4. Age, type of Healthcare Security System, and modified Charlson Comorbidity Index were significant independent predictors for mortality in all subgroups, while the ability of dialysis modality to predict mortality differed according to age categories and presence of diabetes. Non-diabetic patients younger than 65 years receiving HD showed an increased mortality risk compared to PD patients (HR 1.49, 95% CI 1.13-1.98, p=0.005). However, among patients aged 65 years or older, PD was consistently associated with higher mortality than HD (in non-diabetic patients, HR 0.80, 95% CI 0.64-0.98, p=0.035; in diabetic patients, HR 0.76, 95% CI 0.64-0.90, p=0.002). Among diabetic patients less than 65 years, there was no significant difference between the two groups (HR 0.93, 95% CI 0.78-1.11, p=0.426).
DISCUSSION
In this study, we observed significant changes in the survival rate according to the dialysis initiation year between 2005 and 2008. The survival rate among Korean dialysis patients initiating dialysis improved from 2005 to 2008, most notably among PD patients. The survival rate of HD patients who started dialysis in 2008 also increased from 2005, as shown by multivariate analysis.
A number of factors may underlie the differences in the survival rate according to the dialysis initiation year. First, selection bias may be present if healthier patients were selected more often to begin PD in 2008 than in 2005. Indeed, baseline patient characteristics were significantly different according to the year of dialysis initiation. Although the number of patients who initiated dialysis increased during the study period, the proportion of PD patients decreased. From 2005 to 2008, the proportion of Medical Aid beneficiaries decreased, which would be a positive factor for the survival rate. However, the proportion of older patients and those with more comorbidities increased, which likely worsened clinical outcomes. Notably, however, the significant difference in the survival rate by dialysis initiation year persisted in multivariate analysis, which was adjusted for all baseline covariates. Nonetheless, other potentially confounding clinical factors may have affected survival rates, including residual renal function, anemia status, critical laboratory values, biomarkers of inflammation, and nutrition.
Second, the use of low-glucose degradation product (low-GDP) PD solutions increased from 2005 to 2008 in Korea. Although we could not obtain data on individual use from the HIRA database, an informal report from a major PD company on market shares in Korea indicated that 27% of patients initiating PD were prescribed low-GDP dialysate in 2005, which increased yearly to over 50% of patients in 2008. Another company reported that 75% of prescriptions were for low-GDP dialysate in 2005, increasing to 93% in 2008. Many studies have proposed that the use of biocompatible low-GDP PD dialysate is correlated with the preservation and longevity of the peritoneal membrane.21,22 Although significant survival benefit was not observed with the use of biocompatible PD solutions in a meta-analysis,23 it still likely to be beneficial to some specific patients due to ethnic or environmental differences. Further research is warranted to track ongoing changes in survival rates since 2008.
Third, more frequent use of icodextrin as a substitute for high glucose PD solution could be another explanation, as icodextrin prescription is known to be associated with increased peritoneal ultrafiltration and mitigated uncontrolled fluid overload.23 However, it should be noted that icodextrin also did not induce a significant improvement in the survival rate of PD patients.23
Last, reduction in occurrence of peritonitis, increased clinical experience for PD, and more proactive participation of patients in PD treatment are other possible causes for improved survival among PD patients.
Subgroup analyses of patients initiating dialysis in 2008 showed that the survival rate of PD patients was higher than HD patients among non-diabetic patients younger than 65. In our previous report of all patients from 2005 to 2008,17 the mortality rate in patients aged 55 years or older was consistently higher in PD patients than in HD patients, with the exception of patients with malignancy and patients without any listed comorbidities. The study also found no significant difference in mortality rates between HD and PD patients younger than 55. In contrast, the present study found a 49% increase in the mortality rate of HD patients compared to PD patients among non-diabetic patients younger than 65. A recent comprehensive review based on the results from six large-scale registry studies and three prospective cohort studies conducted in the US, Canada, Denmark, and the Netherlands suggested that PD was commonly associated with equal or better survival in younger patients.2,12,13,24,25,26,27,28,29,30
However, in contrast to most published studies, we found no time-dependent risk changes between PD and HD patients in this study. In a previous report, the survival benefit of PD lessened over time.30 Another study found that the survival benefit of initiating PD in non-diabetic younger patients became a PD-related mortality factor during the follow-up period.14 Registry data from Australia and New Zealand suggest that PD may be advantageous initially in patients younger than 60 without comorbidities, yet may be associated with higher mortality after 12 months.16 This is likely due to significant differences in the mortality patterns of dialysis patients according to racial or ethnic group.31,32 Taken together, these data suggest that choosing PD as an initial dialysis modality may improve survival in younger non-diabetic patients, as long as the current selection criteria for dialysis modality are maintained in Korea.
We also identified prognostic predictors among eligible baseline characteristics. In agreement with our previous report,17 age was a significant risk factor across all subgroups. In addition, although sex has not been considered as a risk factor for death in Korean patients with ESRD,33 female sex was associated with decreased mortality in this study. In regard to baseline comorbidities, the impact of comorbidities on mortality was highest in younger non-diabetic patients, although statistically significant in all subgroups. In addition, Medical Aid patients had higher mortality compared to National Health Insurance patients in all groups. Low sodecioeconomic status is known to be a risk factor for mortality in ESRD patients on HD.34 Although we could not obtain detailed data, the type of Healthcare Security System might be used as a rough estimate of each patient's socioeconomic status, as only patients with lower income and less property can become beneficiaries of Medical Aid.
As with other registry-based studies, this study has some inherent limitations. First, the non-random assignment of patients to dialysis modality likely introduced indication bias. Therefore, we could not provide causality for the improvement in the survival rate during the study period and for the effect of dialysis modality on mortality among patients initiating dialysis in 2008. Second, the databases used in this study provided insufficient clinical information and no specific laboratory data. This prevented the use of numerous clinical variables in our analysis, including etiology of ESRD, residual renal function, dialysis duration, dialysis adequacy, cause of death, catheter used in HD, nutritional status, and laboratory data. These unmeasured variables have definite effects on mortality.
In spite of these limitations, the results of this study clearly indicate the current status of dialysis therapy in Korea and provide data on the changing practice patterns for ESRD patients initiating dialysis.
In conclusion, our data showed that the survival rate of Korean patients initiating dialysis has improved over time, particularly in PD patients. Furthermore, survival rates among patients initiating dialysis in 2008 were different according to age and the presence of diabetes; thus, these factors need to be considered when choosing the dialysis modality. We propose our conclusions as an individualization strategy for the appropriate selection of dialysis modality according to baseline characteristics.
 XML Download