

 PDF
PDF ePub
ePub Citation
 Print
Print


INTRODUCTION
Pulse wave velocity (PWV), a measure of arterial stiffness, is a strong predictor of cardiovascular mortality and morbidity and can be measured by various techniques, including peripheral tonometry, Doppler ultrasound, and catheter-tip manometer.1,2,3 The peripheral tonometry method, which is easy to perform and is non-invasive, has been widely used as a screen for arterial stiffness and vascular damage.4,5 Among a variety of peripheral PWV measures, carotid-femoral PWV (CF-PWV) by tonometry has been the most frequently used and studied to date. CF-PWV is well correlated with aortic PWV obtained using a catheter-tip manometer and is significantly higher in individuals who have cardiovascular risk factors.4,6 Nevertheless, CF-PWV has not been fully included in routine clinical use because the transducer used has to be attached with constant pressure on target arteries and carefully adjusted to obtain an accurate pulse wave. Thus, it can be technically complex and inconvenient for routine clinical examinations. Additionally, exposure of the inguinal area during acquisition of the femoral pressure waveform can be psychologically invasive for some patients.
Brachial-ankle PWV (BA-PWV), developed mainly in Japan, is an easier method of measuring arterial stiffness.7,8 This simple method measures PWV by recording pulse waveforms from an oscillometric sensor attached to a blood pressure cuff. The potential benefits of BA-PWV screening for vascular damage, especially for outpatients, include its safety, technical simplicity, and short sampling time. However, there is a paucity of data supporting the validity and reliability of BA-PWV. Although a few studies have reported the validity of BA-PWV by comparing it with the catheter-tip manometer method, the number of participants in those studies was too small to draw definite conclusions.9
In the present study, we evaluated the usefulness and reliability of the BA-PWV method to measure aortic stiffness in comparison to cardiovascular magnetic resonance (CMR), a validated, noninvasive method for assessing PWV and distensibility.10,11,12 To our knowledge, this is the first study to directly demonstrate a correlation between the BA-PWV and central aortic stiffness by conducting CMR and peripheral vascular device measurements simultaneously in a large, normal population.
MATERIALS AND METHODS
Study participants
The present clinical investigation was designed to include a minimum of ten participants per sex and age decade. A total of 124 participants (63 women and 61 men) between the ages of 20 and 70 years were enrolled from February 2010 to May 2011. All participants were informed of the study protocol and provided written consent. The local Institutional Review Board approved this study.
To reduce confounding factors influencing aortic stiffness, we did not select participants who had cardiovascular risk factors, including hypertension and diabetes, or cardiovascular disease, including old myocardial infarctions, valve disease, and congenital heart disease. All participants had no history or symptoms of peripheral artery disease and had normal ankle-brachial pressure index values. Additionally, participants were excluded from the study if the PWV or distensibility measurements were unavailable due to poor MR imaging. Baseline brachial blood pressure, height, and weight were recorded for all participants.
Measurement of pulse wave velocity
In each participant, PWV values were simultaneously measured using a vascular testing device (Colin, Komaki, Japan). After participants had rested in a supine position for >5 minutes, bilateral brachial and posterior tibial artery pressure waveforms were stored for 10 seconds by an extremity cuff connected to an oscillometric pressure sensor, wrapped around both arms and ankles. Additionally, carotid and femoral arterial pressure waveforms were detected by applanation tonometry sensors attached to the left common carotid artery and left common femoral artery. The distance between the two sampling points was calculated from each participant's height, and the transit time was automatically determined from the time delay between the proximal and distal waveforms.13,14 The PWV was calculated from the distance between the two arterial recording sites divided by the transit time. We obtained the mean BA-PWV from right and left brachial and ankle measurements.
Magnetic resonance imaging and analysis
CMR was performed using a 1.5 Tesla scanner (Magnetom Avanto, Syngo MR; Siemens Medical Solutions, Erlangen, Germany) on the same day BA-PWV was obtained. Axial localizer images were used to visualize the position of the ascending and descending aorta. Black blood spine echo sequences were acquired in an oblique sagittal orientation to demonstrate the full length of the aorta. Three plane localizer images were obtained to identify the ascending and descending aortas through the bifurcation. The level of the ascending aorta was determined at the distal 4 cm of the aortic valve, and the upper descending thoracic aorta was determined at the level of the bifurcation of the pulmonary artery. The lower descending thoracic aorta was obtained at the level of the diaphragm and the abdominal aorta was determined just above the iliac bifurcation (Fig. 1A). All image planes were determined as the plane perpendicular to the longitudinal axis of the aorta. After acquisition of a series of thoracic survey images that were used for planning purposes, four consecutive velocity-encoded MR image acquisitions were performed with breath hold and retrospective gating. The maximal encoding velocity was 200 cm/s and the temporal resolution was 30-40 frames/beat. Cine imaging was also performed at the same level of encoded MR imaging for aortic stiffness. Total acquisition time was approximately 20 minutes. Before and after the scanning of each aortic level, non-invasive blood pressure monitoring at the brachial artery was performed and the average of the measurements was used for calculation of regional aortic distensibility.
Analyses of MR images were performed using Argus version 4.02 software (Siemens Medical Systems, Germany) by experienced observers who were blinded to patient information. From the velocity encoded MR images, aortic contours were automatically detected and manually adjusted in each slice area through the cardiac cycle. The transit time between flow curves of each region of the aorta was determined from the midpoint of the systolic up-slope on the flow versus time curves.15 The up-sloping edges were identified by the line connecting the points at 40-60% of the maximum velocity in the waveform. The distance between each aortic level was measured on black blood images using a curved line along the center of the aorta. Based on these data, regional PWV was calculated as the ratio of distance between levels and time differences between arrivals of the pulse wave at these levels. Consequently, the PWV of the entire aorta were determined, as well as in three segments of the aorta. Representations of flow curves and measurement of the distance are shown in Fig. 1B, C, and D.
For measuring regional distensibility, systolic and diastolic cross-sectional areas were measured by manual contouring of the aorta through the cardiac cycle in the cine image. Distensibility (D) at four regions was calculated by means of the following equation: D=(Amax-Amin)/[Amin×(Pmax-Pmin)] (mm Hg-1), where Amax is the maximal (systolic) aortic area, Amin is the minimal (diastolic) aortic area, Pmax is the systolic blood pressure, and Pmin is the diastolic blood pressure.
Statistical analysis
All statistical analyses were performed using the PASW software, version 18.0 (SPSS Inc., Chicago, IL, USA). Continuous variables are expressed as the mean±standard deviation (SD) or the median and interquartile range. The relationship between age and aortic parameters was studied using linear regression models. The approach described by Bland and Altman was followed to study systematic differences between techniques. Technical agreement of both methods was quantified using intraclass correlation coefficient (ICC). The threshold for statistical significance was chosen to be p=0.05.
RESULTS
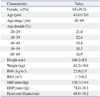
The participant characteristics, including hemodynamic measurements, are presented in Table 1. The mean age was 43±13 years, ranging from 20 to 70 years. All participants were normotensive and had a normal body mass index and heart rate.
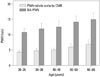
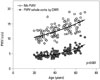
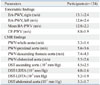
The peripheral PWV and aortic stiffness parameters, as measured by CMR, are given in Table 2. On average, the mean BA-PWV was approximately 45% higher than CF-PWV (12.8±2.3 m/s vs. 8.8±1.9 m/s, p<0.001). Compared to the PWV measured by CMR, BA-PWV values were significantly higher and the differences therein were similar in all age groups (all p<0.001) (Fig. 2). Both the BA-PWV and the PWV by CMR were significantly and positively correlated with age (r=0.652 and 0.724, p<0.001) (Fig. 3). In all age decades, BA-PWV level was higher in male compared with female (mean BA-PWV; 13.4±2.0 m/s vs. 12.3±2.6 m/s, p=0.009).
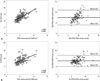
As demonstrated in Fig. 4A, there was a significant correlation between the BA-PWV and PWV through the whole aorta by CMR (r=0.697, p<0.001). In the Bland-Altman plots of the BA-PWV and aortic PWV by CMR, the majority of the values ranged within a mean±2 SD. In reliability analysis, the ICC demonstrated strong agreement between the two measurements of the PWV [ICC=0.730 (0.615-0.811), p<0.001]. As with the BA-PWV value, CF-PWV demonstrated a good correlation (r=0.536, p<0.001) and agreement [ICC=0.626 (0.467-0.738), p<0.001] with the PWV by CMR (Fig. 4B).
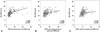
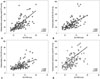
In all the segmental regions of the aorta, as measured by CMR, the PWV value was well correlated with the BA-PWV in a linear fashion (r=0.418 to 0.588, all p<0.001) (Fig. 5). The reciprocal of the aortic distensibility had a statistically significant positive correlation with BA-PWV (r=0.583 to 0.673, all p<0.001) (Fig. 6).
Considering that CF-PWV has been widely used and proposed as a guideline for predicting and treating cardiovascular disease, we additionally analyzed the degree of difference of correlation with the CMR PWV between the BA-PWV and CF-PWV using Fisher's r to z transformation method (Table 3). In comparison to CF-PWV, BA-PWV was more strongly correlated with PWV through the whole aorta (r=0.696 vs. r=0.529, z=2.11, p<0.03). Both BA-PWV and CF-PWV demonstrated good correlation with aortic distensibility and regional aortic PWV, and the level of correlation was not statistically different (p≥0.05).
DISCUSSION
In the present study, we investigated the reliability of BA-PWV as an effective screening method for determining arterial stiffness in comparison to using CMR in participants without cardiovascular risk factors. There was a significant, strong correlation between the BA-PWV and central aortic PWV by CMR regardless of age and sex in the pooled sample. In comparison with PWV through the whole-aorta by CMR, BA-PWV demonstrated a superior correlation than CF-PWV. These findings suggest that BA-PWV may provide qualitatively similar data, compared to those derived from aortic PWV, a well-established index of central arterial stiffness.
In accordance with our data, Yamashina, et al.9 reported the validity of BA-PWV using catheter-tip manometer method. However, they showed correlation of BA-PWV and catheter derived-PWV only in the patients with coronary artery disease, and the number of participants was too small to draw definite conclusions. Demonstrating BA-PWV values in individuals without risk factors and the relatively large number of enrolled subjects are strengths of our study.
On average, BA-PWV was highest among other PWV values, including CMR-PWV, in the current study. The regression line obtained in the present study revealed that a BA-PWV value of 13.5 m/s is slightly higher than the threshold value of 10 m/s for CF-PWV proposed by the European Society of Hypertension and the European Society of Cardiology.16 In previous Japanese data that demonstrated a correlation between CF-PWV and BA-PWV, mean BA-PWV was about 14.8 m/s, which was comparable with our data. These findings might be explained by the fact that some portions of BA-PWV may be determined by peripheral arterial stiffness.17,18 Considering there are no worldwide guidelines for BA-PWV, our data and previous Japanese data may suggest a normal cut-off value for BA-PWV.
Further, our study demonstrated a close correlation between the BA-PWV and regional aortic distensibility, which provides information on arterial elasticity at the measured site. Some investigators have reported that the difference in vascular wall composition between muscular arteries (e.g., brachial artery) and elastic arteries (e.g., aorta) may lead to a different response of arterial stiffness.19,20 These data indicate that BA-PWV may not be accurate and may not reflect central aortic stiffness. However, in agreement with the current results, several small-scale studies have found that BA-PWV is more closely associated with central artery stiffness than PWV obtained from invasive measurements using catheter-tip manometers and CF-PWV by noninvasive methods.9,13,21
Ideally, to confirm the objective validity of BA-PWV, it should be compared with PWV obtained by the catheter method using a catheter tip manometer in the aorta, brachium, and ankle. However, this procedure is too invasive and risky to use in healthy participants. Therefore, we utilized CMR to determine the correlation between BA-PWV and central aortic stiffness. Currently, CMR is considered well suited to comprehensively evaluate aortic stiffness.10,11,12 Because calculation of the aortic stiffness using CMR has been suggested as the most appropriate technique to directly and noninvasively measure intra-aortic path length of pulse waves, it is thought to be free from operator bias. Regional aortic distensibility can also be measured by comparing the systolic and diastolic areas of the aorta in cine imaging.
Study limitations
This study was performed only in Korean participants, an ethnically homogeneous nation. Moreover, BA-PWV and PWV by CMR were not directly compared in patients with different stages of organ damage or other cardiovascular risk factors. To implement the use of BA-PWV more widely into clinical practice for arterial stiffness evaluation, BA-PWV values in patients with cardiovascular disease and the extent of vascular damage must be determined. Nevertheless, this study used a relatively large, population-based analysis to identify the correlation between BA-PWV and central aortic stiffness by conducting both peripheral PWV and CMR stiffness exams simultaneously, which increases our confidence in the results. Further cohort studies with a larger number of patients with underlying disease and increased cardiovascular risk factors are needed to confirm the clinical significance of BA-PWV.
In conclusion, BA-PWV was well correlated with central aortic PWV and distensibility, as measured by CMR, regardless of age and sex, in participants without cardiovascular risk factors. The technical simplicity, low cost, and noninvasiveness make BA-PWV measurement suitable for screening arterial stiffness and vascular damage in large populations, especially in outpatient settings. Further studies of various ethnic groups with underlying diseases and increased cardiovascular risk factors are needed to determine the degree of clinical significance of BA-PWV.


 XML Download