

 PDF
PDF ePub
ePub Citation
 Print
Print


INTRODUCTION
Ideas of specialty hospitals was first introduced in a few states in the U.S. from the 1990s where the hospitals were located in rapidly growing urban areas and states which did not require a certificate of need.1 Small hospitals specialized in cardiac, orthopedic, and surgical services were rapidly increased,2 and most of the hospitals were for-profit, physician-owned, and focused only on their specialties.3
Proponents argue that lower cost with high quality medical services were associated with specialty hospitals,456 and specialty hospitals can offer efficient, specialized medical services, and high quality services,4 due to their characteristics so-called "focused factories," new value to healthcare system,78 and better patient satisfaction.910 Accumulated experiences could leads better outcomes in their specialty area, which also be great asset for maximizing efficiency.11 In other hands, opponents assert that specialty hospitals may not associated with good quality and lower costs due to their provision of services that focuses on only profitable type of services, cherry-pick patients who are healthier and more profitable and induces demand for patients in their specialty.112131415
Since South Korea initiated a universal health insurance program in 1989, hospitals have undergone dramatic challenges. These challenges occurred by various policy initiatives and physicians' distortion for the input mix of treatment to increase margin,16 had increased competitions by providers, and requirements for efficiency.17 Financial challenges also charged to providers,17 because of great numbers of small general hospitals were increased, from 581 in 2000 to 1064 in 2008.18 In order to overcome such challenges, small hospitals needed changes and started to be specialized in certain area to better compete with other small, general hospitals.19
In November first, 2011, the Ministry of Health-Welfare of Korea designated 92 hospitals as "specialty hospitals" to vitalize financial condition and to promote splendid small general hospitals. A total of 18 specialty areas were designated, including colorectal-anal; spine; joint; heart; burn; ophthalmology; breast; ear, nose, and throat (ENT); alcohol; obstetrics and gynecology (OBGYN); neurosurgery; and rehabilitation, among others.
Each hospital supposed to submit an application to government for designation. In the application they need to be equipped with certain hospital structures including number of specialty physicians, beds, and medical departments that are associated with their specialty area. Furthermore, their number of inpatients should be included top 30th percentile among all general hospitals excluding tertiary university hospitals, and their specialty area inpatients should be above percentage guided by government which is various for each specialty area.20
As noted, the pros and cons of specialty hospitals have investigated in previous studies2122232425 and public awareness had been increased;262728 the impact of specialty hospitals on the inpatient charges, costs, their quality and relationship with neighboring hospitals has been researched. To date, however, few studies have addressed and evaluated inpatient charges, efficiency, length of stay (LOS) of specialty hospitals outside the United States,202930 and no evidence has been found, especially for colorectal-anal specialty hospitals.
Therefore, aim of this study is to investigate the characteristics and performance of colorectal-anal specialty hospitals in South Korea where national health insurance program play a significant role for healthcare delivery system. In South Korea, a government agency designates only qualified candidates as colorectal-anal specialty hospitals, in contrast to the spontaneous development of physician owned specialty hospitals in the United States.
MATERIALS AND METHODS
Database and data collection
In order to investigate the effect of designating colorectal-anal specialty hospitals and to characterize their performance, information on all nationwide inpatients diagnosed with colorectal-anal related diseases and admitted to specialty or general hospitals were obtained. This dataset contains details that included the patient's age, gender, severity of illness, disease diagnosis, inpatient charge, date of admission, other discharge information, etc. Severity of illness is measured using the complication and comorbidity level (CCL) [0=patient does not have a complication or comorbidity (CC), 1=patient has a minor CC, 2=patient has a moderate CC, 3=patient has a severe CC]. In order to avoid seasonal effects, we obtained dataset during the 7 months (11.01.2011-05.31.2012) after the government's first designation of specialty hospitals on November 1, 2011 and dataset of same 7-months (11.01.2010-05.31.2011) one year earlier.
Korean hospitals are mainly categorized into three categories based on bed size: 1) hospitals with over 1000 beds: tertiary research university hospitals, 2) hospitals with 300-1000 beds: mid-sized general hospitals, and 3) hospitals with 100-300 beds: small general hospitals. Both the specialty hospitals and the small general hospitals in our study fell within category 3, based on the Hospital Management Statistics provided by the Korean Hospital Association (KHA).31 The higher the hospital categorization, the higher the fee for service (FFS) schedule applied.
The hospital reimbursement system in South Korea is predominantly FFS based for colorectal-anal disease, and it is used in all three categories of hospitals. Inpatient charges were measured as a sum of FFS claims from each patient's hospitalization. Inpatient charge claims are not the same as costs; however, claims represent costs from the perspective of the purchaser, which is the National Health Insurance Service (NHIS) of Korea.32
Treatments for colorectal-anal related diseases include surgical procedures (rectal resection, small bowel resection, colectomy, congenital megacolon & intestinal atresia, anorectal malformation, enterostomy, other small & large bowel procedures, and anal & perianal procedures) and medical procedures [digestive malignancy, gastrointestinal (G.I.) hemorrhage, inflammatory bowel diseases, G.I. obstruction, abdominal pain or mesenteric adenitis, and other digestive system diagnoses] that serve as disease categories for colorectal-anal specialty hospital designation. Because the purpose of this study was to investigate inpatient charges and LOS at colorectal-anal specialty hospitals and other, non-specialty hospitals that provide colorectal-anal related medical services, approximately 1500 hospitals that had more than one colorectal-anal related inpatient case were included in the final database.
Patients claim data were matched to hospital to which each patient was admitted. Hospital-level data included status of specialty hospital designation, number of beds, specialists, nurses per 100 beds, teaching status, the hospital geographic region, and bed occupancy rate.
In terms of FFS schedule, we discounted 2012 inpatient charges to 2010-2011 levels (FFS catalogue increased by 1.9% in 2012, but no increase in 2010 and 2011). A total of 292158 inpatients were hospitalized for colorectal-anal related illnesses nationwide during the study period, and a total of 861 hospitals were included in our analysis.
Analytic approach
In order to have descriptive statics for continuous and categorical variables, one-way analysis of variance and chi-square tests were performed. Multivariate analysis was performed to investigate the characteristics of specialty hospitals, including the inpatient charge per case, inpatient charge per day, and LOS, after adjusting for both patient and hospital variables. This study utilized multi-level, random-effect linear mixed regression models as Hamada, et al.33 used because of overestimation of significance and avoiding correlation within hospital clusters. We also included the type of procedures in the model in order to enhance the ability to adjust for case mix. In this study, we have distribution of skewed dependent variables (inpatient charges and LOS), we applied the log transformation. Finally, this study used SAS 9.3 (SAS institute, Cary, NC, USA) for all calculations and analyses.
RESULTS
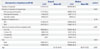
A total of 292158 inpatients were included in this study, 31618 (10.9%) of whom had undergone surgical procedures and 260540 (89.1%) of whom had medical procedures (Table 1). Of those who had surgical procedures, 6309 (20.0%) went to colorectal-anal specialty hospitals, although only 8839 (3.4%) medical patients were admitted to colorectal-anal specialty hospitals. The volume of inpatients was greater among males, patients with lowest CCL score (CCL=0), and in the year 2012. Average age was higher among patients who had medical procedures (52.5 vs. 56.2).
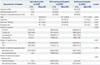
Table 2 shows the hospital characteristics where patients were admitted in this study. Total 861 hospitals included in this study, only three colorectal-anal specialty hospitals were designated by the Ministry of Health-Welfare. These three specialty hospitals (0.3% of the total) accounted for 20.0% of the total colorectal-anal surgical procedures performed nationwide. None was a teaching hospital (there was a total of 107 teaching hospitals), and all were located in metropolitan areas (there was a total of 443 metropolitan hospitals). Overall, structural factor metrics (number of beds, specialists, nurses per 100 beds, and outpatients, as well as bed occupancy rate) were somewhat higher in specialty hospitals, with an exception of bed number, which was lower in the specialty hospitals. The specialists, nurses per 100 beds, numbers of beds, and outpatients were about two times greater in specialty hospitals (p<0.001). Bed occupancy rate was also greater in specialty hospitals (87.1% vs. 70.7%, p<0.001). Although specialty hospitals are larger than small general hospitals in terms of most structural factors, both types of hospital are the smallest hospital category in Korea (cf. mid-sized general hospitals fall within a higher hospital category and have higher structural factor measures than the other hospital types in this study, except for nurses per 100 beds). Roughly two-thirds of all colorectal anal nationwide patients (58.6%) were admitted to hospitals located in metropolitan areas, and 47.5% of patients were treated in teaching hospitals.
Univariate analysis of outcome variables revealed that inpatient charges per case were higher for surgical procedures (roughly 3 times greater than medical procedures) and for specialty hospitals (1.27 times greater than small general hospitals) (Table 3). The inpatient charge per day was also slightly higher for surgical procedures (1.56 times greater, p<0.001) and in specialty hospitals (1.92 times greater, p<0.001). The LOS was shorter in medical than surgical cases (9.8 days vs. 6.6 days), in specialty rather than small general hospitals (3.6 days vs. 7.0 days), and in the year 2012 compared to the year 2011 (6.8 days vs. 7.1 days). Mid-sized general hospitals' average inpatient charge per case was 37% greater, but this was due to a two-fold higher LOS (7.2 days); inpatient charges per day were actually 25% lower.
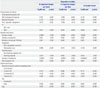
Multi-level regression analysis results are shown in Table 4 and 5. Although specialty hospitals had a 13.2% higher inpatient charge per case than small general hospitals (Table 4), the difference wasn't statistically significant. An effect of the official "specialty" designation was found in inpatient charge per case, with 1.9% less charges per case after specialty status was conferred. Specialty hospitals charged an average of 73.2% more than small general hospitals per day, though the LOS at specialty hospitals was 53.6% shorter. LOS was reduced by 2.9% after specialty status was conferred. Specialty hospitals also had greater charges per day and shorter LOSs than mid-sized general hospitals. Differences were identified between the years 2011 and 2012 in terms of inpatient charges per case (1.7% more in 2012), charges per day (2.8% more in 2012), and LOS (0.8% less in 2012). Other potential hospitallevel confounders (number of beds, specialists, nurses per 100 beds, and outpatients, as well as bed occupancy rate) were also associated with inpatient charges and LOS, but the effects were very minimal in terms of coefficients. However, female patients used 3.3% more resources than male patients, and older patients used more than younger patients, with an increase of 0.3% per year. In terms of charge per day, however, male patients used 5.8% more resources than female patients, and they also had 9.1% shorter LOS. The severity of illness also affected inpatient charges per case and per day as well as LOS (the higher the CCL, the greater the charge per case, charge per day, and LOS).
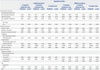
As shown in Table 5, we conducted the analysis following stratification by surgical and medical procedures, as we assumed that characteristics of these two procedures would be very different in terms of charges and LOS. However, the stratified results revealed trends similar to those shown in Table 4. Inpatient charges per case were not significantly different in specialty hospitals. However, specialty hospitals operated significantly more efficiently than small general hospitals, with 38.1% shorter LOS for surgical procedures and 50.8% shorter for medical procedures. The effect of "specialty" designation was mixed, depending on the type of procedure: inpatient charges per day were 6.2% less for surgical procedures and 1.7% more for medical procedures. Other hospital-level confounders (number of beds, specialists, and outpatients, as well as bed occupancy rate) were also associated with the outcome variables, but these associations were minimal. At the patient level, an effect of gender on inpatient charges was found only for medical procedures. The effect of age was similar to that reported for the full model. Severity of illness also had a significant effect on all of the outcome variables, as observed in the full model (the higher the CCL, the higher the charges per case, charges per day, and LOS).
DISCUSSION
We identified characteristics of colorectal-anal specialty hospitals and examined the effect of "specialty" hospital designation using a dataset that included all colorectal-anal related, nationwide inpatient claims in South Korea. Colorectal-anal specialty hospitals charged about 1.27 times more per case and 1.92 times more per day than small general hospitals. Multi-level, random-effect linear mixed regression models found evidence that specialty hospital charges were comparable to those of small general hospitals on a per case basis, but per day charges were 73.2% more at the former. The same trend was evident in an analysis stratified by procedure type, with no difference in per case charges and higher per day charges at specialty hospitals (charges were 35.4% greater for surgical procedures and 66.9% greater for medical procedures). Following "specialty" hospital designation by the government, inpatient charges per case decreased in both the full and stratified models (by -1.9% in the full model, -8.1% for surgical procedures, and -1.6% for medical procedures).
Somewhat surprisingly, per day charges showed a 0.8% increase in the full model, with the stratified models showing a 6.2% decrease in per day charges for surgical procedures and a 1.7% increase for medical procedures. Although this study focused only at the short-term effects of this designation, it appears that specialty hospitals may have consciously attempted to reduce their charges. This may indicate a necessity for increased scrutiny of specialty hospitals by the public, as well as a growing demand for transparency by regulatory bodies. Furthermore, this finding showed that the "specialty" designation lowered the financial burden borne by colorectal-anal disease patients who underwent surgical treatments in these hospitals.
Furthermore, specialty hospital inpatients tended to have less severe conditions (77.5% were CCL=0). The result of this study confirms the previous research for opponents of specialty hospital that specialty hospitals may cherry-pick patients for their greater profit by selecting relatively health patients.1121314 Providing more costly surgical procedures would generate profits among specialty hospitals, furthermore, relatively healthy patients would also be beneficial since their LOS might be lower than other complicated conditions (ex. CCL 2 or 3).
In South Korea, specialty hospital designation requires strict structural mandatories including equipping with certain number of physicians, beds, and medical department related to their specialty area. Although specialty hospitals invested lots of money for the designation, no financial subsidies are presented to those hospitals. They might charge more for patient care in order to secure financial viability. Since great portion of nationwide claims occurred within tertiary research university hospitals (n=43) and mid-sized general hospitals (n=280) that accounted almost 80%, small general hospital's cherry-pick patients from higher level hospitals might be fascinating to secure financial viability.
Features of national health insurance program might be another reason for this. Within the National Health Insurance (NHI) system, hospitals don't have any change for price negotiation for their medical services, hence they may perform profitable, costly, and or additional services that may not needed for their financial reasons. It is objective that hospitals in metropolitan area might have great pressure on rents, payroll, and other expenses for their operations. Therefore, there costs might greater than hospitals located in in non-metropolitan areas. However, this trend hasn't shown in this study, although more than half of the hospitals studied were located in metropolitan areas. Gender-specific differences in inpatient charges were identified in our study. Female patients were more likely to be charged more on a per case basis, but male patients were charged more on a per day basis. Older age was also related to higher inpatient charges.20
In our study, the LOS in the former was roughly 53.6% shorter in the full model, after adjusting confounders (patient- and hospital-level). Moreover, the LOS decreased following "specialty" designation (becoming 2.9% shorter), and LOS declined slightly from 2011 to 2012 as well (becoming 0.8% shorter). Since more than 20% of surgical and 3.5% of medical procedures performed in three specialty hospitals (accounting for 0.3% of hospitals in this study), as shown in Table 2, specialty hospitals may have more experience due to their specialty volume, allowing them to focus on efficiency. Both surgical and medical colorectal-anal procedures were performed more efficiently in specialty hospitals than others (38.1% shorter LOS for surgical procedures and 50.8% shorter LOS for medical procedures). The efficiency of specialty hospitals was also superior to mid-sized general hospitals, which may find their higher patient volume and research experiences overwhelming. Their volume and experiences exclusively on colorectalanal area might be helpful to utilize Clinical Pathway in order to manage quality of care that might also lead to shorter LOS of specialty hospitals. Using a stratified model, designation effect on LOS was found for medical procedures (which were 3.5% shorter). This study also found that hospitals in metropolitan areas may performed inpatient care efficiently (LOS was 10% shorter in the full model, 9.9% shorter for medical procedures). Specialty hospitals had much higher bed occupancy rates than small hospitals (87.1% vs. 70.7%); the former may pursue their objectives by charging more per day for a shorter LOS, thus increasing patient volume and bed turnover. In addition, the LOS was significantly longer for female and older patients. Medical services required for female and elderly patients may entail more resources, and a longer LOS was also associated with increasing condition severity (CCL score). LOS appears to be quite long even in Korean specialty hospitals, and the causes for this remain unclear. Among Organization for Economic Cooperation and Development (OECD) countries, the average LOS in hospitals for all causes was highest in Japan, followed by Korea. The abundant supply of beds and the structure of hospital payments in Japan and Korea may provide hospitals in these countries with incentives to keep patients longer.34
Generalizing and interpreting results of this study require cautions, since this study contains several limitation. Although we used nationwide inpatient claim dataset of designated periods, which strengthens the generalizability of our results, healthcare delivery and insurance system in this country may represent an impediment to applying our findings to other countries. Inpatient charges, especially, are very dependent upon nation's specific health insurance system and negotiation process between provider and insurer. In addition, this study researched only 1 of 18 specialty areas which might induce false interpretation of true specialty hospital performance, and this could compromise the reliability of our findings.
Another potential limitation is associated with designation effect since time frame of study periods are very limited. The study periods were not very sufficient to investigate for having concrete study results. Further study with ample dataset should be conducted in order to find out long-term policy impact of specialty hospital and its perspective. In addition, this study does not contain clinical information of patient due to the limitation of claims data. Further studies, incorporating clinical information such as chronic comorbidities, would provide more information to clinicians as well.
Lastly, this study also have lack of certain hospital performance information including hospital financial statements which might lead insufficient information of hospital's financial viability. We were also unable to assess whether medical practice was affected by financial pressure. Both service items and the price of those items are determined by the NHIS, and they apply to all hospitals in Korea. Hence, medical costs should be covered by reimbursement claim data from each hospital; however, how well the costs of providing services reflect actual charges remains unknown.32 Furthermore, the quality measure such as thirty-day hospital readmission that indicates core quality of care metrics in terms of inpatient service, was not included in the dataset. Although colorectal-anal related treatments are not serious life-or-death issues, however, attempts to gather discharge summary for each inpatient procedure should be considered for having relevant quality measures. This study also did not include important individual socio economic status covariates such as income, education level, occupation etc. and hospital covariates such as public or private etc. due to the limitation of claims data, further study should be conducted in order to investigate such effect.
Although our study is based solely on colorectal-anal related, inpatient claim data, to the best of our knowledge it represents one of the few attempts to evaluate the performance and characteristics of specialty hospitals and first attempt to investigate colorectal-anal specialty hospital. We assure that findings of this study will be useful source to health policy makers, providers within this country as well as others with national health insurance system. Our findings add to the mounting evidence on empirical research regarding specialty hospitals in terms of their characteristics and performance. Other specialty areas and designation effects with longer study periods will strengthen the reliability and generalizability of findings for this study.
In conclusion, results of this study shows evidences that colorectal-anal specialty hospitals have a higher per day inpatient charge and a much shorter LOS than small general hospitals. An effect associated with governmental "specialty" designation was also found that the colorectal-anal specialty hospitals may have consciously attempted to reduce their charges and LOS. In order to maintain prosperous specialty hospital system, a broader discussion that includes patient satisfaction, quality measure, efficiency, real cost of care, and LOS of specialty hospitals should be conducted.

 XML Download