

 PDF
PDF ePub
ePub Citation
 Print
Print


INTRODUCTION
Hyperglycemia, advanced glycation end-product, increased polyol pathway, oxidative stress, and the activation of transforming growth factor-β1 (TGF-β1) are interrelated in the pathogenesis of diabetic nephropathy.1 Achieving the best metabolic control, treating hypertension, and treating dyslipidemia are effective strategies for preventing the development of microalbuminuria and delaying progression to more advanced stages of nephropathy in patients with diabetes.2 However, the above measures might not be effective in some patients with diabetes, and novel therapeutic strategies are warranted.2
Vitamin A is converted to two active forms, trans and cis, and enters the nucleus after a heterodimer of retinoic acid A receptor (RAR) and the retinoic X receptor (RXR) forms in cellular cytoplasm. By stimulating the transcription of the retinoic acid response element, this complex is known to exhibit antiproliferative and anti-inflammatory effects.3 When all-trans retinoic acid (ATRA), a pan-retinoic acid agonist, is administered orally to anti-Thy nephropathy model rats, it suppresses interstitial proliferation and glomerular inflammation and prevents renal damage.4 Moreover, retinoic acid has been reported to block lipid peroxidation in streptozocin-induced diabetic rats, and there are studies that also support the protective effect of retinoic acid on the progression of diabetic nephropathy.5
In this study, we aimed to examine the effect of ATRA on diabetic nephropathy by measuring the amount of urinary albumin excretion (UAE) after administrating ATRA to Otsuka Long-Evans Tokushima Fatty (OLETF) rats, a model of spontaneous late onset type 2 diabetes mellitus (T2DM), which is associated with obesity, insulin resistance, and impaired insulin secretion.6 In order to understand the mechanism of action for ATRA, we administered ATRA to cultured rat mesangial cells (RMCs) to examine its effect on TGF-β1 expression after verifying increased expression of TGF-β1 in response to high glucose media, compared to RMCs cultured in control glucose media. Moreover, after the administration of ATRA, we examined changes in protein kinase C (PKC) and reactive oxidative system (ROS), both of which are located upstream in the intracellular signaling pathway of TGF-β1.
MATERIALS AND METHODS
Animal study and experimental design
Six-week old male OLETF and Long-Evans-Tokushima-Otsuka (LETO) rats were obtained as a generous gift from the Tokushima Research Institute, Otsuka Pharmaceutical, Tokushima, Japan. Each rat was housed in a metabolic cage and maintained on a 12-h light-dark cycle at 24℃and 40.60% humidity. Tap water and pelleted rat chow were available ad libitum throughout the experiments. We measured the body weight of the rats every 4 weeks after an overnight fast.
Fasting blood glucose (Hexokinase method, Advia® 1650, Bayer, Berkley, MI, USA) levels were measured at 28 weeks of age, utilizing whole blood obtained from the tail vein after overnight fasting. An oral glucose tolerance test (2 gram glucose per kg body weight) was performed at 28 weeks of age for the diagnosis of diabetes, and blood glucose levels were measured before and 2 hours after administering the glucose load.
From 28 weeks of age, we orally administered 10 mg/kg body weight of ATRA (Promega, Madison, WI, USA) dissolved in cellulose and 5% Dimethyl sulfoxide (DMSO) to 20 OLETF rats with diabetes for 16 weeks (ATRA-treated OLETF group). We administered cellulose and DMSO as a vehicle to 20 OLETF rats (non-treated OLETF group) and 10 LETO rats (LETO group) for the same period.
At 44 weeks of age, the rats were anesthetized with tiletamine/zolazepam (Zoletin®, 30 mg/kg, intraperitoneally, Virbac Lab., Carros, France), as well as xylazine (Rompen® 10 mg/kg, intraperitoneally, Bayer, Berkley, MI, USA), and blood samples were subsequently collected via cardiac puncture. We measured serum glucose (Hexokinase method, Advia® 1650, Bayer, Berkley, MI, USA), C-peptide (Radioimmunoassay, RAT C-peptide RIA kit, Linco, St. Charles, MO, USA), insulin (Radioimmunoassay, RAT Insulin RIA kit, Linco, St. Charles, MO, USA), total cholesterol (Enzymatic assay, Advia® 1650, Bayer, Berkley, MI, USA), triglyceride (Enzymatic assay, Advia® 1650, Bayer, Berkley, MI, USA), high density lipoprotein cholesterol (HDL-C, Selective inhibition method, Advia® 1650, Bayer, Berkley, MI, USA), and low density lipoprotein cholesterol (LDL-C, calculated by total cholesterol-triglyceride×0.456.HDL-C). For the evaluation of adverse reactions, we examined peripheral blood (LH 750, Coulter, Miami, FL, USA) after overnight fasting for serum creatinine (Jaffe, Alkaline Picrate, Kinetic method, Advia® 1650, Bayer, Berkley, MI, USA), aspartate aminotransferase (IFCC UV method, Advia® 1650, Bayer, Berkley, MI, USA), and alanine aminotransferase (IFCC UV method, Advia® 1650, Bayer, Berkley, MI, USA) levels. Twenty-four hour urine samples were collected at 44 weeks of age, and albumin excreted into the urine was measured by an immunoturbidimetric method (Cobas Integra, Roche, Basel, Switzerland) using rat albumin as a standard. For a control group, we kept the LETO rats under the same conditions and performed the same tests. All procedures were performed according to institutional guidelines for animal research.
Culture of rat mesangial cells (RMCs)
We cultured commercial RMCs in Dulbecco's Modified Eagle Medium (DMEM), low glucose (1 g/L), 1% penicillin, and 5% fetal bovine serum, and we exchanged the culture media every 2.3 days for 2 weeks. When RMCs approached confluence, they were subcultured using trypsin/EDTA (0.5%/0.53 nM). The RMCs were utilized at 6-10 cycles of subculture for the following experiments.
To examine the effect of high glucose on RMC, D-glucose (Sigma Chemical Co., St. Louis, MO, USA) was added to DMEM to final glucose concentrations of 30 and 5 mM for the high glucose and control glucose groups, respectively. To exclude an osmolar effect of high glucose concentration, we added 25 mM of mannitol to the media containing 5 mM of glucose.
After incubation of quiescent RMCs with 10-8, 10-7, 10-6, and 10-5 M ATRA for the given time periods (6, 24, and 48 hrs) in media containing 30 or 5 mM glucose, changes in TGF-β1 and PKC expression and ROS were measured.
Measuring TGF-β1, PKC, ROS
Culture media was collected and centrifuged. The cell suspension was activated using 1 N HCl and 1.2 N NaOH, and we measured concentrations of TGF-β1 using the quantitative sandwich enzyme immunoassay technique from R&D system (Minneapolis, MN, USA). The expression of PKC isoforms was determined using Western blot analysis. In brief, we washed the culture cells (5×10⁶-1×10⁷) with PBS buffer two times and suspended them in 0.5 mL of whole cell lysate buffer. Equal amounts of protein were separated by sodium dodecyl sulfate polyacrylamide gel electrophoresis (SDS-PAGE) (8% resolving), electro-blotted to nitrocellulose, and probed with antibodies against PKC-α, -β, -δ (1:500 dilution, Santa Cruz, CA, USA), or β-actin (1:5000 dilution, Sigma, St. Louis, MO, USA) overnight in a 4℃ cold room. The proteins were visualized by chemiluminescent detection [electrochemiluminescence (ECL), Amersham Biosciences, Bucks, UK]. To measure ROS, a peroxidase-sensitive fluorescent indicator, 2',7'-dichlorofluorescin diacetate (DCF, 10 mmol/L; Molecular Probes Inc., Eugene, OR, USA) was incubated with mesangial cells for 30 minutes. The cells were then washed and fluorescence was quantified. ROS oxidizes the probe forming the compound, 2',7'-dichlorofluorescin. Fluorescence was quantified using an E-max enzyme-linked immunosorbent assay (ELISA) reader (Molecular Device Corp., Sunnyvale, CA, USA).
Statistical analyses
Results are expressed as mean±SD or SE, with n as the number of experiments. The Kruskal-Wallis multiple comparison nonparametric test [or analysis of variance (ANOVA)] was performed, and a post hoc analysis was applied to determine individual differences between means. Changes in the various parameters following the administration of ATRA at different concentrations and with different treatment periods were analyzed using trend analysis (linear by linear association method). A p-value of <0.05 was considered significant. All statistical analyses were performed using SPSS software for Windows, version 11.5 (SPSS Inc., Chicago, IL, USA).
RESULTS
In vivo study
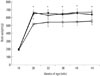
There was no significant difference in weights among the three groups prior to 28 weeks of age. After 28 weeks of age, the OLETF rats weighed more than LETO rats of the same age, while there was no statistical difference in weights between the non-treated OLETF rat group and the ATRA-treated OLETF rat group (Fig. 1).
At 28 weeks of age, immediately before the administration of ATRA, fasting glucose was significantly lower in the LETO rats than in the OLETF rats (6.42±0.54 mmol/L, p<0.01). A postprandial 2-hr glucose level was also significantly lower in the LETO rats (7.99±0.37 mmol/L), compared to the OLETF rats (18.59±0.54 mmol/L, p<0.01). However, both fasting (6.56±0.51 mmol/L vs. 6.30±0.57 mmol/L) and postprandial 2-hr (19.6±4.50 mmol/L vs. 17.8±3.07 mmol/L) blood glucose levels were not different between the non-treated and ATRA-treated OLETF rats.
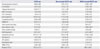
At 44 weeks of age, 16 weeks after the administration of ATRA was initiated, fasting glucose was significantly lower in the LETO rats than in the OLETF rats (p<0.01). Serum glucose levels were also significantly different in the ATRA-treated OLETF rats, compared to the non-treated OLETF rats (p<0.05). Compared with the LETO rats, the non-treated OLETF and the ATRA-treated rats had increased concentrations of total cholesterol (all p<0.01) and triglyceride. However, no significant differences in total cholesterol and triglyceride were found between the ATRA-treated OLETF rats and the non-treated OLETF rats. There were no significant differences in HDL-C and LDL-C levels between the three groups. Non-treated OLETF rats exhibited higher insulin, C-peptide, and homeostasis model assessment for insulin resistance (HOMA-IR) levels than the other two groups, which is consist with increased insulin resistance. Twenty four-hour urine volumes were lower in the LETO rats than the non-treated and ATRA-treated OLETF rats (all p<0.01). The OLETF rats exhibited a higher daily UAE than the LETO rats at 44 weeks of age. In the ATRA-treated OLETF rats, daily UAE was lower than in the non-treated OLETF rats (p<0.01). There were no significant differences in liver enzymes, creatinine, hemoglobin level, white blood cell count, or platelet count between the three groups (Table 1).
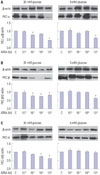
Effect of ATRA on TGF-β1 in the RMCs
From conditioned media, RMCs exhibited a time-dependent increase in TGF-β1 levels after being incubated in the presence of both 30 and 5 mM glucose conditions. Compared with the control glucose concentration, incubation in a high glucose concentration significantly increased TGF-β1 secretion at 24 and 48 hours, with TGF-β1 levels reaching 578.3±23.1 [mean±standard error of the mean (SEM) of three experiments] and 651.2±29.7 pg/mL for control glucose and 798.0±39.8 and 887.4±43.7 pg/mL for high glucose concentration (p<0.05), respectively.
In addition, treatment with ATRA under both 30 and 5 mM glucose conditions exhibited dose and time-dependent decreases in TGF-β1 levels (all p<0.05) (Fig. 2).
Effect of ATRA on PKC expression in the RMCs
The media showed a time-dependent increase in PKC expression under both control and high glucose conditions. The increase in PKC expression was observed at 12 hrs and reached a maximum at 24 hrs. Treatment with ATRA under both control and high glucose conditions showed a dose-dependent decrease in PKC expression. Our findings demonstrated decreased PKC expression in the RMCs by ATRA (Fig. 3).
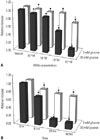
Effect of ATRA on ROS generation in the RMCs
ATRA at 10-6 and 10-5 M significantly decreased DCF-sensitive cellular ROS levels, compared with the control condition. DCF-sensitive cellular ROS in the RMCs showed a time-dependent decrease after ATRA administration (Fig. 4A). In addition, after incubating the synchronized quiescent RMCs with 10-5 M ATRA in media containing 30 or 5 mM glucose for different time periods (6, 12, and 48 hrs), a relative decrease in ROS was seen. DCF-sensitive cellular ROS in the RMCs showed a time-dependent decrease after ATRA administration (Fig. 4B).
DISCUSSION
In this study, we demonstrated that ATRA treatment decreases albuminuria and suppresses TGF-β1 synthesis. ATRA is known to exert beneficial effects on nephropathy.789 ATRA treatment has been shown to limit glomerular cell proliferation and renal damage by reducing renal TGF-β1 and TGF receptor II expression in nephropathy rat models.4 ATRA treatment also exhibits an anti-oxidant effect by blocking lipid peroxidation in streptozotocin-induced diabetic rats.5 In a diabetic rat model, treatment with ATRA caused a drop in urinary protein excretion.8 ATRA regulates the expression of multiple genes by binding to and subsequently activating RAR α, β and γ and/or RXR α, β, and γ.9 The binding of ATRA or other retinoids to the receptors causes the dissociation or release of corepressors and recruitment of coactivators to prompt and facilitate gene transcription.10 It is speculated that the therapeutic effect of ATRA in animal models of nondiabetic renal disease may be linked to down-regulation of genes related to inflammation, cell proliferation, and fibrosis.11 However, the exact mechanism of its protective effect on diabetic nephropathy has not yet been elucidated. In the study of Han, et al.,8 ATRA generated renoprotective effects through reduction of the renal inflammatory process. In that study, they investigated ATRA's renoprotective effects for a relatively short time (4 weeks) in the early stages of diabetic nephropathy,8 while on the other hand, we evaluated the effects of ATRA from the time albuminuria became prominent12 for a longer term treatment (16 weeks). Even though repeated oral administration of ATRA may cause autoinduced metabolism of the drug and a decrease in plasma concentrations, intravenous administration may have potential advantages over oral ATRA and may be more efficacious.13
TGF-β1 stimulates the transcription of many extracellular matrix genes in renal cells.14 In several models of renal disease (e.g., diabetic nephropathy, experimental glomerulonephritis, or unilateral ureteral obstruction), TGF-β1 has been implicated as a primary mediator for cell growth and accumulation of extracellular matrix.15 TGF-β1 might be a critical mediator for diabetic nephropathy. Interrupting this system may hold promise for amelioration of diabetic nephropathy. Existing approaches to renoprotection, including glycemic control, lowering dietary protein, and the administration of angiotensin conversion enzyme inhibitors and angiotensin receptor blockers, may act, at least in part, via the inhibition of TGF-β1. ATRA have been previously shown to down-regulate TGF-β1 gene expression via activator protein-1 (AP-1) binding sites on the TGF-β1 promoter.16 Furthermore, Morath, et al.4 demonstrated that the beneficial effects of ATRA on glomerular damage were presumably due to a marked reduction in renal TGF-β1 and TGF receptor II expression. Similarly, in our study, treatment with ATRA caused a dose- and time-dependent decrease in TGF-β1 production in the RMCs. As in previous studies, our present observations suggest that ATRA treatment may exert beneficial effects on diabetic renal disease by inhibiting TGF-β1 production.
In our study, we have shown that high glucose-induced PKC expression is effectively inhibited by ATRA administration. The inappropriate activation of PKC has been implicated as a putative mediator in the pathogenesis of diabetic nephropathy based on evidence from both in vivo experimental animal diabetic models and in vitro studies with cultured glomerular cells.17 Activation of PKC contributes to increased accumulation of microvascular matrix protein by inducing the expression of TGF-β1 in both cultured mesangial cells18 and the glomeruli of diabetic rats.19 PKC-α, β, δ, and ε are activated in the glomeruli of diabetic rats.20 Inhibition of PKC-β is nephroprotective in a diabetic model.21 Treatment with ruboxistaurin mesylate, PKC inhibitor, in genetically diabetic mice prevented mesangial expansion and glomerular dysfunction.22 Retinoids can function as antioxidants and promote differentiation, providing a protective effect against altered activation of PKC.23 In fact, retinoic acid reduced or inactivated PKC in many studies.24 PKC activation might regulate the expression of TGF-β1 at a transcriptional level, since its promoter contains AP-1 sites. AP-1 sites are activated by the proto-oncogene complexes, fosjun homodimers or heterodimers.22 Retinoid suppresses important inflammatory transcriptional factors, AP-1, by activation of the RXR.25 Therefore, we can infer that the beneficial effect of ATRA on diabetic nephropathy could be due to either its ability to directly inactivate PKC or through the suppression of TGF-β1. However, to clarify its mechanism, further investigation is needed.
In this study, we have demonstrated that high glucose concentration induces ROS in the RMCs. Moreover, we showed that high glucose concentration-induced ROS generation in the RMCs was effectively blocked by ATRA in a dose- and time-dependent manner. Increased ROS production is an important mechanism proposed to explain why poor glycemic control in diabetes results in vascular complications.26 High glucose concentration induces ROS27 and up-regulates TGF-β128 expression in glomerular mesangial cells. ROS also up-regulates TGF-β1 expression in mesangial cells.29 Along with previous studies, our present observations suggest that ATRA treatment may exert beneficial effects on diabetic renal disease by lowering blood glucose concentrations and inhibiting TGF-β1 production through the inhibition of PKC expression and ROS synthesis in mesangial cells.
The beneficial effects of ATRA on diabetic nephropathy in our study might have been due to the antihypertensive effect of ATRA. Besides hyperglycemia, hypertension is another potentially modifiable factor to prevent the initiation and progression of diabetic nephropathy in susceptible individuals.30 The antihypertensive mechanism of ATRA has not yet been clarified, but has been considered to include the alleviation of renal damage by retinoic acid and blockade of angiotensin II action.31 Although we did not measure blood pressure in the experimental rats, it has been reported that most of the antihypertensive effect of retinoids are observed in acute and chronic experimental nephritic rat models.9
Diabetic nephropathy is the leading cause of end stage renal disease, requiring dialysis treatment. Diabetic nephropathy is developed 25 years after the onset of diabetes among 25-40% of diabetic patients.32 Based on the cumulative epidemiological data, it is obvious that the maintaining normoglycemia is the most effective method to prevent and delay the diabetic nephropathy.33 However, from these epidemiological studies, it is also evident that the long-term maintenance of normoglycemia is difficult in most subjects with diabetes. Therefore, efforts have been directed to identify the therapeutic plans that could abolish diabetic nephropathy development and progression.
In conclusion, our findings in the present study provide evidence that ATRA treatment can influence the development of diabetic nephropathy without causing any obvious adverse effects. The beneficial effects of ATRA on diabetic nephropathy in the RMCs were in part due to reduction of TGF-β1 synthesis, which was mediated by a significant reduction of PKC activity and ROS production. Also, our findings highlight the need for further studies to assess the potential therapeutic effects of ATRA in diabetic nephropathy, to delineate the mechanism of action for ATRA, and to identify retinoid receptor-specific pathways in the kidney.

 XML Download