

 PDF
PDF ePub
ePub Citation
 Print
Print


INTRODUCTION
Background
Emergency department (ED) crowding is a growing global concern that is not limited to Northern America.1234 ED crowding is thought to be caused by an increasing number of patients, a shortage of ED and hospital beds, a lack of trained healthcare providers, and other socioeconomic issues that influence the operation of EDs.567
Many studies have acknowledged that ED crowding is harmful to patients, as it leads to delays in treatment and an increase in potential errors.891011 A compromised ED not only influences the hospital, but also affects emergency medical service and the community at large.121314
The Independent Capacity Protocol (ICP) was introduced to enhance the output capacity of the ED and in a previous study was found to be effective within a relatively short period of time.15 The protocol augmented the potential output capacity of our ED by including other surrounding community hospitals. With the ICP, the ED was used as a temporary care unit to evaluate and stabilize patients (over a period of about two days), followed by inter-facility transfer to multiple community hospitals as potential receiving areas. After introduction of the ICP, ED length of stay (LOS) decreased without an increase in hospital capacity over the limited study period.
Importance
There have been numerous attempts to reduce crowding in ED. Among input, throughput, and output factors, interventions aimed at addressing the output factor level seem to be the most critical.1617181920 However, the sustainability and long-term effect of our and other reported protocols have not been reported. Furthermore, inter-facility comparisons have not demonstrated the effectiveness of a single-center protocol in preventing ED crowding.
MATERIALS AND METHODS
Study design
A before and after study design was used to test the study hypothesis. The study was approved by the Institutional Review Board at the study institution and was exempt from informed consent.
Setting
This study was performed at an urban, level-1 emergency center that has about 54000 annual visits (2010). The ED has 54 treatment beds (including 34 beds for adults in an adult area and 20 beds for children in a pediatric area), a 30-bed emergency ward on a different floor of the same building, and a 20-bed emergency intensive care unit (EICU).
Nationwide there are 16 regional emergency centers that serve as level-1 centers, 121 local emergency centers (level-2), and about 330 local emergency institutes (level-3). The number of regional emergency centers has increased since concluding the study. These centers are designated by the Korean Ministry of Health and Welfare after meeting specific criteria. Many level-1 centers are academic hospitals and are staffed with very experienced physicians who serve emergency patients as a tertiary center with 24-hour/365-day coverage. Level-1 centers should operate EICUs and must respond to disaster in the designated region.
The state of emergency medicine in Korea has been described in previous articles.11152122 The National Health Insurance (NHI) Corporation pays for approximately 80% of emergency medicine costs, regardless of which hospital the patients choose. Most diseases and injuries are covered by the NHI program, with some exclusions, such as motor vehicle accidents and intentional injuries that are covered by either private insurance or are not covered at all.
The independent capacity protocol
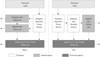
The ICP was designed to help reduce ED crowding by augmenting the output capacity at regional medical centers. This protocol gave emergency physicians more responsibility and authority over patient disposition. The ICP also converted the ED into a temporary, nonspecific ward that can care for any patient for a period of up to 48 hours. During this time period emergency physicians were assisted by specialists and transfer coordinators in determining patient disposition. When no local beds were available at the study institution and the patient's condition allowed, patients were transferred to a surrounding community hospital based on a case-by case determination and inter-facility agreements and protocols. The general principles of the ICP are presented in Fig. 1.15
Selection of participants
The ICP was introduced on July 1, 2007. The before period included patients presenting to the ED between January 1, 2005 to June 31, 2007. The after period included patients presenting three months after implementing the ICP from October 1, 2007 to December 31, 2010. In order to compare the degree of ED crowding at the study center to other institutions; crowding indices from other fifteen level-1 centers were collected from January 1, 2005 to May 30, 2010 using the national ED information system (NEDIS).
Data collection and processing
The NEDIS is an electronic database that has been collecting patient data from about 120 EDs throughout Korea since 2004. From the NEDIS, we included patients from sixteen regional EDs. We collected clinical data, such as age, sex, diagnosis, and treatment. We also gathered data regarding the patients' insurance status and mode of arrival to the ED. These data were selected because they have been suggested to have an impact on ED crowding.15 We also collected data on patient outcomes including discharge, admission, and in-hospital mortality.
Outcome measures
The main outcomes that we measured were the ED LOS and the LOS of admitted patients. The ED LOS directly reflects the ED volume, which is a good indicator of ED crowding. The ED LOS also reflects the occupancy rate.232425 Secondary measures included the mean number of monthly ED visits and the rate of inter-facility transfers.
Data analysis
In order to demonstrate changes in outcomes after implementing the ICP, patient data were converted into time-series data. The mean number of monthly ED visits, the rate of inter-facility transfers from the ED, the mean (standard deviation, SD) and median (interquartile range, IQR) ED LOS, and the mean (SD) and median (IQR) hospital LOS of admitted patients were calculated. Standard descriptive statistics including differences with 95% confidence intervals (95% CIs) between the before and after study periods are reported. In order to demonstrate trends over time, we performed univariate linear regression analysis. Linear regression can be a robust model with large data size, despite the skewedness of ED LOS.26 We also performed a piecewise regression to determine the effect of the intervention in a time-series format. A piecewise regression is a form of interrupted time series analysis which is to determine whether an intervention affects a series of observations.27 The trend is described with differences and 95% CIs of the slopes between the two study periods. We also collected data regarding LOS at 15 additional level-1 emergency centers not using the ICP protocol. The same piecewise regression analysis was performed to demonstrate and compare trends at the other hospitals. We used Stata software (version 12.1, Stata Corporation, College Station, TX, USA) for all analyses.
RESULTS
General characteristics of the study subjects
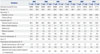
A total of 271519 patients were included in the study during the 6-year period. Annual visits to the ED increased from 37983 to 54026 (a 42% increase). Among the study subjects, 46.3% were female, 27.2% were children (less than 15 years old), 20.8% were elderly (more than 65 years old), 91.1% were covered by the National Health Insurance (NHI), and 16.0% were transported to the ED via an ambulance. Additional details are described in Table 1.
Table 2 shows the trends in patient outcomes during the 6-year study period. The rate of discharge from the emergency department increased from 65.2% to 71.0% (p<0.001) and the transfer rate from emergency room without admission increased from 2.8% to 3.1% (p=0.007). Admissions to the emergency ward increased from 4.3% to 6.4% (p<0.001), which is equivalent to an increase in monthly admissions from 162 to 310. The rate of transfers from the emergency ward to other facilities increased from 1.7% to 9.9% (p<0.001). The overall hospital mortality decreased from 2.7% to 1.8% (p<0.001).
The changes in ED resources that occurred during the study period are presented in Table 3. There was a significant increase in the number of physicians until 2008, while little change was seen in the number of nurses during the same period.
Main results
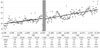
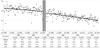
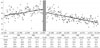
Figs. 2,3,4,5 summarize the results of the piecewise regression. The piecewise regression compares the y-intercept and slope before and after implementation of the ICP. ED visits increased continuously (Fig. 2). After the intervention, the intercept changed from 119.1 to 115.1 (difference: 3.39, 95% CI: -1.43 to 8.21) (p=0.17) and was not statistically significant. The slope increased from 0.146 to 0.205 daily visits/week (difference: 0.060, 95% CI: 0.004 to 0.116) (p=0.04). The transfer rate from the emergency ward, which implies the community resource utilization rate, showed an overall increasing trend, as presented in Table 2. After implementing the ICP, the intercept increased from 3.21% to 5.50% (difference: 2.29, 95% CI: 0.27 to 4.31) (p=0.03). The slope increased from 0.012% to 0.019% per week (difference: 0.0075, 95% CI: -0.016 to 0.031) (p=0.53) but was not statistically significant (Fig. 3). The overall ED LOS demonstrated a decreasing trend (Fig. 4). After the intervention, the intercept dropped from 8.51 to 7.98 hours (difference: 0.52, 95% CI: 0.04 to 1.01) (p=0.03), and the slope decreased from -0.011 to -0.018 hours/week (difference: 0.0069, 95% CI: 0.0012 to 0.013) (p=0.02). As demonstrated in Fig. 5, a notable change was seen in the mean time waiting for admission. After the intervention, the intercept decreased from 33.6 to 31.1 hours (difference: 2.44, 95% CI: 0.84 to 4.05) (p=0.003) and the slope decreased from 0.45 to -0.54 hour/week (difference: 0.100, 95% CI: 0.081 to 0.18) (p<0.001).
Additional analyses
In order to compare outcomes in the study institution with those in the other 15 level-1 centers in the NEDIS database, administrative data, including ED LOS and admission waiting time, were collected. Overall, 2892440 data points were evaluated over a duration of 65 months. Similarly, a piecewise regression was carried out. Before the intervention, the slope of the study hospital was 0.0547 hour/week (95% CI: 0.039 to 0.070). This was significantly higher than the slope of the other hospitals, which was 0.0064 hour/week (95% CI: 0.0020 to 0.011). However, after the intervention, the slope of the study hospital was -0.0642 hour/week (95% CI: -0.078 to -0.051), which was significantly lower than the other centers' slope of -0.0080 hour/week (95% CI: -0.012 to -0.0042) (Fig. 6).
DISCUSSION
Our study has several important limitations. First, this was a single-center study, thus it is difficult to extrapolate the results to other institutions or countries. For example, the degree of crowding at the study center was significantly greater than that at the other centers, which could have made our center more vulnerable to any intervention. The successful outcome of this strategy heavily relies on the fact that the study site is output-dependent. However, the trend after initiating the ICP is notable. This trend signifies that even with an increasing number and acuity of patients, the protocol can still be effective.
Second, this study was a pre- and post-intervention observational study. We did not include specific measures to evaluate the process within the center. Thus we do not know which aspect(s) of the protocol contributed most to the success of the project. We also did not randomize the patients, which may have biased the results.
Third, we did not evaluate clinical outcomes of the study patients. The mortality, hospital LOS after admission, and patient satisfaction are valuable measures to determine the success of the project, but were not included in this study.8 Occupancy rate of regional hospitals was not included in this study, which could have shown additional information regarding utilization of regional resources. This study was more focused on the trends and changes after the intervention. However, the ICP did not adversely influence the mortality of patients in a previous study, further study is required to prove the safety.15
Last, the sample size of this study is very large, that even with clear statistical significance (p-value<0.05), the effect may not have clinical significance. One should give caution when interpreting the results.
ED crowding is a serious problem in many parts of the world. The significance of this problem is increasing despite the differences among healthcare systems.4 There are many potential causes for this phenomenon, and the input-throughput-output model has been used frequently to help understand the problem.28 Though input factors and throughput factors play important roles, output factors are thought to be the major cause of crowding.56 Interventions focusing on ED output have been successful, while interventions focusing on other factors have not produced consistent results. For example, in one study, expansion of the adult ED capacity from 28 to 53 beds did not affect ambulance diversion. Instead, total ED LOS and time to admission increased. As a result, ED expansion appears to be an insufficient solution to improve diversion without addressing other bottlenecks in the hospital.29 A study on expanding ED output by transferring ED-boarded admitted patients to an inpatient hallway during high ED census did not appear to result in patient harm.17 Increasing the number of ICU beds available to emergency patients also showed a decrease in time spent on ambulance diversion and appears to have shortened ED LOS for ICU patients. However, this intervention had less of an effect on other admitted patients and apparently had no effect on patients discharged to their home.19 Another study showed that ED throughput and diversion status improved with the implementation of an active bed management process coordinated by hospitalists.20 These studies indicate that ED expansion, an increase in ICU beds, and active bed management to increase ED output capacity have limitations and may not contribute to sustainable, long term solutions for ED crowding.
The 2010 Society for Academic Emergency Medicine consensus conference on regionalization in emergency care began with an update on the Institute of Medicine reports on the Future of Emergency Care.1830 Because ED crowding was such a prominent focus of this meetings reports and recommendations, it was disappointing that more progress has not been made in eliminating boarding of inpatients at EDs in the United States. Promoting regionalization in emergency care was regarded as a critical option for accountable emergency care. The ICP is a novel model of expanding output capacity using regional resources.1518 Also, the importance of regional hospitals, who receive patients from crowded institutions, play a critical role in the ICP. Mutual understanding and partnership is essential for the success of a regionalization protocol. Under the protocol, emergency physicians in a crowded ED take greater responsibility for patient disposition, particularly for patients who were admitted to the emergency ward. When the hospital capacity reaches its limit, the protocol promotes transferring patients to other, less crowded hospitals within the region. Regional sharing of emergency care after patient stabilization is likely to be less harmful than the ambulance diversion that occurs prior to patient stabilization. In this study, we evaluated the long-term effect of the ICP. The mean ED LOS and time waiting for an admission decreased significantly, and an increased transfer rate and decreased mortality rate were also observed. To the best of our knowledge, no other type of intervention, except the hallway admission protocol, has shown this long-term effect.17 Compared to trends in national average boarding times, the rate of change was greater for our study institute (Fig. 6). Most of the other level-1 EDs in Korea have also suffered from crowding. However, the strategies adopted by other hospitals have been more traditional, including active management of inpatient beds or expansion inpatient beds. A successful increase in the flow of patients from the ED entrance to exit at our institution was seen regardless of increases in overall number of patients visiting our hospital. This study compared the trends of the study hospital to that of other level-1 centers. However, caution is needed to interpret the result because level-1 centers vary in their performance, and composition of patients differs among centers significantly.
A major strength of our study was the use of the NEDIS database, a nationwide ED information system, to measure the LOS for each observation period. This database began in 2004 with 19 level-1 EDs and has expanded to include approximately 143 EDs.31 All patient data points are automatically extracted from each of the hospitals' electronic medical records and transferred to the national emergency medical center, which is the national agency with overall administrative authority. These data are used by the government for annual evaluation of ED performance and are highly reliable and verifiable. This database allowed us to follow ED crowding over an extended time period, which was essential in order to evaluate the long-term effects of the ICP. However, in order to strengthen the hypothesis of this observational study, a prospective intervention study is required. EDs play a significant role in public health. Regionalization and resolving overcrowding of EDs will widen access to emergency medical systems.
In conclusion, implementation of the ICP was associated with sustainable and long-term reduction in ED measures of crowding including total ED LOS and time waiting for admission in admitted patients.


 XML Download