

 PDF
PDF ePub
ePub Citation
 Print
Print


INTRODUCTION
Propofol is an anesthetic agent used for induction and maintenance of general anesthesia and also for sedation during minor procedures. However, maintenance of airway patency is a primary concern under propofol sedation.1 Although propofol is considered to induce sedation and airway obstruction in a dose-dependent manner, there have been few reports investigating this relationship.23 Obstructive sleep apnea-hypopnea syndrome (OSAHS) involves recurring episodes of total (apnea) or partial (hypopnea) obstruction of the airways during sleep.4 Disastrous respiratory outcomes have been reported during perioperative management of OSAHS patients;5 therefore, the sedative used must be carefully titrated to avoid oversedation. Understanding the dose-response relationship of sedation and airway obstruction is fundamental for the safe use of propofol, especially when dealing with patients who are at a greater risk of airway collapse.
The purpose of this study was to investigate the relations between the effect-site concentration (Ce) of propofol and the degrees of sedation and airway obstruction in patients with OSAHS receiving the sedative through a target-controlled infusion (TCI) device.
MATERIALS AND METHODS
This study was approved by the Yonsei University Health System Ethics Committee, and informed consent was obtained from all patients before including them in the study. Twenty-five participants, all above 20 years of age and with an American Society of Anesthesiologists classification I or II, were sedated in order to perform drug-induced sleep endoscopy, i.e., assessing the cause of the apnea and snoring by pharmacologically artificially inducing the patient into a light sleep and performing flexible endoscopy of the upper airway. The patients presented subjective symptoms such as snoring, daytime sleepiness, morning headache, sleep disturbance, fatigue, and an apnea-hypopnea index (AHI) >5 recorded by unattended polysomnography [8-channel polygraphy: SpO2, heart rate (HR), flow cannula sensor, actometer, abdominal & thoracic external effort-sensor, electrooculogram; MAP Poly-MESAM, Medicair, Milano, Italy]. OSAHS was categorized as mild (AHI: 5-15), moderate (AHI: 15-30), and severe (AHI: >30), as assessed by polysomnography.6 Patients were excluded from the study if they refused to participate or had hepatic, renal, or pulmonary disease; a history of chronic drug use with the potential to affect the central nervous system; a history of adverse drug reactions; or a history of heart block. Patients with impaired hearing, neurological deficits, or a Glasgow Coma Scale score under 15 were also excluded.
After arrival at the operating room, each patient's electrocardiogram, peripheral oxygen saturation (SpO2), non-invasive arterial pressure, and bispectral index (BIS; BIS® monitor, Aspect medical Systems, Natick, MA, USA) were monitored and recorded at 5-min intervals throughout the whole procedure. Oxygen was given to the patients at 5 L/min via a face-mask and nasal cannula. Hartmann's solution of 4 mL/kg/hr was administered until all procedures ended. The temperature and humidity of the operating room were maintained at 22-24℃ and 60%, respectively.
As an antisialagogue, 0.1 mg glycopyrrolate was injected intravenously. After confirmation of stable vital signs [<10% of baseline mean arterial pressure (MAP) and HR], sedation was induced by 2% propofol (Fresofol 2%™; Fresenius Kabi, Austria) using a commercial TCI pump (Orchestra® Base Primea; Fresenius Vial, France). Operation of the pump was based on the pharmacokinetic model reported by Schnider, et al.78 The initial Ce of propofol was 0.5 µg/mL, and the Ce was increased at a rate of 0.1 µg/mL every 5 minutes by one anesthesiologist. The degrees of sedation and airway obstruction, MAP, HR, respiratory rate, SpO2, and BIS score were assessed and recorded by another anesthesiologist who was not aware of the propofol Ce just before it was increased for the next step. The degree of sedation was evaluated based on the Observer's Assessment of Alertness/Sedation (OAA/S) scoring system,9 and airway obstruction was assessed using a four-category scale (Table 1).2 When the MAP was lower than 60 mm Hg or systolic arterial pressure was lower than 90 mm Hg, 4 mg ephedrine was injected intravenously, and when HR dropped below 50 beats/min, 0.5 mg atropine was injected intravenously. When bradypnea or hypoxia (SpO2 below 90%) occurred, oxygen, and ventilatory support were provided to the patients immediately via jaw thrust. When the OAA/S score reached 5, we completed the study, and a flexible nasal endoscopy was then performed to confirm apneic events and correlate them with pharyngeal collapse patterns. If the endoscopy failed due to patient movement, the Ce of propofol was gradually increased by 0.1 µg/mL until the procedure was successful.
The probability (P) of a given level of effect (sedation or airway obstruction) was related to propofol Ce using the following sigmoidal equation.

In this equation, Pij (effect≥m) is the probability for the ith individual that the jth effect score is equal to or greater than (i.e., "deeper than") a given discrete level (m). Ceij is propofol Ce for the ith individual at the jth observation. Ce50(m)i is the steady-state Ce associated with 50% probability corresponding to the ith patient, and λi is the steepness of the probability versus the concentration curve corresponding to the ith patient.
The complete model for each of the two response studies consisted of four and three separate models, one for each of the following scores: 2, 3, 4, and 5 for sedation and 2, 3, and 4 for airway obstruction, respectively. Sedation and airway obstruction scores of 1 were not included, as these were baseline scores measured before propofol was applied. Model parameters were estimated using the function "LIKELIHOOD LAPLACE METHOD=conditional" in Nonlinear Mixed Effects Modeling (NONMEM) software (version VII; GloboMax, Hanover, MD, USA). For each analysis, NONMEM computed the minimum value of the objective function, a statistic that was proportional to the negative of twice the log likelihood of the data. The inter-individual random variability of each Ce50 was modeled using a log-normal model, whereas the inter-individual random variability of γ was fixed at zero. After obtaining the population base model, a forward inclusion and backward elimination approach was used in consecutive NONMEM runs to determine the relevant covariates among all covariates [age, sex, height, weight, AHI, and body mass index (BMI)]. A covariate was considered significant if its inclusion lowered the minimum value of the objective function by at least 3.85 points. The difference in the minimum value of the objective function between two nested models approximately follows a chi-square distribution and could therefore be used to investigate statistical significance [chi-square statistics equaled 3.84 at the level of significance (p<0.05), with one degree of freedom]. A non-parametric bootstrap procedure was performed for internal validation using Perl-speaks-NONMEM (PsN) (version 3.6.2, http://psn.sourceforge.net), and the original data set was randomly sampled to generate 2000 bootstrap replicates. We obtained the 95% confidence intervals of the nonparametric bootstrap replicates and compared final model parameter estimates with them.
RESULTS
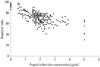
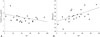
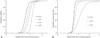
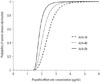
Twenty-five patients who met the selection criteria were studied. Demographics of the enrolled patients are summarized in Table 2. Relations between propofol Ce and the observed sedation and airway obstruction scores are shown in Fig. 1. Increments in propofol Ce were associated with increased depth of sedation and airway obstruction (Fig. 1) and decreased values of BIS (Fig. 2). The sedation and airway obstruction effects were best described with a sigmoidal Emax model using propofol Ce. The estimated model parameters of the ultimately selected pharmacodynamic model and bootstrap estimates for each level of sedation and airway obstruction are summarized in Table 3. Based on our observations, all sedation- and airway obstruction-related parameters were estimated with adequate precision (relative standard error <50%) and were also reliable, as they were within the 95% confidence intervals of the bootstrap estimates. The predicted Ce50(m) values corresponding to sedation scores (m) ≥2, 3, 4, and 5 were 1.61, 1.78, 1.91, and 2.17 µg/mL, respectively. The predicted Ce50(m) values corresponding to airway-obstruction scores (m) ≥2, 3, and 4 were 1.53, 1.64, and 2.09 µg/mL, respectively. Significant correlations were found between AHI and Ce50(4) for airway obstruction with a negative slope (p<0.0001) and AHI and BMI with a positive slope (p<0.0001), as shown in Fig. 3. The pharmacodynamic model including AHI significantly improved the performance of the base model based on the likelihood ratio test, decreasing the minimum value of the objective function from 507.0 to 501.4 (p=0.018). Considering that AHI was the only factor that showed correlation with propofol Ce50(4) for airway obstruction, we included this as a covariate in our model (Table 3). Typical probability curves of population data for each sedation and airway-obstruction score are shown in Fig. 4. The effect of AHI on the probability of an airway obstruction score of 4, as evaluated by estimation, is presented in Fig. 5. Propofol Ce50(4) values in patients with AHI scores of 10, 40, and 70 were predicted to be 2.41, 2.05, and 1.81 µg/mL, respectively.
DISCUSSION
In this study, we obtained the propofol Ce for each sedation and airway-obstruction score in patients with OSAHS and found that the AHI was a significant covariate of Ce50 in the dynamic relationship between propofol Ce and severe airway obstruction. Our study is the first clinical investigation in which pharmacodynamic modeling of sedation and airway obstruction in patients with OSAHS has been evaluated.
OSAHS is characterized by repetitive pharyngeal collapse during sleep, a process that constricts the pathway for airflow and causes periods of airflow reduction or cessation and a consequent reduction in blood oxygen levels.4 In the clinic, OSAHS is diagnosed using polysomnography and is defined by an AHI of five or more episodes per hour.10 Doses or concentrations of anesthetic drugs used for sedation need to be reduced for the safety of patients with sleep apnea.1112 However, no studies have confirmed the relationship between the kinetics of sedative drugs and the degrees of sedation and airway obstruction in these patients. It would be clinically advantageous if the appropriate Ce of propofol for each level of sedation and airway obstruction could be predicted and applied. A nonlinear dynamic model was chosen to describe the relationship between propofol Ce and sedation and airway-obstruction scores, as the data were expected to fit a sigmoid slope.
Based on our results, increments in propofol Ce were associated with increased depth of sedation and severity of airway obstruction.3 However, the differences between the predicted Ce50 values for each level of sedation were small (about 0.1-0.3 µg/mL), and the λ values for each probability curve of sedation were relatively high (≥12.8). These model parameters for sedation indicate that unwanted deep sedation or inadequate sedation might easily happen. Thus, Ce needs to be carefully titrated to achieve a certain level of sedation that is consistent with the known narrow therapeutic range of propofol.11314 Given that our pharmacodynamic model was developed on the basis of data collected when using propofol alone without premedication or analgesics, propofol Ce should be reduced to avoid oversedation when other drugs, which may have synergistic effects on sedation, are concurrently administered.1516
Special attention should be paid to the maintenance of airway patency during sedation in OSAHS patients, as Ce50 values for snoring or severe airway obstruction were not distinctively different from the Ce50 values for moderate sedation from a clinical point of view. There were no data available for healthy individuals without OSAHS that we could use for comparison. When we compared our results to the findings of Fábregas, et al.,2 we found that our Ce50 value (1.64 µg/mL) for snoring was lower than their reported Ce50 value (2.98 µg/mL) for patients with Parkinson disease. It is commonly expected that patients with central nervous system dysfunction might be more sensitive to the hypnotic effect of propofol than healthy individuals. However, the airway of patients with OSAHS proved to be more vulnerable to propofol than that of patients with Parkinson disease. Moreover, their pharmacokinetic values based on Marsh, et al.17 might be somewhat different from our pharmacokinetic values based on Schnider, et al.78
Sedation with propofol changes the macroarchitecture of sleep, and sedation-induced sleep does not seem to correlate well with natural sleep based on previous studies,1819 although there is an ongoing debate concerning this. Our finding is meaningful in that the AHI, evaluated during natural sleep, proved to be a good covariate for severe airway obstruction during propofol sedation. The simulated propofol Ce50 for severe airway obstruction in a patient with an AHI of 70 is around three fourths of that in a patient with an AHI of 10. In patients with an AHI of 70, the propofol Ce50 for severe airway obstruction was similar to the propofol Ce50 for OAA/S 3 sedation (1.81 µg/mL and 1.78 µg/mL, respectively), suggesting that these patients are at risk of having severe airway obstruction even during moderate sedation. Patients with high AHI values are more susceptible to airway obstruction and need more attention during propofol-induced sedation.
Obesity is associated with a 12- to 30-fold increased risk of OSAHS relative to the normal population, and OSAHS is found in 40% of obese females and 50% of obese males.20 BMI representing the severity of obesity correlated well with AHI in our study, confirming the findings of a previous report in which it was found to be an independent risk factor for snoring in Chinese women.21 Hence, we expected that BMI would be a potential covariate and could explain the interpatient variability in pharmacodynamic modeling for airway obstruction; however, the severity of obesity did not prove to be a significant covariate. One explanation for this outcome might be that there were only two obese patients with a BMI value higher than 30, while the average AHI of the population was relatively high.
The limitations of our study included our lack of permission to take blood samples to measure propofol concentration and our assumption that the Schnider model adequately characterized the patient population that we studied. Our results should thus be interpreted with caution, as the parameters of the pharmacodynamic model are dependent on the selected pharmacokinetic model. While the Schnider model is not perfect, it has fewer limitations than other pharmacokinetic models for propofol and therefore has the potential to become the recommended model to use when testing TCI.7822
We conclude that increments in propofol Ce are associated with increased depth of sedation and airway obstruction when determining the narrow therapeutic range of propofol in patients with OSAHS. AHI significantly affects the pharmacodynamic relationship between propofol Ce and severe airway obstruction. Propofol Ce for severe airway obstruction can be predicted for individual OSAHS patients with different AHI values, and patients with high AHI values need more attention in order to maintain airway patency during propofol-induced sedation.


 XML Download