Journal List > Yonsei Med J > v.56(5) > 1031620

Hwang, Shin, Kim, Yang, Byun, Lee, Kim, Im, and Lee: Focal Lymphocytic Thyroiditis Nodules Share the Features of Papillary Thyroid Cancer on Ultrasound

Abstract

Purpose

It is often difficult to discriminate focal lymphocytic thyroiditis (FLT) or adenomatous hyperplasia (AH) from thyroid cancer if they both have suspicious ultrasound (US) findings. We aimed to make a predictive model of FLT from papillary thyroid cancer (PTC) in suspicious nodules with benign cytologic results.

Materials and Methods

We evaluated 214 patients who had undergone fine-needle aspiration biopsy (FNAB) and had shown thyroid nodules with suspicious US features. PTC was confirmed by surgical pathology. FLT and AH were confirmed through more than two separate FNABs. Clinical and biochemical findings, as well as US features, were evaluated.

Results

Of 214 patients, 100 patients were diagnosed with PTC, 55 patients with FLT, and 59 patients with AH. The proportion of elevated thyrotropin (TSH) levels (p=0.014) and thyroglobulin antibody (Tg-Ab) or thyroid peroxidase antibody (TPO-Ab) positivity (p<0.001) in the FLT group was significantly higher than that in the PTC group. Regarding US features, absence of calcification (p=0.006) and "diffuse thyroid disease" (DTD) pattern on US (p<0.001) were frequently seen in the FLT group. On multivariate analysis, Tg-Ab positivity, presence of a DTD pattern on US, and absence of calcification in nodules were associated with FLT with the best specificity of 99% and positive predictive value of 96%. In contrast, a taller than wide shape of nodules was the only variable significant for differentiating AH from PTC.

Conclusion

Suspicious thyroid nodules with cytologic benign results could be followed up with US rather than repeat FNAB, if patients exhibit Tg-Ab positivity, no calcifications in nodules, and a DTD pattern on US.

INTRODUCTION

Thyroid nodules are common worldwide, and the prevalence of palpable thyroid nodules is 4-7% among adult populations.12 With the increased usage of ultrasound (US) in medical practice, an increasing number of nonpalpable thyroid nodules are detected in 20-67% of the general population.34 The majority of patients with thyroid nodules can be managed over time, justifying efforts to select better candidates for thyroidectomy, because approximately 5% of thyroid nodules may have malignancy.56 Many studies have suggested US criteria that could be used to determine malignancy from benign lesions,78 although none of them have shown significant impact on clinical practice, despite the wide acceptance and usefulness of the suggested criteria.9
Fine-needle aspiration biopsy (FNAB) is considered to be the best diagnostic tool for determining malignant from benign nodules. However, FNAB also has a relatively high false-negative rate, ranging from 0.7 to 21%.101112 This often leads to a question of whether a repeat aspiration should be performed or whether follow-up with US should be performed on suspicious thyroid nodules.1314
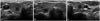
US findings of lymphocytic thyroiditis or Hashimoto's thyroiditis show diffusely coarse and heterogeneous hypoechogenicity.151617 However, lymphocytic thyroiditis can be observed as a focal thyroid nodule that appears to be hypoechoic with ill-defined margins: an appearance that is indistinguishable from that of a malignant nodule (Fig. 1).51819 Therefore, we sought to identify clinical and biochemical findings, in addition to US features, that could be used to determine focal lymphocytic thyroiditis from thyroid malignancy in order to reduce the need for repetitive FNABs.

MATERIALS AND METHODS

Patients

We retrospectively reviewed the medical records of 214 patients who had thyroid nodules with suspicious features for malignancy and had undergone US-guided FNAB between January 2005 and December 2010 at Severance Hospital, Seoul, Korea. First, we selected 55 patients (mean age, 54.1 years; range, 26-74 years) who were diagnosed with focal lymphocytic thyroiditis (FLT), and 59 patients (mean age, 54.4 years; range, 28-77 years) diagnosed with adenomatous hyperplasia (AH) by two or more repeat FNABs on thyroid nodules with suspicious features for malignancy on US. Then we selected 100 papillary thyroid cancer (PTC) patients who were diagnosed based on surgical pathology after the initial US-guided FNAB, matched for sex and age±5 (mean age, 52.5 years; range, 29-82 years) with the FLT group or the AH group. We retrospectively reviewed the US, cytological, and pathological results of the patients. Hashimoto's thyroiditis is widely known and defined as elevated thyrotropin (TSH), as well as antithyroid peroxidase antibody (TPO-Ab) positivity and/or antithyroglobulin antibody (Tg-Ab) positivity in serum. Only 1 patient with PTC and 2 patients with AH received treatment for thyroid diseases with levothyroxine, and among 4 patients who had FLT, three were treated with levothyroxine and one with methimazole.

Laboratory and imaging tests

Thyroid functions were measured by radioimmunoassay using T3-CTK (Diasorin SpA, Saluggia, Italy) for T3 and Amerlex-MAB* FT4 kit (Trinity Biotech PLC, Wicklow, Ireland) for free T4. Serum TSH level was determined by immunoradiometric assay using TSH-CTK-3 kit (Diasorin SpA, Saluggia, Italy). The reference ranges were 98-180 ng/dL for T3, 0.73-1.95 ng/dL for FT4 and 0.3-4.0 µIU/mL for TSH. Serum anti-thyroglobulin (Tg-Ab) and thyroid peroxidase antibodies (TPO-Ab) were both determined by the Brahms RIA-Kit (BRAHMS AG, Hennigsdorf, Germany) and the reference ranges were 0-60 IU/mL.
US or US-guided FNAB were performed using a 5-12 MHz linear probe (iU22; Philips Medical Systems, Bothell, WA, USA), a 7-15 MHz linear probe (HDI 5000; Philips Medical Systems, Bothell, WA, USA), or an 8-15 MHz linear probe (Acuson Sequoia; Siemens Medical Solutions, Mountain View, CA, USA). Key features for "suspicious for malignancy" on US include microcalcification, irregular or microlobulated margin, hypoechogenicity, and taller than wide in shape (i.e., greater anteroposterior dimension than transverse dimension).2021 "Diffuse thyroid disease" (DTD) pattern was defined as diffusely heterogeneous hypoechogenicity on sonography.22 US-guided FNAB was performed with a 23-gauge needle attached to a 20-mL disposable plastic syringe. Materials obtained from the aspiration biopsy were transferred onto glass slides and then placed immediately in 95% alcohol for Papanicolaou staining. AH was diagnosed if the cytology revealed the presence of colloids and varying numbers of follicular cells, and lymphocytic thyroiditis was diagnosed if there were follicular cells with scattered background lymphocytes.523

Statistical analysis

All statistical analysis was performed using PASW v. 18.0 for Windows (SPSS Inc., Chicago, IL, USA). Comparisons were performed by chi-square test or Fisher's exact test for categorical variables and Student t-test or Mann-Whitney U test for continuous variables. For multiple comparisons, the ANOVA with post hoc Bonferroni procedure was performed. To categorize serum TSH levels, we searched the best cut-off point for differentiating between PTC and FLT using receiver operating characteristic (ROC) curve analysis, which was 2.50 µIU/mL, with a sensitivity of 53% and specificity of 80%.
To differentiate between FLT and PTC, a logistic regression model with the backward stepwise method was used. The significant variables identified in an univariate analysis were subsequently entered into a multivariate analysis. In this model, the least statistically significant variables were removed one at a time until only independent variables with a preset p value≤ 0.1 were retained. All p values<0.05 were considered significant.

RESULTS

Baseline characteristics according to FLT, AH, and PTC

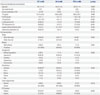
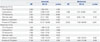
Table 1 shows the clinical, biochemical, and US characteristics of the three groups. TSH levels and the frequency of Tg-Ab and TPO-Ab positivity were significantly different among the groups. In terms of US features, the proportions of taller than wide shape, calcification of nodules, and DTD pattern on US were significantly different among the groups. In comparisons between the FLT and PTC groups, as expected, TSH levels (p=0.014), Tg-Ab or TPO-Ab positivity (p<0.001), and the proportions of patients taking thyroid medications (p=0.034) and having Hashimoto's thyroiditis (p<0.001) were significantly higher in the FLT group than the PTC group. Among US features, absence of calcification (p=0.006) and DTD pattern on US (p<0.001) were more frequently seen in the FLT group than the PTC group. The irregularity of margins, echogenicity, pattern of calcifications, and cystic degeneration in nodules did not differ between the FLT group and the PTC group. However, in comparisons between the AH group and the PTC group, nodule size was larger (p=0.029) and the proportion of a taller than wide shape of nodules was lower (p<0.001) in the AH group than the PTC group.

Comparison between the FLT group and the PTC groups according to nodule size

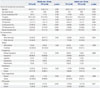
Next, we evaluated whether differences in these variables between the FLT group and the PTC groups differed according to nodule size (<10 mm or ≥10 mm) (Table 2). In terms of thyroid function, TSH levels were elevated in the FLT group, compared with the PTC group, regardless of nodules size. However, US features were different according to nodule size. In small nodules <10 mm, the echogenicity of nodules (p=0.045) and DTD pattern on US (p<0.001) differed significantly between the FLT group and the PTC groups. In contrast, among large nodules ≥10 mm, the FLT group showed a higher proportion of absence of calcification in thyroid nodules (p=0.010) and a DTD pattern on US (p=0.001) than the PTC group.

Univariate and multivariate analysis

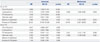
Table 3 shows the odds ratio (OR) with 95% confidence interval (CI) for the characteristics more frequently seen in the FLT group or the AH group, compared with the PTC group, regardless of nodule size. On univariate analysis, the variables associated with FLT were TSH >2.50 µIU/mL (OR=4.462, p<0.001) and Tg-Ab (OR=9.118, p<0.001) and TPO-Ab positivity (OR=4.136, p< 0.001). Regarding US features, absence of calcification in nodules (OR=2.897, p=0.007) and presence of a DTD pattern on US (OR=36.231, p<0.001) were associated with FLT rather than PTC. On multivariate analysis by the conditional backward method, Tg-Ab positivity, absence of calcification in nodules, and presence of a DTD pattern on US were significant. In contrast, nodules with a taller than wide shape showed significantly lower odds in prediction for AH in both univariate (OR=0.292, p=0.001) and multivariate (OR=0.288, p=0.001) analysis, suggesting that taller than wide shape is associated more with PTC rather than AH.
However, the variables associated with FLT were different according to nodule size (Table 4). In small nodules <10 mm, Tg-Ab positivity (OR=4.985, p=0.027) and presence of a DTD pattern on US (OR=29.265, p<0.001) were significantly associated with FLT in multivariate analysis. In contrast, absence of calcification (OR=12.487, p=0.042) and presence of a DTD pattern on US (OR=17.079, p=0.004) remained significant in large FLTs ≥10 mm.

Diagnostic predictor model to differentiate FLT from PTC

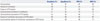
To determine which variables can differentiate FLT from PTC, a standard set of predictive measures was calculated for each variable or the combination of all three variables of Tg-positivity, absence of calcification, and presence of a DTD pattern on US (Table 5). The presence of the DTD pattern on US showed, individually, the best specificity of 91% and positive predictive value (PPV) of 83%. In combination analysis of variables, the combination of three variables showed the best specificity of 99% and PPV of 96%, but a low sensitivity of 45%.

DISCUSSION

Many studies have attempted to investigate a useful indicator of thyroid malignancy based on US findings. However, micronodules of lymphocytic thyroiditis can increase in size and be present hypoechoic or hyperechoic nodules with ill-defined margins on US.51819 Therefore, focal thyroiditis is indistinguishable from thyroid cancer or lymphoma. These so-called pseudotumors constituted 36% of the nodules of focal thyroiditis detected by US.5 However, specific US features of focal thyroiditis are not well established.
In the present study, we aimed to identify the characteristics that would clearly distinguish FLT from malignancy, especially those showing suspicious features on US, and to make a diagnostic model for FLT. First, we grouped the patients according to diagnostic criteria by following cytologic confirmation of benign nodules, such as lymphocytic thyroiditis or AH by two or more FNABs. This is based on the previous reports that if the repeat cytological results were both "benign", the risk of malignancy was very low (3.1%).7 Then, we compared clinical and biochemical parameters, in addition to US features, between FLT or AH and PTC.
Among US findings, nodules with a taller-than-wide shape was the only variable significantly different between AH and PTC in this study. This result is also consistent with previous studies that a taller-than-wide shape is the best predictor for malignancy.2124 In contrast, it is a task of great significance to identify the parameters to differentiate between FLT and PTC because many FLTs could have suspicious features on US. We found that the combination of three variables, including Tg-Ab positivity, absence of calcification in nodules, and presence of a DTD pattern on US, was the strongest predictor for FLT. However, the sensitivity was only 45%. This may be because absence of calcification in nodules had low specificity of 42% for FLT. Calcification has been noted in 23.8% of patients with focal thyroiditis, which is a greater concern for malignancy.25 In the present study, 20% of FLTs had calcification, which could indicate malignancy. Therefore, absence or presence of calcification in nodules showed relatively low predictive value for FLT.
Lymphocytic thyroiditis shows diffuse heterogeneous hypoechogenicity on US, which appeared as a DTD pattern on US in our study. This feature is not specific to lymphocytic thyroiditis and may be observed in multinodular goiters, autoimmune thyroid disease, and subacute thyroiditis.81526 Although a DTD pattern on US is a nonspecific presentation for lymphocytic thyroiditis, a DTD pattern on US was the strongest predictor for FLT, individually, in the present study. It is less clear whether autoimmunity is the cause or effect of thyroid malignancy. In the present study, Tg-Ab positivity showed a significantly greater association with FLT than PTC. Meanwhile, TPO-Ab positivity was also associated with FLT in univariate analysis, but it was removed in multivariate analysis. Nevertheless, our results do not suggest that only seropositivity or seronegativity of Tg-Ab is correlated with PTC.
Recently, guidelines have recommended different managements based on nodule size.20 Our study also showed different predictors for FLT according to nodule size. Based on our results, absence or presence of calcification in small nodules <10 mm could not predict FLT or malignancy. Tg-Ab positivity and DTD pattern on US were only associated with small FLT.
There are several limitations in this study. First, selection bias was inevitable. Second, this study took samples from a small number of patients, because we selected patients who were diagnosed by two or more repeat FNABs. Third, we did not analyze intranodular vascularity, which has been shown to be associated with a risk of malignancy.27
In conclusion, suspicious thyroid nodules with benign cytologic results on initial FNAB could be followed-up with US, if there are seropositivity of Tg-Ab, no calcifications in nodules, and presence of a DTD pattern on US. Our study provides useful information as a tool for management decision making and to reduce the need for repetitive FNABs in thyroid nodules with discordant results between benign cytology and suspicious US features.

Figures and Tables

Fig. 1

Examples of nodules suspected as malignant on US findings. (A) A 6-mm suspicious nodule (delineated by electronic calipers) was found on the right thyroid gland, and PTC was confirmed by surgical pathology. (B) A 7-mm suspicious nodule (delineated by electronic calipers) was found on the right thyroid gland and was cytologically confirmed as FLT more than twice by FNAB. The thyroid gland showed diffuse heterogeneous echogenicity, a characteristic finding of the DTD pattern of thyroid gland on US. (C) There was a 6-mm suspicious nodule (delineated by electronic calipers) on the left thyroid gland, which was cytologically confirmed as AH more than twice by FNAB. PTC, papillary thyroid cancer; FLT, focal lymphocytic thyroiditis; AH, adenomatous hyperplasia; FNAB, fine needle aspiration biopsy; DTD pattern, "diffuse thyroid disease" pattern on US; US, ultrasound.

ymj-56-1338-g001
Table 1

Baseline Characteristics According to Cytological Diagnosis

ymj-56-1338-i001
FLT (n=55) AH (n=59) PTC (n=100) p value
Clinical and biochemical characteristics
 Age (yrs) 54.1±11.3 54.4±11.5 52.5±11.4 0.500
 Sex (male:female) 4:51 3:56 8:92 0.782
 Current medications (%)§ 4 (7.3)* 2 (3.4) 1 (1.0) 0.110
 T3 (ng/dL) 151.4±42.8 143.6±26.8 150.2±34.2 0.485
 FreeT4 (ng/dL) 1.3±1.1 1.4±1.3 1.55±1.44 0.510
 TSH (µIU/mL) 5.5±10.5* 1.8±1.3 1.89±1.31 <0.001
 Tg-Ab positive (%) 33 (63.5) 7 (12.3) 16 (16.0) <0.001
 TPO-Ab positive (%) 28 (53.8) 6 (10.7) 22 (22.0) <0.001
 Largest nodule diameter (mm) 7.5±4.7 10.1±6.5* 8.9±4.9 0.035
 Hashimoto's thyroiditis (%) 28 (50.9) 3 (5.1) 9 (9.0) <0.001
US characteristics
 Shape
  Taller than wide 28 (50.9) 16 (27.1) 56 (56) 0.002
  Wider than tall 27 (49.1) 43 (72.9) 44 (44)
 Margin
  Well-defined 0 (0.0) 3 (5.1) 1 (1.0) 0.091
  Ill-defined 55 (100.0) 56 (94.9) 99 (99.0)
 Echogenicity
  Marked hypoechoic 5 (9.1) 1 (1.7) 4 (4.0) 0.352
  Hypoechoic 45 (81.8) 54 (91.5) 91 (91.0)
  Isoechoic 3 (5.5) 1 (1.7) 2 (2.0)
  Hyperechoic 2 (3.6) 1 (1.7) 1 (1.0)
  Mixed echoic 0 (0.0) 2 (3.4) 2 (2.0)
 Calcification
  Absence 44 (80.0)†∥ 29 (49.2) 58 (58.0) 0.005
  Micro 2 (3.6) 15 (25.4) 20 (20.0)
  Macro 6 (11.0) 7 (11.8) 18 (18.0)
  Mixed 2 (3.6) 6 (10.2) 4 (4.0)
  Rim 1 (1.8) 2 (3.4) 0 (0.0)
 Cystic degeneration
  Present 0 (0.0) 0 (0.0) 2 (2.0) 0.316
  Absent 55 (100.0) 59 (100.0) 98 (98.0)
 DTD pattern
  Present 43 (78.2) 6 (10.2) 9 (9.0) <0.001
  Absent 12 (21.8) 53 (89.8) 91 (91.0)

FLT, focal lymphocytic thyroiditis; AH, adenomatous hyperplasia; PTC, papillary thyroid cancer; US, ultrasound; DTD pattern, "diffuse thyroid disease" pattern on US; TSH, thyrotropin; Tg-Ab, thyroglobulin antibody; TPO-Ab, thyroid peroxidase antibody.

Data are mean±SD or number of patients (%). p value by one-way ANOVA for continuous variables and χ2-test for categorical variables.

*p<0.05, p<0.01, ††p<0.001, the comparison of the FLT or AH group with the PTC group, §The portion of the patients treated with levothyroxine or anti-thyroid drugs, Comparison between the absence and the presence of calcification.

Table 2

Clinical, Biochemical, and Sonographic Characteristics of the FLT Group, Compared with the PTC Group, According to Nodule Size

ymj-56-1338-i002
Nodule size <10 mm Nodule size ≤10 mm
FLT (n=45) PTC (n=66) p value FLT (n=10) PTC (n=34) p value
Clinical and biochemical characteristics
 Age (yrs) 54.0±11.3 51.6±11.4 0.281 54.9±11.9 54.2±11.3 0.815
 Sex (male:female) 4:41 3:63 0.355 10:0 29:5 0.573
 Current medications (%)* 3 (6.7) 1 (1.5) 0.153 1 (10.0) 0 (0.0) 0.233
 T3 (ng/dL) 156.3±43.5 147.5±35.1 0.284 120.3±20.3 155.5±32.4 0.012
 FreeT4 (ng/dL) 1.4±1.2 1.4±1.2 0.978 0.8±0.3 1.8±1.8 0.001
 TSH (µIU/mL) 5.7±11.2 1.9±1.4 0.033 4.8±6.7 1.8±1.2 0.044
 Tg-Ab positive (%) 27 (64.3) 6 (9.1) <0.001 6 (60.0) 10 (29.4) 0.133
 TPO-Ab positive (%) 23 (54.8) 12 (18.2) <0.001 5 (50.0) 10 (29.4) 0.271
 Nodule diameter (mm) 6.0±2.0 6.1±1.6 0.858 14.4±0.7 14.4±0.5 0.553
US characteristics
 Shape
  Taller than wide 25 (55.6) 48 (72.7) 0.061 3 (30.0) 8 (23.5) 0.692
  Wider than tall 20 (44.4) 18 (27.3) 7 (70.0) 26 (76.5)
 Margin
  Well-defined 0 (0.0) 0 (0.0) 1.000 0 (0.0) 1 (2.9) 1.000
  Ill-defined 45 (100.0) 66 (100.0) 10 (100.0) 33 (97.1)
 Echogenicity
  Marked hypoechoic 5 (11.1) 1 (1.5) 0.045 0 (0.0) 3 (8.8) 0.668
  Hypoechoic 36 (80.0) 63 (95.9) 9 (90.0) 28 (82.4)
  Isoechoic 2 (4.4) 1 (1.5) 1 (10.0) 1 (2.9)
  Hyperechoic 2 (4.4) 0 (0.0) 0 (0.0) 1 (2.9)
  Mixed echoic 0 (0.0) 1 (1.5) 0 (0.0) 1 (2.9)
 Calcification
  Present 10 (22.2) 22 (33.3) 0.204 1 (10.0) 20 (58.8) 0.010
  Absent 35 (77.8) 44 (66.7) 9 (90.0) 14 (41.2)
 Cystic degeneration
  Present 0 (0.0) 1 (1.5) 0.407 0 (0.0) 1 (2.9) 1.000
  Absent 45 (100.0) 65 (98.5) 10 (100.0) 33 (97.1)
 DTD pattern
  Present 36 (80.0) 5 (7.6) <0.001 7 (70.0) 4 (11.8) 0.001
  Absent 9 (20.0) 61 (92.4) 3 (30.0) 30 (88.2)

PTC, papillary thyroid cancer; FLT, focal lymphocytic thyroiditis; TSH, thyrotropin; Tg-Ab, thyroglobulin antibody; TPO-Ab, thyroid peroxidase antibody; DTD pattern, "diffuse thyroid disease" pattern on US; US, ultrasound.

Data are mean±SD or number of patients (%). p value by Student's t-test or Mann-Whitney U test for continuous variables and χ2-test or Fisher exact test for categorical variables.

*The portion of the patients treated with levothyroxine or anti-thyroid drugs.

Table 3

Univariate and Multivariate Analysis among Groups

ymj-56-1338-i003
Univariate Multivariate
OR 95% CI p value OR 95% CI p value
FLT vs. PTC
 TSH>2.50 µIU/mL 4.462 2.169-9.178 <0.001
 Tg-Ab positivity 9.118 4.191-19.841 <0.001 3.036 1.060-8.696 0.039
 TPO-Ab positivity 4.136 2.010-8.514 <0.001
 Taller than wider 0.815 0.421-1.576 0.543
 Absence of calcification 2.897 1.340-6.261 0.007 3.781 1.182-12.097 0.025
 Presence of DTD pattern 36.231 14.192-92.500 <0.001 24.519 8.597-69.925 <0.001
AH vs. PTC
 TSH>2.50 µIU/mL 0.917 0.404-2.077 0.835
 Tg-Ab positivity 0.735 0.283-1.909 0.527
 TPO-Ab positivity 0.425 0.161-1.122 0.084 0.427 0.157-1.163 0.096
 Taller than wider 0.292 0.146-0.587 0.001 0.288 0.140-0.590 0.001
 Absence of calcification 0.700 0.367-1.336 0.280
 Presence of DTD pattern 1.145 0.386-3.395 0.808

FLT, focal lymphocytic thyroiditis; PTC, papillary thyroid cancer; AH, adenomatous hyperplasia; TSH, thyrotropin; Tg-Ab, thyroglobulin antibody; TPO-Ab, thyroid peroxidase antibody; DTD pattern, "diffuse thyroid disease" pattern on US; OR, odds ratio; CI, confidence interval; US, ultrasound.

Table 4

Univariate and Multivariate Analysis between the FLT Group and the PTC Group According to Nodule Size

ymj-56-1338-i004
Univariate Multivariate
OR 95% CI p value OR 95% CI p value
Nodule size<10 mm
 TSH>2.50 µIU/mL 3.883 1.692-8.911 0.001
 Tg-Ab positivity 18.99 6.298-51.441 <0.001 4.985 1.201-20.689 0.027
 TPO-Ab positivity 5.447 2.278-13.029 <0.001
 Taller than wider 0.469 0.211-1.043 0.063 0.337 0.091-1.243 0.102
 Absence of calcification 1.750 0.734-4.174 0.207
 Presence of DTD pattern 48.800 15.172-156.958 <0.001 29.265 7.788-109.970 <0.001
Nodule size≥10 mm
 TSH>2.50 µIU/mL 7.000 1.498-32.720 0.013
 Tg-Ab positivity 3.600 0.832-15.572 0.086
 TPO-Ab positivity 2.400 0.567-10.155 0.234
 Taller than wider 1.393 0.290-6.679 0.679
 Absence of calcification 12.857 1.459-113.278 0.021 12.487 1.093-142.673 0.042
 Presence of DTD pattern 17.500 3.171-96.575 0.001 17.079 2.464-118.388 0.004

FLT, focal lymphocytic thyroiditis; PTC, papillary thyroid cancer; TSH, thyrotropin; Tg-Ab, thyroglobulin antibody; TPO-Ab, thyroid peroxidase antibody; DTD pattern, "diffuse thyroid disease" pattern on US; OR, odds ratio; CI, confidence interval; US, ultrasound.

Table 5

Predictor Model of FLT from PTC Based on Individual or Combined Variables

ymj-56-1338-i005
Sensitivity (%) Specificity (%) PPV (%) NPV (%)
Tg-Ab positivity 63 84 67 82
Absence of calcification 80 42 43 79
Presence of DTD pattern 79 91 83 88
Tg-Ab positivity and absence of calcification 51 92 78 77
Tg-Ab positivity and presence of DTD pattern 55 96 88 79
Absence of calcification and presence of DTD pattern 65 96 90 83
Tg-Ab positivity, absence of calcification, and presence of DTD pattern 45 99 96 77

FLT, focal lymphocytic thyroiditis; PTC, papillary thyroid cancer; Tg-Ab, thyroglobulin antibody; DTD pattern, "diffuse thyroid disease" pattern on US; PPV, positive predictive value; NPV, negative predictive value; US, ultrasound.

Notes

The authors have no financial conflicts of interest.

References

1. Mortensen JD, Woolner LB, Bennett WA. Gross and microscopic findings in clinically normal thyroid glands. J Clin Endocrinol Metab. 1955; 15:1270–1280.
2. Singer PA. Evaluation and management of the solitary thyroid nodule. Otolaryngol Clin North Am. 1996; 29:577–591.
3. Mazzaferri EL. Management of a solitary thyroid nodule. N Engl J Med. 1993; 328:553–559.
4. Ross DS. Nonpalpable thyroid nodules--managing an epidemic. J Clin Endocrinol Metab. 2002; 87:1938–1940.
5. Langer JE, Khan A, Nisenbaum HL, Baloch ZW, Horii SC, Coleman BG, et al. Sonographic appearance of focal thyroiditis. AJR Am J Roentgenol. 2001; 176:751–754.
6. Hegedüs L. Clinical practice. The thyroid nodule. N Engl J Med. 2004; 351:1764–1771.
7. Kim EK, Park CS, Chung WY, Oh KK, Kim DI, Lee JT, et al. New sonographic criteria for recommending fine-needle aspiration biopsy of nonpalpable solid nodules of the thyroid. AJR Am J Roentgenol. 2002; 178:687–691.
crossref
8. Peccin S, de Castsro JA, Furlanetto TW, Furtado AP, Brasil BA, Czepielewski MA. Ultrasonography: is it useful in the diagnosis of cancer in thyroid nodules? J Endocrinol Invest. 2002; 25:39–43.
crossref
9. Hegedüs L. Thyroid ultrasonography as a screening tool for thyroid disease. Thyroid. 2004; 14:879–880.
crossref
10. Ylagan LR, Farkas T, Dehner LP. Fine needle aspiration of the thyroid: a cytohistologic correlation and study of discrepant cases. Thyroid. 2004; 14:35–41.
crossref
11. Sangalli G, Serio G, Zampatti C, Bellotti M, Lomuscio G. Fine needle aspiration cytology of the thyroid: a comparison of 5469 cytological and final histological diagnoses. Cytopathology. 2006; 17:245–250.
crossref
12. Raab SS, Vrbin CM, Grzybicki DM, Sudilovsky D, Balassanian R, Zarbo RJ, et al. Errors in thyroid gland fine-needle aspiration. Am J Clin Pathol. 2006; 125:873–882.
crossref
13. Shin JH, Han BK, Ko K, Choe YH, Oh YL. Value of repeat ultrasound-guided fine-needle aspiration in nodules with benign cytological diagnosis. Acta Radiol. 2006; 47:469–473.
crossref
14. Chernyavsky VS, Shanker BA, Davidov T, Crystal JS, Eng O, Ibrahim K, et al. Is one benign fine needle aspiration enough? Ann Surg Oncol. 2012; 19:1472–1476.
crossref
15. Marcocci C, Vitti P, Cetani F, Catalano F, Concetti R, Pinchera A. Thyroid ultrasonography helps to identify patients with diffuse lymphocytic thyroiditis who are prone to develop hypothyroidism. J Clin Endocrinol Metab. 1991; 72:209–213.
crossref
16. Pedersen OM, Aardal NP, Larssen TB, Varhaug JE, Myking O, Vik-Mo H. The value of ultrasonography in predicting autoimmune thyroid disease. Thyroid. 2000; 10:251–259.
17. Raber W, Gessl A, Nowotny P, Vierhapper H. Thyroid ultrasound versus antithyroid peroxidase antibody determination: a cohort study of four hundred fifty-one subjects. Thyroid. 2002; 12:725–731.
18. Yeh HC, Futterweit W, Gilbert P. Micronodulation: ultrasonographic sign of Hashimoto thyroiditis. J Ultrasound Med. 1996; 15:813–819.
crossref
19. Takashima S, Matsuzuka F, Nagareda T, Tomiyama N, Kozuka T. Thyroid nodules associated with Hashimoto thyroiditis: assessment with US. Radiology. 1992; 185:125–130.
crossref
20. American Thyroid Association (ATA) Guidelines Taskforce on Thyroid Nodules and Differentiated Thyroid Cancer. Cooper DS, Doherty GM, Haugen BR, Kloos RT, Lee SL, et al. Revised American Thyroid Association management guidelines for patients with thyroid nodules and differentiated thyroid cancer. Thyroid. 2009; 19:1167–1214.
21. Cappelli C, Castellano M, Pirola I, Gandossi E, De Martino E, Cumetti D, et al. Thyroid nodule shape suggests malignancy. Eur J Endocrinol. 2006; 155:27–31.
crossref
22. Shin DY, Kim EK, Lee EJ. Role of ultrasonography in outcome prediction in subclinical hypothyroid patients treated with levothyroxine. Endocr J. 2010; 57:15–22.
23. Nguyen GK, Lee MW, Ginsberg J, Wragg T, Bilodeau D. Fine-needle aspiration of the thyroid: an overview. Cytojournal. 2005; 2:12.
24. Cappelli C, Pirola I, Cumetti D, Micheletti L, Tironi A, Gandossi E, et al. Is the anteroposterior and transverse diameter ratio of nonpalpable thyroid nodules a sonographic criteria for recommending fine-needle aspiration cytology? Clin Endocrinol (Oxf). 2005; 63:689–693.
crossref
25. Takashima S, Fukuda H, Nomura N, Kishimoto H, Kim T, Kobayashi T. Thyroid nodules: re-evaluation with ultrasound. J Clin Ultrasound. 1995; 23:179–184.
26. Hayashi N, Tamaki N, Konishi J, Yonekura Y, Senda M, Kasagi K, et al. Sonography of Hashimoto's thyroiditis. J Clin Ultrasound. 1986; 14:123–126.
crossref
27. Bastin S, Bolland MJ, Croxson MS. Role of ultrasound in the assessment of nodular thyroid disease. J Med Imaging Radiat Oncol. 2009; 53:177–187.
crossref
TOOLS
Similar articles