Journal List > Yonsei Med J > v.56(5) > 1031612

Ke, Yuan, Ma, Zhang, Guo, and Xiong: IL-10 Polymorphisms and Tuberculosis Susceptibility: An Updated Meta-Analysis

Abstract

Purpose

The association of interleukin-10 (IL-10) polymorphisms (-1082G/A, -819C/T, -592A/C) and interleukin-6 (IL-6) poly-morphisms (-174G/C) with tuberculosis (TB) risk has been widely reported. However, the results are controversial. To clarify the role of these polymorphisms in TB, we performed a meta-analysis of all available and relevant published studies.

Materials and Methods

Based on comprehensive searches of the PubMed, Medline, Embase, Web of Science, Elsevier Science Direct and Cochrane Library database, we identified outcome data from all articles estimating the association between IL-10 and IL-6 polymorphisms and TB risk.

Results

The results indicated significant association of the allele model, heterozygous model and dominant model of IL-6 -174G/C polymorphism with decreased risk of TB. In the stratified analysis by ethnicity, significantly increased risk was observed for IL-10 -1082G/A polymorphism in Europeans under recessive model, for IL-10 -819C/T polymorphism in Asians under heterozygous model and dominant model and IL-10 -592A/C polymorphism in Asians under Allele model, homozygous model and recessive model. Moreover, significantly decreased risk of TB was associated with Asians for IL-6 -174C/G polymorphism in allele model, heterozygous model and dominant model. We also performed the analyses by sample types in IL-10 -1082G/A polymorphism, and observed significantly increased TB risk in mixed group under homozygous model.

Conclusion

The results suggested that the IL-10 -1082G/A polymorphism is associated with increased TB risk in Europeans, while IL-10 -819C/T and IL-10 -592A/C polymorphisms in Asians. However, IL-6 -174G/C polymorphism might be a genetic risk factor that decreases TB susceptibility in Asians.

INTRODUCTION

Tuberculosis (TB) is one of the important leading causes of death in humans, and it remains a serious public health obstacle in the developing countries. It is estimated that 1.4 million people annually die due to this treatable disease and 9 million incident cases of TB are estimated globally.1 According to the report, Mycobacterium tuberculosis (MTB) infect about one-third of population; however, only approximately one-tenth of those infected will ever develop active TB, which indicate that MTB infection is the result of the interplay between host genetic susceptibility and environmental factors.2
Interleukin-10 (IL-10) is a multifunctional regulatory cytokine of inflammatory responses. Increasing numbers of studies3 have demonstrated that IL-10 acts as a general inhibitor of proliferative and cytokine responses of both T helper (Th) 1 and Th2 cells in vitro and in vivo. IL-10 plays an anti-inflammatory action by suppressing the production of cytokines such as IL-1α, IL-1β, IL-6, IL-8, IL-12, and tumor necrosis factor-alpha in activated macrophage and interferon gamma in T cells. The IL-10 gene is located on chromosome 1 (1q31-1q32) with five exons. The promoter region of IL-10 gene has been found to be highly polymorphic and its many polymorphisms have been identified.4 In the past few years, the impact of three common polymorphisms in the promoter of IL-10 gene -592A/C, -1082 G/A, and -819C/T on susceptibility to TB have been reported, and results suggested that these polymorphisms contribute to the risk of TB by affecting IL-10 transcription level, but the findings are controversial.
The human interleukin-6 (IL-6) gene is located at 7p21-24 locus with an upstream promoter containing 303 bp. IL-6 is a pleiotropic cytokine, secreted as a T-cell derived factor by a variety of cell types including lymphocytes, monocytes, and endothelial cells. It has endocrine as well as paracrine and autocrine actions implicated in several physiologic and pathologic processes including immunity and inflammation, activation of fibroblasts, mast cells, endothelial cells, monocytes, and keratinocytes.5 Furthermore, the genetic polymorphism in the IL-6 promoter (-174G/C) that influences its transcription rate might play a crucial role in host immunity and susceptibility to TB.6
A relatively large number of studies found the association between IL-10 and IL-6 polymorphisms and TB risk, however, the results have been inconsistent and inconclusive due to limited sample sizes and different study populations. Therefore, we performed this meta-analysis on all eligible case-control studies to estimate the effect of polymorphisms in the IL-10 and IL-6 genes on the risk of TB.

MATERIALS AND METHODS

Identification of relevant studies

Relevant publications were identified with a literature search using terms "IL-10" or "Interleukin-10" or "IL-6" or "Interleukin-6" and "tuberculosis" or "TB" or "TB infection" or "TB disease" and "polymorphism" or "genotype" or "variant" in the PubMed, Medline, Embase, Web of Science, Elsevier Science Direct and Cochrane Library database (the last search update was 1 February 2014), and the search was limited to English-language journals. Additional studies were identified by a manual search of the references of original studies. The following criteria were used for inclusion in the analysis: 1) a case-control or cohort design was used and 2) studies contained available genotype frequencies. The major reasons for exclusion of studies were: no usable data were reported.

Data extraction and quality assessment

Two investigators independently extracted data and jointly reached a consensus on all of the studies researched. The following data were collected from each study: first author's name, publication year, original country, ethnicity, number of cases and controls, genotype frequencies for cases and controls, Hardy-Weinberg equilibrium (HWE) of controls and Newcastle-Ottawa Scale (NOS).7 Star symbol was used to denote the quality, based on 3 aspects of the study: selection, comparability, and exposure. Studies with a score of 7 stars or greater were considered to be of high quality.

Statistical analysis

The risks [odds ratios (ORs), and 95% confidence intervals (95% CIs)] of TB associated with IL-10 and IL-6 polymorphisms were estimated for each study based on extracted genotype data. The statistical significance of the pooled OR was determined using the Z-test. Heterogeneity assumption was examined by the Cochran's Q-test. If Q-test indicated p<0.10, thus indicating a lack of heterogeneity among studies, then the fixed effect model was used (the Mantel-Haenszel method).8 Otherwise, the random-effects model (the DerSimonian and Laird method)9 was performed. Sensitivity analysis was mainly performed to assess the stability of the results, namely, a single study in the meta-analysis was deleted to reflect the influence of the individual data set on the pooled OR. Asymmetry funnel plots were inspected to assess potential publication bias. The Egger's linear regression test was also used to assess publication bias statistically. All the above statistical analyses were performed by using the software Stata Version 12.0 (Stata Corporation, College Station, TX, USA) and p values were two-tailed.

RESULTS

Literature search and characteristics of eligible studies

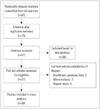
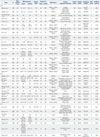
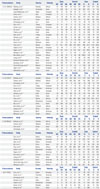
The flow chart that displays the study selection process is shown in Fig. 1. The search of the selected databases retrieved 30 potentially relevant articles, including 7800 cases and 8793 controls, according to inclusion and exclusion criteria. There are 26 case-control studies concerning IL-10 -1082G/A polymorphism,610111213141516171819202122232425262729303132333435 15 case-control studies for IL-10 -819C/T polymorphism,61014161720212224252829303236 16 case-control studies for IL-10 -592A/C polymorphism,6101415161720212425262930323336 and 7 case-control studies about IL-6 -174G/C polymorphism. 6161721253738 Among the 30 eligible studies, 14 of them were of Asians,611151819212223283031353738 6 studies were of Europeans,121316202534 6 studies were of Africans,101424272936 and 4 studies were of Americans.17263233 The NOS scores ranged from 7 to 9, indicating that the methodological quality was generally good. The detailed characteristics of the eligible studies included in this meta-analysis are shown in Table 1, and the genotype and allele distributions of all four polymorphisms are shown in Table 2. The genotype distributions among the controls of all studies were consistent with the HWE except for eight studies for the IL-10 -1082G/A,611132325272934 one study for the IL-10 -819C/T,36 three studies for the IL-10 -592A/C,143336 and two studies for the IL-6 -174G/C (Table 1).616

Quantitative synthesis

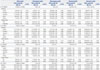
The summary of the meta-analysis for IL-10 -1082G/A, -819C/T, -592A/C, and IL-6 -174G/C polymorphisms and tuberculosis susceptibility is shown in Table 3.

Analysis of IL-10 -1082G/A and TB susceptibility

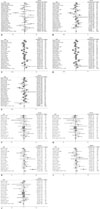
In all, twenty-six studies consisted of 5949 cases and 6948 controls, and assessed the potential influence of the IL-10 -1082G/A polymorphism with TB susceptibility. Random effects models were used to calculate the pooled OR in all genetic models. Overall, the combined results showed no significant association in all genetic models (Fig. 2A-E). In the stratified analysis by ethnicity, IL-10 -1082G/A polymorphism was associated with a significantly increased risk of TB in European group under recessive model (GG vs. AG+AA: OR=1.69, 95% CI=1.19-2.39). However, no significant association was found in American, Asian and African populations in all tested models. On subgroup analysis by sample types, significantly increased TB risk was observed under homozygous model (GG vs. AA: OR= 2.00, 95% CI=1.16-3.45) in PTB and extra-pulmonary tuberculosis (EPTB) mixed group. The results are shown in Table 3.

Analysis of IL-10 -819C/T and TB susceptibility

As for IL-10 -819C/T, there were fifteen studies involving 4207 cases and 5264 controls for data synthesis in our meta-analysis. The results showed that IL-10 -819C/T polymorphism was not significantly associated with the risk of TB in all genetic models (Fig. 2 F-J ). In the stratified analyses by ethnicity and control source for the -819C/T polymorphism, a significantly increased risk was observed among Asians in heterozygous model and dominant model (TC vs. CC: OR=1.34, 95% CI=1.02-1.77; TT+TC vs. CC: OR=1.31, 95% CI=1.01-1.70). The results are shown in Table 3.

Analysis of IL-10 -592A/C and TB susceptibility

In total, sixteen studies including 4115 cases and 5441 controls examined the relationship between the IL-10 -592A/C polymorphism and TB susceptibility. As shown in Table 3, we failed to find the association between the IL-10 -592A/C polymorphism and TB risk in all genetic models. In the stratified analyses for the IL-10 -592A/C polymorphism, a significantly increased risk was observed among Asians in allele model (A allele vs. C allele: OR=1.26, 95% CI=1.08-1.28), homozygous model (AA vs. CC: OR=1.50, 95% CI=1.07-2.12), and recessive model (AA vs. AC+CC: OR=1.33, 95% CI=1.10-1.62) (Table 3).

Analysis of IL-6 -174G/C and TB susceptibility

A total of 1138 cases and 1311 controls from seven case-control studies were included for data synthesis. A decreased risk between IL-6 -174G/C polymorphism and the risk of TB was observed in Allele model (C allele vs. G allele: OR=0.77, 95% CI=0.64-0.91), heterozygous model (CC vs. GG: OR=0.72, 95% CI=0.57-0.90), and dominant genetic model (CC+CG vs. GG: OR=0.71, 95% CI=0.57-0.88). In the stratified analysis by ethnicity, IL-6 -174G/C polymorphism was associated with a significantly decreased risk of TB in Asian populations in Allele model (C allele vs. G allele: OR=0.71, 95% CI=0.54-0.93), heterozygous model (CC vs. GG: OR=0.61, 95% CI=0.44-0.85), and dominant genetic model (CC+CG vs. GG: OR=0.63, 95% CI=0.46-0.86). The results are shown in Table 3.

Heterogeneity analysis

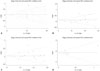
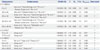
There were statistically significant heterogeneity in all genetic models for IL-10 -1082G/A polymorphism, heterozygous model and dominant model for IL-10 -819C/T polymorphism, and all genetic models except for heterozygous model for IL-10 -592A/C (Table 3). To elucidate the heterogeneity, Galbraith plots were performed in these genetic models. When the studies which were outliers in some genetic models were excluded respectively, all I2 values were less than 50%, and Pheterogeneity were greater than 0.1 (Fig. 3, Table 4). The significance of pooled OR in all genetic models was not influenced after excluding the studies. By meta-regression analysis, the heterogeneity sources were attributable to the sample types, ethnicity, control source, and the genotyping method. Ethnicity and sample types might be predominant sources of heterogeneity in IL-10 -1082G/A polymorphism, and ethnicity and control source in both IL-10 -819C/T and IL-10 -592A/C polymorphisms (Table 5).

Sensitivity analysis

Sensitivity analysis was performed by sequentially excluding individual studies, including studies which was not in agreement with HWE. Statistically similar results were obtained in all genetic models after sequentially excluding each study, indicating the stability of our data.

Publication bias

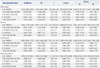
Begg's funnel plot and Egger's test were performed to assess the publication bias of included studies. The shapes of the funnel plots did not reveal any evidence of obvious asymmetry in the all genetic models. In all genetic models, Egger's test also did not show any significant statistical evidence of publication bias, indicating low risk of publication bias in this meta-analysis (Fig. 4, Table 6).

DISCUSSION

This is not the first meta-analysis to assess the associations between three polymorphisms (-1082G/A, -819C/T, and -592A/C) in the IL-10 gene promoter and the risk of TB. We found that the results of our meta-analysis are inconsistent with a recent study of Liang, et al.39 in which some following shortcomings were found : 1) the NOS scores of 3 Chinese articles included were lower than 7 stars through quality assessment, 2) two studies that meet the inclusion criterion were excluded (Ma, et al.,28 Spinassé, et al.32), 3) the choice of genetic models was incorrect, 4) heterogeneity analysis and sensitivity analysis were missing, and 5) some extracted data was not accurate enough. Therefore, we performed this meta-analysis to examine the association between three IL-10 and IL-6 polymorphisms and TB risk again. Our meta-analysis results indicated that the presence of the IL-10 -1082G/A, -819C/T, and -592A/C polymorphisms was not associated with the risk of TB in all genetic models. On the other hand, the IL-6 -174G/C polymorphism might be associated with an decreased risk of TB in some genetic models (C allele vs. G allele: OR=0.77, 95% CI=0.64-0.91, p=0.003; CC vs. GG: OR=0.72, 95% CI=0.57-0.90, p=0.005; CC+CG vs. GG: OR=0.71, 95% CI=0.57-0.88, p=0.002).
We also carried out subgroup analysis based on ethnicity, sample types and control source in consideration of obvious heterogeneity. In the stratiied analysis by ethnicity, we observed significantly increased TB risk associated with the IL-10 -1082G/A polymorphism in recessive model in Europeans, IL-10 -819C/T polymorphism in Asians in heterozygous model and dominant model, IL-10 -592A/C polymorphism in Asians in Allele model, homozygous model and recessive model respectively, and a decreased TB risk associated with IL-6 -174G/C polymorphism was found in allele model, heterozygous model and dominant model in Asians. Different genetic background and environmental exposures might contribute to this ethnic difference. Subgroup analysis based on sample types suggested that IL-10 -1082G/A polymorphism may be related with an increased risk of TB in homozygous model in the PTB+EPTB mixed sample. The results of subgroup analysis by control source revealed no signiicant association with TB susceptibility among IL-10 and IL-6 polymorphisms.
In our meta-analysis, obvious heterogeneity was observed for IL-10 -1082G/A polymorphism in all genetic models, -819C/T polymorphism in heterozygous model and dominant model, and -592A/C polymorphism in all genetic models except for heterozygous model, whereas there was no obvious heterogeneity for IL-6 -174G/C polymorphism. Then, we used the Galbraith plots to explore the sources of heterogeneity. We found that all the I2 values were less than 50% and Pheterogeneity were greater than 0.1 after excluding some studies, thus indicating that these studies might be the major source of the heterogeneity for the IL-10 -1082G/A, -819C/T, and -592A/C polymorphisms. Owing to the limited number of studies in this meta-analysis, we restricted meta-regression analysis to four factors (sample types, ethnicity, control source, and genotyping method), which are the most likely to cause the heterogeneity between studies. Although the four above-mentioned factors had no significant impact on the heterogeneity except sample types factor for IL-10 -1082G/A in homozygous model, the results of subgroup analyses revealed that the ethnicity and sample type might contribute to the potential heterogeneity.
Some limitations of this meta-analysis exist which should be considered when interpreting the present results. Firstly, heterogeneity is a potential problem when interpreting the results of meta-analysis. Significant heterogeneity existed among some comparisons, especially for IL-10 -1082G/A and -592A/C polymorphisms. Secondly, this meta-analysis included the only published studies and publication bias may occur, although our results of publication bias showed no significance. Thirdly, host genetic susceptibility, environment factors and other factors might contribute to the pathogenesis of TB. Although many other factors such as age or gender may play a profound role in the development of TB, we did not make subgroup analysis based on these factors as data is not sufficient. Finally, some genetic polymorphisms of studies deviant from HWE were included in this meta-analysis, which suggested that there was potential bias during control selection or genotyping errors.
In conclusion, our meta-analysis suggested that IL-10 -1082G/A, -819C/T, and -592A/C polymorphisms had no association with TB risk in general population, while the IL-6 -174G/C polymorphism was signiicantly associated with decreased risk of TB in all genetic models except for recessive model. In the subgroup analysis, IL-10 -1082G/A polymorphism was associated with TB risk in Europeans in recessive model, and IL-10 -592A/C polymorphisms were significantly associated with TB risk in Asians in Allele model, homozygous model and recessive model, respectively, and a decreased TB risk associated with IL-6 -174G/C polymorphism was found in allele model, heterozygous model and dominant model in Asians. Furthermore, IL-10 -1082G/A polymorphism was associated also with an increased risk of TB in homozygous model in the PTB+EPTB mixed sample. However, additional well-designed and larger scale primary studies in populations with different ethnicities are required to further evaluate the IL-10 and IL-6 gene polymorphisms with TB risk in future.

Figures and Tables

Fig. 1

Flow diagram for study selection.

ymj-56-1274-g001
Fig. 2

Forest plot of the overall risk of TB associated with the IL-10 -1082G/A and -819C/T polymorphism in all genetic models. Bars represent 95% CI and boxes represent OR values. The size of each box indicates the weight of the study in the pooled results. (F-J) T allele vs. C allele, TT vs. CC, TC vs. CC, TT+TC vs. CC, TT vs. TC+CC for -819C/T. TB, tuberculosis; IL-10, interleukin 10; CI, confidence interval; OR, odds ratio.

ymj-56-1274-g002
Fig. 3

Galbraith plot of IL-10 promoter polymorphism and TB risk. (A-E) The five studies1820223133 in G vs. A, three studies202231 in GG vs. AA, seven studies13182022313337 in AG vs. AA, six studies131820223133 in GG+AG vs. AA, and five studies2022273537 in GG vs. AG+AA were outliers for -1082G/A. (F and G) The one study38 in TC vs. CC and one study38 in TT+TC vs. CC for -819C/T. (H-K) The three studies262838 in A vs. C, one study38 in AA vs. CC, one study38 in AA+AC vs. CC, and two studies1738 in AA vs. AC+CC for -592A/C. TB, tuberculosis; IL-10, interleukin 10.

ymj-56-1274-g003
Fig. 4

Funnel plot for publication bias of the meta-analysis of tuberculosis risk and IL-10 polymorphisms in allele genetic model comparison. (A) IL-10 -1082G/A polymorphism. (B) IL-10 -819C/T polymorphism. (C) IL-10 -592A/C polymorphism. (D) IL-6 -174G/C polymorphism. IL-10, interleukin 10; IL-6, interleukin 6.

ymj-56-1274-g004
Table 1

Baseline Characteristics of the 30 Eligible Studies Included in This Meta-Analysis

ymj-56-1274-i001
Study Yr Male patients (%) Mean age (yrs) Sample types Sample size SNP studied Clinical diagnoses performed Control source Sample tested Genotyping method NOS score P-HWE for controls
Cases Controls Cases Control
IL-10
 Bellamy, et al.10 1998 67.4 34.7±13.2 30.3±7.5 PTB 401 408 -1082G/A, -819C/T, -592A/C Acidfast, bacilli (AFB) HB Blood PCR-slot-blotting 7 0.824
 Delgado, et al.11 2002 37.3 42.2±14.1 37.5±12.9 PTB 356 106 -1082G/A Sputum smear, medical history, physical examination HB Blood RFLP-PCR 9 <0.001
 López-Maderuelo, et al.12 2003 NR NR NR PTB 113 100 -1082G/A Culture, radiologic diagnosed HB Blood ARMS-PCR 8 0.949
 Scola, et al.13 2003 NR 35-60 NR PTB 45 114 -1082G/A Clinical history, radiologic diagnosed PB Blood ARMS-PCR 7 <0.001
 Fitness, et al.14 2004 NR NR NR PTB 210 705 -1082G/A, -819C/T, -592A/C Culture, smear, history HB Blood ARMS-PCR 7 0.524
 Shin, et al.15 2005 NR 46.9 (18-86) 56.1 (50-81) PTB 450 851 -1082G/A, -592A/C AFB HB Blood Single-base extension methods 8 0.168
 Amirzargar, et al.6 2006 NR NR NR PTB 41 123 -1082G/A, -819C/T, -592A/C AFB, chest X-ray (CXR) HB Blood PCR-SSP 8 <0.001
 Oral, et al.16 2006 NR NR NR PTB, EPTB 81 50 -1082G/A, -819C/T, -592A/C Staining of sputum smears, culture, biopsy, radiography HB Blood PCR-SSP 9 0.06
 Henao, et al.17 2006 57.9 15-70 17-55 PTB, EPTB 190 135 -1082G/A, -819C/T, -592A/C Ziehl-Nielssen staining of sputum smears, culture, biopsy, CXR, clinical history HB Blood PCR-SSP 9 0.94
 Oh, et al.18 2007 68.9 17-88 45.8 (18-81) PTB 145 117 -1082G/A Staining of sputum smears, culture, radiography HB Blood ARMS-PCR 8 0.612
 Prabhu Anand, et al.19 2007 56.8 35.5±12.3 29.7±9.5 PTB 132 143 -1082G/A Staining of sputum smears, culture, radiography HB Blood PCR-RFLP 8 0.123
 Ates, et al.20 2008 62 47.84±12.6 54.1±7.2 PTB, EPTB 128 80 -1082G/A, -819C/T, -592A/C Radiographic, clinical presentation, smears, culture HB Blood ARMS-PCR 9 0.978
 Selvaraj, et al.21 2008 71.7 Male: 35.3±10.5, female: 29.2±10.3 Male: 32±8.1, female: 27.1±8.6 PTB 155 183 -1082G/A, -819C/T, Radiographic, clinical presentation, smears, culture PB Blood PCR-RFLP 7 0.204
 Wu, et al.22 2008 NR NR NR PTB 61 122 -1082G/A, -819C/T, -592A/C Radiographic, clinical presentation, smears, culture HB Blood PCR-RFLP 7 0.379
 Ansari, et al.23 2009 NR NR NR PTB 188 188 -1082G/A Microscopy, culture, histology, imaging PB Blood ARMS-PCR 8 <0.001
 Thye, et al.24 2009 NR NR NR PTB 2010 2346 -1082G/A, -819C/T, -592A/C Smears, culture PB Blood FRET 8 0.542
 Trajkov, et al.25 2009 NR 20-59 NR PTB 75 299 -1082G/A, -819C/T, -592A/C WHO based PB Blood PCR-SSP 7 <0.001
 Taype, et al.26 2010 97.6 29.01±11.42 32.56±9.39 PTB, EPTB 626 513 -1082G/A, -592A/C Smears, culture, biopsy, clinical HB Blood Taqman PCR 9 0.142
IL-10
 Mosaad, et al.27 2010 67.3 0.5 (0.025-1.5) NR (0.047-1.5) PTB, EPTB 110 118 -1082G/A Smear, culture HB Blood ARMS-PCR 9 <0.001
 Ma, et al.28 2010 27.8 34.75±16.67 38.17±17.39 PTB 543 544 -819C/T Radiographic, smears, culture HB Blood ARMS-PCR 9 0.491
 Ben-Selma, et al.29 2011 51.9 PTB: 44, EPTB: 39 35 PTB, EPTB 131 95 -1082G/A, -819C/T, -592A/C Sputum smear, CXR, radiologic, histologic grounds HB Blood PCR-RFLP 9 <0.05
 Liang, et al.30 2011 NR NR NR PTB, EPTB 235 78 -1082G/A, -819C/T, -592A/C Radiographic, biopsy, clinical presentation, smears, culture HB Blood SNaPshot assay 9 0.589
 Ramaseri Sunder, et al.31 2012 NR NR NR PTB, EPTB 104 102 -1082G/A Sputum smear, CXR, biopsy, Fine Needle Aspiration Cytology (FNAC) HB Blood ARMS-PCR 8 0.057
 Spinassé, et al.32 2012 NR NR NR PTB 221 271 -1082G/A, -819C/T, -592A/C Culture HB Blood Sequencing 7 0.189
 García-Elorriaga, et al.33 2013 38.9 38-65 26-41 PTB 77 60 -1082G/A, -592A/C WHO based HB Blood Taqman PCR 7 0.728
 Ulger, et al.34 2013 84.5 32.57±15.94 29.40±11.56 PTB, EPTB 84 110 -1082G/A Smear, culture HB Blood PCR-RFLP 8 <0.001
 Meenakshi, et al.35 2013 50 27.4±13.9 30±10.7 PTB 100 100 -1082G/A Radiographic, sputum culture, AFB, histocytological examination HB Blood ARMS-PCR 8 0.058
 Mhmoud, et al.36 2013 69.6 36.9 (15-89) 31.2 (17-85) PTB 191 206 -819C/T, -592A/C Culture, smear HB Blood PCR-RFLP 8 <0.001
IL-6
 Oral, et al.16 2006 NR NR NR PTB, EPTB 81 49 -174G/C Staining of sputum smears, culture, biopsy, radiography HB Blood PCR-SSP 9 <0.05
 Henao, et al.17 2006 57.9 15-70 17-55 PTB, EPTB 190 135 -174G/C Ziehl-Nielssen staining of sputum smears, culture, biopsy, CXR, clinical history HB Blood PCR-SSP 9 0.689
 Amirzargar, et al.6 2006 NR NR NR PTB 40 119 -174G/C AFB, CXR HB Blood PCR-SSP 8 <0.05
 Selvaraj, et al.21 2008 71.7 Male: 35.3±10.5, female: 29.2±10.3 Male: 32±8.1, female: 27.1±8.6 PTB 160 183 -174G/C Radiographic, clinical presentation, smears, culture PB Blood PCR-RFLP 7 0.419
 Trajkov, et al.25 2009 NR 20-59 NR PTB 75 301 -174G/C WHO based PB Blood PCR-SSP 7 0.492
 Ansari, et al.37 2011 NR Minimal/moderate disease: 32.4±15.9; advanced disease: 27±17.0 28.3±12.1 PTB 97 166 -174G/C Radiographic, smears, culture PB Blood ARMS-PCR 8 0.567
 Zhang, et al.38 2012 62 38.64±18.44 36.92±16.52 PTB 495 358 -174G/C Radiographic, smears, culture HB Blood Mass spectrometry 8 0.979

NR, not report; PTB, pulmonary tuberculosis; EPTB, extra-pulmonary tuberculosis; SNP, single nucleotide polymorphism; PB, population-based controls; HB, hospital-based controls; PCR, polymerase chain reaction; SSP, sequence-specific primers; ARMS, amplification refractory mutation system; RFLP, restriction fragment length polymorphism; NOS, newcastle-ottawa scale; C, confirmed to HWE; HWE, Hardy-Weinberg equilibrium.

Table 2

Genotype and Allele Distributions of IL-10 and IL-6 Polymorphisms in Cases and Controls

ymj-56-1274-i002
Polymorphisms Study Country Ethnicity Case Control Case Control
GG AG AA GG AG AA G A G A
IL-10-1082G/A Bellamy, et al.10 Gambia African 51 185 165 45 184 179 287 515 274 542
Delgado, et al.11 Cambodia Asian 11 259 86 3 64 39 281 431 70 142
López-Maderuelo, et al.12 Spain European 33 47 33 29 50 21 113 113 108 92
Scola, et al.13 Italy European 17 22 6 24 77 13 56 34 125 103
Fitness, et al.14 Malawi African 23 78 69 87 251 203 124 216 425 657
Shin, et al.15 Korea Asian 2 53 394 9 124 718 57 841 142 1560
Amirzargar, et al.6 Iran Asian 2 31 7 5 79 18 35 45 89 115
Oral, et al.16 Turkey European 10 41 30 5 13 32 61 101 23 77
Henao, et al.17 Colombia American 32 92 66 26 66 43 156 224 118 152
Oh, et al.18 Korea Asian 4 43 98 19 53 45 51 239 91 143
Prabhu, et al.19 India Asian 3 55 74 6 61 73 61 203 73 207
Ates, et al.20 Turkey European 26 65 37 6 32 42 117 139 44 116
Selvaraj, et al.21 India Asian 5 42 102 6 69 108 52 246 81 285
Wu, et al.22 China Asian 1 12 48 0 18 104 14 108 18 226
Ansari, et al.23 Pakistan Asian 27 132 29 20 136 32 186 190 176 200
Thye, et al.24 Ghana African 117 631 793 160 783 1025 865 2217 1103 2833
Trajkov, et al.25 Macedonia European 10 48 17 17 212 70 68 82 246 352
Taype, et al.26 Peru American 22 187 414 10 153 347 231 1015 173 847
Mosaad, et al.27 Egypt African 16 92 2 22 88 8 124 96 132 104
Ben-Selma, et al.29 Tunisian African 21 65 45 9 26 60 168.8 155 44 146
Liang, et al.30 China Asian 0 28 207 0 9 69 28 442 9 147
Ramaseri Sunder, et al.31 India Asian 3 25 76 2 43 57 31 177 47 157
Spinassé, et al.32 Brazil American 24 100 97 31 107 133 148 294 169 373
García-Elorriaga, et al.33 Mexico American 54 20 3 31 25 4 128 26 87 33
Ulger, et al.34 Turkey European 0 84 0 1 104 5 84 84 106 114
Meenakshi, et al.35 India Asian 4 81 15 16 59 25 89 111 91 109
Polymorphisms Study Country Ethnicity Case Control Case Control
TT TC CC TT TC CC T C T C
IL-10-819C/T Bellamy, et al.10 Gambia African 89 192 120 88 206 114 370 432 382 434
Fitness, et al.14 Malawi African 27 98 85 108 303 287 152 268 519 877
Amirzargar, et al.6 Iran Asian 2 20 19 9 52 62 24 58 70 176
Oral, et al.16 Turkey European 10 23 48 7 19 24 43 119 33 67
Henao, et al.17 Colombia American 32 92 66 21 64 50 156 224 106 164
Ates, et al.20 Turkey European 7 58 63 8 36 36 72 184 52 108
Selvaraj, et al.21 India Asian 45 86 24 56 82 45 176 134 194 172
Wu, et al.22 China Asian 24 34 3 50 62 10 82 40 162 82
Thye, et al.24 Ghana African 267 762 515 365 942 665 1296 1792 1672 2272
Trajkov, et al.25 Macedonia European 5 35 35 19 125 155 45 105 163 435
Ma, et al.28 China Asian 229 256 58 230 253 61 714 372 713 375
Ben-Selma, et al.29 Tunisian African 11 65 55 10 42 43 87 175 62 128
Liang, et al.30 China Asian 123 90 22 35 31 12 336 134 101 55
Spinassé, et al.32 Brazil American 32 100 89 38 124 109 164 278 200 342
Mhmoud, et al.36 Sudan African 42 126 23 70 73 63 210 172 213 199
Polymorphisms Study Country Ethnicity Case Control Case Control
AA AC CC AA AC CC A C A C
IL-10-592A/C Bellamy, et al.10 Gambia African 89 192 120 88 206 114 370 432 382 434
Fitness, et al.14 Malawi African 27 98 85 107 301 297 152 268 515 895
Shin, et al.15 Korea Asian 238 173 39 376 384 91 649 251 1136 566
Amirzargar, et al.6 Iran Asian 2 20 18 9 52 62 24 56 70 176
Polymorphisms Study Country Ethnicity Case Control Case Control
AA AC CC AA AC CC A C A C
Oral, et al.16 Turkey European 10 23 48 7 19 24 43 119 33 67
Henao, et al.17 Colombia American 72 89 29 41 67 27 233 147 149 121
Ates, et al.20 Turkey European 7 58 63 8 36 36 72 184 52 108
Wu, et al.22 China Asian 24 34 3 50 62 10 82 40 162 82
Thye, et al.24 Ghana African 172 532 321 269 696 480 876 1174 1234 1656
Trajkov, et al.25 Macedonia European 5 31 39 28 117 154 41 109 173 425
Taype, et al.26 Peru American 117 218 264 105 230 178 452 746 440 586
Ben-selma, et al.29 Tunisian African 12 63 56 10 42 43 87 175 62 128
Liang, et al.30 China Asian 123 90 22 35 31 12 336 134 101 55
Spinassé, et al.32 Brazil American 34 102 85 37 127 107 170 272 201 341
García-elorriaga, et al.33 Mexico American 1 57 19 1 42 17 59 95 44 76
Mhmoud, et al.36 Sudan African 127 47 17 100 68 38 301 81 268 144
Polymorphisms Study Country Ethnicity Case Control Case Control
CC CG GG CC CG GG C G C G
IL-6-174G/C Oral, et al.16 Turkey European 6 27 48 9 13 27 39 123 31 67
Henao, et al.17 Colombia American 11 73 106 13 61 61 95 285 87 183
Amirzargar, et al.6 Iran Asian 4 13 23 10 71 38 21 59 91 147
Selvaraj, et al.21 India Asian 3 35 122 3 51 129 41 279 57 309
Trajkov, et al.25 Macedonia European 8 31 36 25 132 144 47 103 182 420
Ansari, et al.37 Pakistan Asian 4 24 69 10 56 100 32 162 76 256
Zhang, et al.38 China Asian 0 4 491 0 1 357 4 986 1 715

IL-10, interleukin 10; IL-6, interleukin 6.

Table 3

Determination of the Genetic Effects of IL-10 and IL-6 Polymorphisms on TB and Subgroup Analysis

ymj-56-1274-i003
Allele model Homozygous model Heterozygous model Dominant model Recessive model
Effect model OR (95% Cl) p value Effect model OR (95% Cl) p value Effect model OR (95% Cl) p value Effect model OR (95% Cl) p value Effect model OR (95% Cl) p value
IL-10-1082G/A G allele vs. A allele GG vs. AA AG vs. AA GG+AG vs. AA GG vs. AG+AA
 Ethnicity
  Overall 1.05(0.93,1.19) 0.423 1.15(0.87,1.51) 0.320 1.08(0.90,1.29) 0.393 1.09(0.91,1.31) 0.335 1.09(0.87,1.38) 0.448
  European 1.34(1.00,1.80) 0.054 1.88(0.93,3.80) 0.079 1.35(0.70,2.63) 0.369 1.49(0.79,2.79) 0.215 F1.69(1.19, 2.39) 0.003
  American F1.10(0.95,1.27) 0.201 F1.16(0.81,1.67) 0.421 F1.07 (0.88,1.30) 0.509 F1.09 (0.90,1,31) 0.372 F1.23 (0.90,1.68) 0.203
  Asian 0.85(0.67,1.09) 0.209 0.69(0.36,1.36) 0.285 0.91(0.66,1.26) 0.940 0.89(0.63,1.25) 0.494 0.67(0.36,1.26) 0.212
  African 1.12(0.91,1.38) 0.289 1.20(0.81,1.77) 0.369 1.32(0.93,1.87) 0.126 1.31 (0.92,1.88) 0.131 F0.97 (0.81,1.17) 0.761
 Sample types
  PTB 0.98(0.85,1.12) 0.726 0.93(0.70,1.25) 0.646 0.97(0.81,1.15) 0.691 0.96(0.80,1.15) 0.651 1.01 (0.76,1.34) 0.958
  PTB+EPTB 1.23(0.94,1.62) 0.130 2.00(1.16,3.45) 0.013 1.53(0.95,2.49) 0.084 1.56(0.97,2.52) 0.067 1.31 (0.89,1.93) 0.176
IL-10-819C/T T allele vs. C allele TT vs. CC TC vs. CC TT+TC vs. CC TT vs. TC+CC
 Ethnicity
  Overall F1.01 (0.95,1.07) 0.788 F1.01 (0.89,1.15) 0.834 1.21(1.00,1.46) 0.056 1.14(0.98,1.34) 0.099 F0.93 (0.84,1.03) 0.164
  European F0.92(0.71,1.19) 0.512 F0.75 (0.40,1.42) 0.380 F0.97 (0.68,1.37) 0.846 0.93(0.67,1.30) 0.678 F0.79 (0.43,1.44) 0.438
  American F1.04 (0.85,1.27) 0.732 F1.08(0.71,1.65) 0.721 F1.03 (0.76,1.39) 0.870 F1.04 (0.78,1.38) 0.799 F1.06 (0.72,1.57) 0.756
  Asian F1.08 (0.95,1.23) 0.265 F1.24 (0.92,1.67) 0.157 F1.34 (1.02,1.77) 0.035 F1.31 (1.01,1.70) 0.043 F1.01 (0.84,1.22) 0.897
  African F0.99 (0.92,1.07) 0.812 F0.97 (0.83, 1.13) 0.691 1.34(0.90,2.00) 0.148 1.21 (0.89,1.64) 0.231 F0.88 (0.77,1.01) 0.065
 Control source
  HB F1.01 (0.93,1.10) 0.785 F1.04 (0.87,1.24) 0.685 1.20(0.92,1.55) 0.175 1.13(0.92,1.39) 0.237 F0.93 (0.81,1.07) 0.310
  PB F1.01(0.92,1.09) 0.919 F0.99 (0.82,1.19) 0.908 1.26(0.89,1.78) 0.201 1.20(0.88,1.64) 0.258 F0.92 (0.79, 0.84) 0.339
IL-10-592A/C A allele vs. C allele AA vs. CC AC vs. CC AA+AC vs. CC AA vs. AC+CC
 Ethnicity
  Overall 1.07(0.95,1.19) 0.270 1.09(0.89,1.33) 0.401 F1.01 (0.91, 1.12) 0.839 1.06(0.91,1.22) 0.474 1.09(0.93,1.29) 0.291
  European F0.84 (0.65,1.09) 0.181 F0.64 (0.35,1.18) 0.153 F0.90(0.63,1.27) 0.536 F0.85 (0.61,1.18) 0.323 F0.68 (0.38,1.23) 0.204
  American 1.01(0.80,1.28) 0.918 F0.93 (0.72,1.20) 0.595 0.91(0.64,1.31) 0.623 0.97(0.67,1.39) 0.859 F1.07 (0.86,1.34) 0.545
  Asian F1.26 (1.08,1.45) 0.002 F1.50 (1.07, 2.12) 0.020 F1.21 (0.88,1.67) 0.250 F1.35 (0.99,1.83) 0.058 F1.33 (1.10,1.62) 0.004
  African 1.12(0.91,1.37) 0.290 1.12(0.79,1.58) 0.528 F1.11(0.97,1.27) 0.144 F1.09 (0.96,1.24) 0.175 1.08(0.77,1.52) 0.654
 Control source
  HB 1.08(0.94,1.24) 0.254 1.14(0.90,1.45) 0.289 F0.95(0.84,1.08) 0.429 1.07(0.89,1.29) 0.464 1.15(0.97,1.37) 0.111
  PB 1.00(0.89,1.1 1) 0.933 0.94(0.75,1.19) 0.607 F1.13(0.95,1.34) 0.154 1.08(0.91,1.22) 0.359 0.87(0.71,1.07) 0.194
IL-6-174G/C C allele vs. G allele CC vs. GG CG vs. GG CC+CG vs. GG CC vs. CG+GG
 Overall F0.77 (0.64, 0.91) 0.003 F0.67 (0.43,1.05) 0.078 F0.72(0.57, 0.90) 0.005 F0.71 (0.57, 0.88) 0.002 F0.77 (0.50,1.19) 0.243
 European F0.92 (0.67,1.26) 0.594 0.73(0.22,2.43) 0.610 F1.00(0.64,1.57) 0.987 F0.94 (0.62,1.42) 0.773 0.72(0.20,2.59) 0.615
 Asian F0.71 (0.54,0.93) 0.013 F0.69 (0.32,1.48) 0.343 F0.61 (0.44,0.85) 0.004 F0.63 (0.46, 0.86) 0.004 F0.93 (0.44,1.97) 0.855

TB, tuberculosis; PTB, pulmonary tuberculosis; EPTB, extra-pulmonary tuberculosis; PB, population-based controls; HB, hospital-based controls; R, random effect model; F, fixed effect model; IL-10, interleukin 10; IL-6, interleukin 6; CI, confidence interval; OR, odds ratio.

Table 4

Meta-Analyses of IL-10 Polymorphisms and Risk of TB after Omitting the Studies

ymj-56-1274-i004
Polymorphisms Omitted studies OR (95% CI) Z POR I2 (%) Pheterogeneity Effect model
IL-10-1082G/A
 G vs. A Ates, et al.;20 García-Elorriaga, et al.;33 Oh, et al.;18 Ramaseri Sunder, et al.;31 Wu, et al.22 1.02 (0.96, 1.09) 0.69 0.488 9.4 0.336 F
 GG vs. AA Ates, et al.;20 Ramaseri Sunder, et al.;31 Wu, et al.22 1.04 (0.90, 1.21) 0.54 0.588 2.2 0.430 F
 AG vs. AA Ansari, et al.;37 Ates, et al.;20 García-Elorriaga, et al.;33 Oh, et al.;18 Ramaseri Sunder, et al.;31 Scola, et al.;13 Wu, et al.22 1.00 (0.92, 1.09) 0.01 0.989 0.0 0.486 F
 GG+AG vs. AA Ates, et al.;20 García-Elorriaga, et al.;33 Oh, et al.;18 Ramaseri Sunder, et al.;31 Scola, et al.;13 Wu, et al.22 1.01 (0.93, 1.10) 0.25 0.802 11.6 0.311 F
 GG vs. AG+AA Ansari, et al.;37 Ates, et al.;20 Meenakshi, et al.;35 Mosaad, et al.;27 Wu, et al.22 1.03 (0.90, 1.19) 0.46 0.645 0.0 0.623 F
IL-10-819C/T
 TC vs. CC Zhang, et al.38 1.06 (0.96, 1.17) 1.19 0.234 0.0 0.671 F
 TT+TC vs. CC Zhang, et al.38 1.04 (0.95, 1.14) 0.80 0.424 0.0 0.683 F
IL-10-592A/C
 A vs. C Ma, et al.;28 Taype, et al.;26 Zhang, et al.38 1.08 (0.99, 1.17) 1.78 0.075 3.7 0.409 F
 AA vs. CC Zhang, et al.38 0.99 (0.87, 1.13) 0.11 0.913 5.9 0.386 F
 AA+AC vs. CC Zhang, et al.38 1.00 (0.91, 1.10) 0.08 0.936 29.1 0.138 F
 AA vs. AC+CC Henao, et al.;17 Zhang, et al.38 0.96 (0.85, 1.09) 0.63 0.526 0.0 0.845 F

TB, tuberculosis; CI, confidence interval; OR, odds ratio; Pheterogeneity, p value of Q test for heterogeneity; F, fixed-effect models; IL-10, interleukin 10.

Table 5

Multivariate Meta-Regression Analyses of Potential Source of Heterogeneity

ymj-56-1274-i005
Heterogeneity factors Coefficient SE t p value 95% CI
LL UL
Sample types
IL-10-1082G/A (AM, HoM, HeM, DM, RM) 0.234, 0.924, 0.407, 0.433, 0.457 0.183, 0.361, 0.278, 0.279, 0.289 1.28, 2.56, 1.46, 1.55, 1.58 0.215, 0.019, 0.158, 0.136, 0.130 -0.146, 0.170, -0.171, -0.148, -0.146 0.614, 1.679, 0.985, 1.014, 1.061
IL-10-819C/T (HeM, DM) -0.119, -0.071 0.345, 0.285 -0.35, -0.25 0.737, 0.808 -0.887, -0.706 0.649, 0.564
IL-10-592A/C (AM, HoM, DM, RM) -0.091, -0.104, -0.162, -0.055 0.158, 0.316, 0.203, 0.235 -0.57, -0.33, -0.80, -0.23 0.577, 0.748, 0.440, 0.819 -0.438, -0.800, -0.609, -0.572 0.256, 0.592, 0.284, 0.462
Ethnicity
IL-10-1082G/A (AM, HoM, HeM, DM, RM) -0.082, -0.118, 0.014, -0.031, -0.223 0.077, 0.141, 0.124, 0.124, 0.108 -1.07, -0.83, 0.11, -0.25, -2.06 0.298, 0.415, 0.910, 0.804, 0.052 -0.241, -0.413, -0.244, -0.290, -0.448 0.077, 0.177, 0.272, 0.227, 0.002
IL-10-819C/T (HeM, DM) 0.116, 0.082 0.141, 0.115 0.82, 0.71 0.433, 0.493 -0.120, -0.175 0.431, 0.339
IL-10-592A/C (AM, HoM, DM, RM) 0.067, 0.106, 0.084, 0.062 0.067, 0.137, 0.082, 0.110 1.00, 0.78, 1.02, 0.57 0.339, 0.453, 0.329, 0.583 -0.081, -0.195, -0.097, -0.179 0.215, 0,407, 0.264, 0.304
Control source
IL-10-1082G/A (AM, HoM, HeM, DM, RM) 0.093, 0.528, -0.137, -0.057, 0.545 0.207, 0.366, 0.308, 0.311, 0.295 0.45, 1.44, -0.44, -0.18, 1.85 0.659, 0.166, 0.661, 0.855, 0.080 -0.338, -0.239, -0.776, -0.705, -0.070 0.524, 1.295, 0.503, 0.590, 1.161
IL-10-819C/T (HeM, DM) 0.053, 0.051 0.363, 0.294 0.14, 0.17 0.888, 0.867 -0.757, -0.605 0.862, 0.707
IL-10-592A/C (AM, HoM, DM, RM) -0.157, -0.368, -0.090, -0.395 0.191, 0.362, 0.225, 0.265 -0.82, -1.02, -0.40, -1.49 0.429, 0.331, 0.697, 0.165 -0.577, -1.165, -0.585, -0.978 0.263, 0.429, 0.405, 0.189
Genotyping method
IL-10-1082G/A (AM, HoM, HeM, DM, RM) 0.075, 0.124, 0.051, 0.068, 0.137 0.064, 0.121, 0.098, 0.099, 0.095 1.17, 1.02, 0.52, 0.69, 1.44 0.254, 0.319, 0.606, 0.499, 0.164 -0.058, -0.129, -0.152, -0.137, -0.061 0.209, 0.376, 0.254, 0.273, 0.335
IL-10-819C/T (HeM, DM) 0.006, 0.022 0.131, 0.106 0.05, 0.21 0.965, 0.840 -0.285, -0.214 0.297, 0.257
IL-10-592A/C (AM, HoM, DM, RM) 0.015, 0.074, -0.024, 0.090 0.060, 0.117, 0.073, 0.089 0.24, 0.63, -0.32, 1.01 0.813, 0.538, 0.752, 0.336 -0.118, -0.183, -0.185, -0.107 0.147, 0.331, 0.137, 0.286

SE, standard error; CI, confidence interval; UL, upper limit; LL, lower limit; AM, allele model; HoM, homozygous model; HeM, heterozygous model; DM, dominant model; RM, recessive model; IL-10, interleukin 10.

Table 6

Publication Bias of IL-10 -1082G/A, IL-10 -819C/T, and IL-10 -592A/C Polymorphisms in all Genetic Models

ymj-56-1274-i006
Polymorphisms ZBegg's PBegg's tEgger's PEgger's
IL-10-1082G/A (AM, HoM, HeM, DM, RM) 0.93, 0.47, 1.01, 1.28, 0.35 0.355, 0.637, 0.311, 0.201, 0.726 0.60, 0.79, 0.82, 0.95, 0.21 0.555, 0.436, 0.418, 0.352. 0.839
IL-10-819C/T (AM, HoM, HeM, DM, RM) 0.99, 0.10, 1.88, 1.78, 0.99 0.322, 0.921, 0.060, 0.075, 0.322 1.04, 0.80, 1.30, 1.28, -0.68 0.317, 0.438, 0.217, 0.221, 0.511
IL-10-592A/C (AM, HoM, HeM, DM, RM) 0.23, 0.32, 1.22, 1.31, 0.59 0.822, 0.753, 0.224, 0.192, 0.558 0.59, 0.57, 0.90, 1.36, -0.68 0.564, 0.575, 0.385, 0.195, 0.505
IL-6-174G/C (AM, HoM, HeM, DM, RM) 0.30, 0.75, 0.90, 0.00, 0.38 0.764, 0.452, 0.368, 1.000, 0.707 0.57, -0.09, 0.57, 0.51, 0.07 0.596, 0.934, 0.592, 0.634, 0.945

AM, allele model; HoM, homozygous model; HeM, heterozygous model; DM, dominant model; RM, recessive model; IL-10, interleukin 10; IL-6, interleukin 6.

ACKNOWLEDGEMENTS

This work was supported by a grant from the National Clinical Key Specialty Construction Projects to the Department of Clinical Laboratory of Renmin Hospital of Wuhan University.

Notes

The authors have no financial conflicts of interest.

References

1. Gouzy A, Nigou J, Gilleron M, Neyrolles O, Tailleux L, Gordon SV. Tuberculosis 2012: biology, pathogenesis and intervention strategies; an update from the city of light. Res Microbiol. 2013; 164:270–280.
crossref
2. Hill AV. Aspects of genetic susceptibility to human infectious diseases. Annu Rev Genet. 2006; 40:469–486.
crossref
3. Abbas AK, Murphy KM, Sher A. Functional diversity of helper Tlymphocytes. Nature. 1996; 383:787–793.
4. Howell WM, Rose-Zerilli MJ. Cytokine gene polymorphisms, cancer susceptibility, and prognosis. J Nutr. 2007; 137:1 Suppl. 194S–199S.
5. Van Snick J. Interleukin-6: an overview. Annu Rev Immunol. 1990; 8:253–278.
crossref
6. Amirzargar AA, Rezaei N, Jabbari H, Danesh AA, Khosravi F, Hajabdolbaghi M, et al. Cytokine single nucleotide polymorphisms in Iranian patients with pulmonary tuberculosis. Eur Cytokine Netw. 2006; 17:84–89.
7. Stang A. Critical evaluation of the Newcastle-Ottawa scale for the assessment of the quality of nonrandomized studies in metaanalyses. Eur J Epidemiol. 2010; 25:603–605.
crossref
8. Mantel N, Haenszel W. Statistical aspects of the analysis of data from retrospective studies of disease. J Natl Cancer Inst. 1959; 22:719–748.
9. DerSimonian R, Laird N. Meta-analysis in clinical trials. Control Clin Trials. 1986; 7:177–188.
crossref
10. Bellamy R, Ruwende C, Corrah T, McAdam KP, Whittle HC, Hill AV. Assessment of the interleukin 1 gene cluster and other candidate gene polymorphisms in host susceptibility to tuberculosis. Tuber Lung Dis. 1998; 79:83–89.
crossref
11. Delgado JC, Baena A, Thim S, Goldfeld AE. Ethnic-specific genetic associations with pulmonary tuberculosis. J Infect Dis. 2002; 186:1463–1468.
crossref
12. Lpez-Maderuelo D, Arnalich F, Serantes R, Gonzlez A, Codoceo R, Madero R, et al. Interferon-gamma and interleukin-10 gene polymorphisms in pulmonary tuberculosis. Am J Respir Crit Care Med. 2003; 167:970–975.
crossref
13. Scola L, Crivello A, Marino V, Gioia V, Serauto A, Candore G, et al. IL-10 and TNF-alpha polymorphisms in a sample of Sicilian patients affected by tuberculosis: implication for ageing and life span expectancy. Mech Ageing Dev. 2003; 124:569–572.
crossref
14. Fitness J, Floyd S, Warndorff DK, Sichali L, Malema S, Crampin AC, et al. Large-scale candidate gene study of tuberculosis susceptibility in the Karonga district of northern Malawi. Am J Trop Med Hyg. 2004; 71:341–349.
crossref
15. Shin HD, Park BL, Kim YH, Cheong HS, Lee IH, Park SK. Common interleukin 10 polymorphism associated with decreased risk of tuberculosis. Exp Mol Med. 2005; 37:128–132.
crossref
16. Oral HB, Budak F, Uzaslan EK, Baştürk B, Bekar A, Akalin H, et al. Interleukin-10 (IL-10) gene polymorphism as a potential host susceptibility factor in tuberculosis. Cytokine. 2006; 35:143–147.
crossref
17. Henao MI, Montes C, Pars SC, Garca LF. Cytokine gene polymorphisms in Colombian patients with different clinical presentations of tuberculosis. Tuberculosis (Edinb). 2006; 86:11–19.
crossref
18. Oh JH, Yang CS, Noh YK, Kweon YM, Jung SS, Son JW, et al. Polymorphisms of interleukin-10 and tumour necrosis factor-alpha genes are associated with newly diagnosed and recurrent pulmonary tuberculosis. Respirology. 2007; 12:594–598.
crossref
19. Prabhu Anand S, Selvaraj P, Jawahar MS, Adhilakshmi AR, Narayanan PR. Interleukin-12B & interleukin-10 gene polymorphisms in pulmonary tuberculosis. Indian J Med Res. 2007; 126:135–138.
20. Ates O, Musellim B, Ongen G, Topal-Sarikaya A. Interleukin-10 and tumor necrosis factor-alpha gene polymorphisms in tuberculosis. J Clin Immunol. 2008; 28:232–236.
crossref
21. Selvaraj P, Alagarasu K, Harishankar M, Vidyarani M, Nisha Rajeswari D, Narayanan PR. Cytokine gene polymorphisms and cytokine levels in pulmonary tuberculosis. Cytokine. 2008; 43:26–33.
crossref
22. Wu F, Qu Y, Tang Y, Cao D, Sun P, Xia Z. Lack of association between cytokine gene polymorphisms and silicosis and pulmonary tuberculosis in Chinese iron miners. J Occup Health. 2008; 50:445–454.
crossref
23. Ansari A, Talat N, Jamil B, Hasan Z, Razzaki T, Dawood G, et al. Cytokine gene polymorphisms across tuberculosis clinical spectrum in Pakistani patients. PLoS One. 2009; 4:e4778.
crossref
24. Thye T, Browne EN, Chinbuah MA, Gyapong J, Osei I, Owusu-Dabo E, et al. IL10 haplotype associated with tuberculin skin test response but not with pulmonary TB. PLoS One. 2009; 4:e5420.
crossref
25. Trajkov D, Trajchevska M, Arsov T, Petlichkovski A, Strezova A, Efinska-Mladenovska O, et al. Association of 22 cytokine gene polymorphisms with tuberculosis in Macedonians. Indian J Tuberc. 2009; 56:117–131.
26. Taype CA, Shamsuzzaman S, Accinelli RA, Espinoza JR, Shaw MA. Genetic susceptibility to different clinical forms of tuberculosis in the Peruvian population. Infect Genet Evol. 2010; 10:495–504.
crossref
27. Mosaad YM, Soliman OE, Tawhid ZE, Sherif DM. Interferon-gamma +874 T/A and interleukin-10 -1082 A/G single nucleotide polymorphism in Egyptian children with tuberculosis. Scand J Immunol. 2010; 72:358–364.
crossref
28. Ma MJ, Xie LP, Wu SC, Tang F, Li H, Zhang ZS, et al. Toll-like receptors, tumor necrosis factor-α, and interleukin-10 gene polymorphisms in risk of pulmonary tuberculosis and disease severity. Hum Immunol. 2010; 71:1005–1010.
29. Ben-Selma W, Harizi H, Boukadida J. Association of TNF-α and IL-10 polymorphisms with tuberculosis in Tunisian populations. Microbes Infect. 2011; 13:837–843.
crossref
30. Liang L, Zhao YL, Yue J, Liu JF, Han M, Wang H, et al. Interleukin-10 gene promoter polymorphisms and their protein production in pleural fluid in patients with tuberculosis. FEMS Immunol Med Microbiol. 2011; 62:84–90.
crossref
31. Ramaseri Sunder S, Hanumanth SR, Nagaraju RT, Venkata SK, Suryadevara NC, Pydi SS, et al. IL-10 high producing genotype predisposes HIV infected individuals to TB infection. Hum Immunol. 2012; 73:605–611.
crossref
32. Spinassé LB, Miranda AB, Santos AR, Mello FCQ, Lapa e Silva JR, Lopes MQP, et al. Partial Mapping of the IL-10 Promoter Region: Identification of New SNPs and Association with Tuberculosis Outcome in Brazilians. In : Cardona PJ, editor. Understanding Tuberculosis-Analyzing the Origin of Mycobacterium Tuberculosis Pathogenicity. INTECH Open Access Publisher;2012. p. 357–366.
33. Garca-Elorriaga G, Vera-Ramrez L, del Rey-Pineda G, Gonzlez-Bonilla C. -592 and -1082 interleukin-10 polymorphisms in pulmonary tuberculosis with type 2 diabetes. Asian Pac J Trop Med. 2013; 6:505–509.
crossref
34. Ulger M, Emekdas¸ G, Aslan G, Tas¸ D, Ilvan A, Tezcan S, et al. [Determination of the cytokine gene polymorphism and genetic susceptibility in tuberculosis patients]. Mikrobiyol Bul. 2013; 47:250–264.
crossref
35. Meenakshi P, Ramya S, Shruthi T, Lavanya J, Mohammed HH, Mohammed SA, et al. Association of IL-1β +3954 C/T and IL-10-1082 G/A cytokine gene polymorphisms with susceptibility to tuberculosis. Scand J Immunol. 2013; 78:92–97.
crossref
36. Mhmoud N, Fahal A, van de Sande WJ. Association of IL-10 and CCL5 single nucleotide polymorphisms with tuberculosis in the Sudanese population. Trop Med Int Health. 2013; 18:1119–1127.
crossref
37. Ansari A, Hasan Z, Dawood G, Hussain R. Differential combination of cytokine and interferon-γ +874 T/A polymorphisms determines disease severity in pulmonary tuberculosis. PLoS One. 2011; 6:e27848.
38. Zhang G, Zhou B, Wang W, Zhang M, Zhao Y, Wang Z, et al. A functional single-nucleotide polymorphism in the promoter of the gene encoding interleukin 6 is associated with susceptibility to tuberculosis. J Infect Dis. 2012; 205:1697–1704.
crossref
39. Liang B, Guo Y, Li Y, Kong H. Association between IL-10 gene polymorphisms and susceptibility of tuberculosis: evidence based on a meta-analysis. PLoS One. 2014; 9:e88448.
crossref
TOOLS
Similar articles