

 PDF
PDF ePub
ePub Citation
 Print
Print


INTRODUCTION
An elevated concentration of plasma low density lipoprotein (LDL) cholesterol is a major cause of atherosclerosis, which subsequently causes the development of cardiovascular diseases.12 Since Abifadel, et al.3 reported mutations in the proprotein convertase subtilisin/kexin type 9 (PCSK9) gene in an autosomal dominant form of familial hypercholesterolemia, while Cohen, et al.4 reported that the loss-of-function mutations in PCSK9 have the effects of lowering the LDL-cholesterol level and reducing the risk of coronary heart disease, PCSK9 has attracted scientific and industrial attention as a safe and potent target of hypercholesterolemia treatment.
Several strategies have been applied in the development of PCSK9 inhibitors: reduction of the amount of PCSK9 to induce the LDL receptor (LDLR); inhibition of the catalytic activity of PCSK9; and obstruction of the interaction of PCSK9 with the LDLR (reviewed by Farnier5). It has been reported recently that monoclonal antibodies targeting PCSK9 were the most successful approaches in several clinical human trials.678 Inhibition of PCSK9 synthesis by siRNA9 or inhibition of PCSK9 binding to the LDLR by small peptide inhibitors1011 are other promising approaches to the development of hypercholesterolemia therapeutics. However, the most preferred approach in terms of pharmaceutical development would be small molecules targeting PCSK by reducing either the amount or the activity of PCSK9. Structure-based screening of small molecules targeting the protein-protein interaction is a powerful tool in drug development when the structure of the target protein is well established.12 The structure of PCSK9 and its binding motif to the EGF-A domain of the LDLR is well-characterized by several researchers.131415 In this regard, the PCSK9-LDLR interaction can be a good target for the application of in silico virtual design of small molecules for drug development.
In this study, we intended to develop inhibitors of PCSK9-LDLR interaction using the in silico screening approach, which can be carried out by researchers in a standard laboratory, even when they are unaccustomed to comprehensive computational study. We screened a commercially available chemical library using the GOLD algorithm and found that selected chemicals may inhibit the protein-protein interaction targeting PCSK9 and the LDLR, thus acting as a modality for hypercholesterolemia treatment.
MATERIALS AND METHODS
General methods and supplies
The selected chemicals as putative inhibitors of PCSK9-LDLR interaction were purchased from ChemBridge (San Diego, CA, USA). The polyclonal antibody against the LDLR was raised in rabbits using the synthetic peptide spanning the C-terminus of the bovine LDLR (amino acids 832-841) as described previously.16 Other reagents otherwise not specified were obtained from Sigma-Aldrich (St. Louis, MO, USA) or prepared as described previously.17
In silico screening of the chemical library
Amino acids from 367 to 381 within PCSK9 where the EGF-A domain of the LDLR binds were considered to be the target of the inhibitors. The initial crystal structure of PCSK9 from the Protein Data Bank was constructed in the presence of the EGF-A domain of the LDLR at neutral pH. After removal of the EGF-A domain, the PCSK9 structure was remodeled by removal of water molecules and supplementation of hydrogen atoms. The docking scores of chemicals from the ChemBridge Express collection (~450,000 chemicals) were calculated using GOLD software version 4.0.1.18 A maximum of ten docked poses were calculated for each chemical, with a searching efficiency of 200%. The top 100 chemicals with the highest Chemscore were selected for further evaluation.
Cell culture
HepG2 cells (ATCC number HB-8065) were maintained in medium A (DMEM containing 100 units/mL penicillin and 100 µg/mL streptomycin sulfate) supplemented with 10% (v/v) fetal bovine serum at 37℃ under a humidified atmosphere of 5% CO2. For treatment of cells with chemicals, cells were washed twice with phosphate-buffered saline (PBS), and changed to medium A supplemented with 10% delipidated serum19 in the presence of chemicals on day 1. On day 2, cells were washed twice with PBS, harvested, and processed for immunoblot analyses or the fluorescence-labeled LDL uptake assay.
PCSK9-LDLR inhibition assay
Inhibition of the PCSK9-LDLR interaction by chemicals was assayed using a CircuLex PCSK9-LDLR in vitro binding assay kit (MBL International, Woburn, MA, USA) with minor modifications. Briefly, each chemical was pre-incubated with 100 µL of the recombinant His-tagged PCSK9 (1 µg/mL) at a final concentration of 100 µg/mL for 1 h at room temperature with gentle shaking. The mixtures were added to an ELISA plate that was coated with EGF-AB peptide of the LDLR. Subsequent procedures were performed according to the manufacturer's instructions. Relative inhibition was denoted as the difference in percentile between the intensity of the PCSK9-LDLR binding in the presence of the chemical and that in the presence of the vehicle (DMSO), which was set as 100%.
Immunoblot analysis
Total cell lysate of HepG2 cells was prepared as described previously.17 Aliquots of proteins were subjected to SDS-polyacrylamide gel electrophoresis and immunoblot analysis according to the standard protocol. The amount of the LDLR and the mature form of PCSK9 were measured using ImageJ software.20
Analyses of LDL-cholesterol uptake
The LDL-cholesterol uptake was measured using florescence-tagged human LDL (Dil-LDL; Biomedical Technologies, Stoughton, MA, USA). After treatment of HepG2 cells with the chemicals, the cells were incubated with Dil-LDL for 2 h. The intensity of cellular fluorescence was quantitated using a FACS-calibur flow cytometer (BD Biosciences, San Jose, CA, USA).
Animal experiment
All animal experiments were performed with the approval of the Institutional Animal Care and Use Committee at Yonsei University Health System. Eight-week-old male C57BL/6J and Pcsk9 knockout (Pcsk9-/-) mice were purchased from the Jackson Laboratory (Bar Harbor, ME, USA). Mice were maintained on 12-h dark/12-h light cycles with free access to water and the standard rodent chow diet (LabDiet, St. Louis, MO, USA). The stock solutions of selected chemicals (20 mg/mL in DMSO) were diluted in phosphate-buffered saline and were injected into the tail vein, at 1 mg/kg/day for 2 consecutive days at the start of the dark cycle. All mice were fasted for 2 h before euthanasia which was carried out 18 h after the second injection at the end of the dark cycle. After euthanasia, blood was collected in the presence of 2 mM EDTA and aprotinin from inferior vena cava for plasma preparation, and livers were stored at -70℃ for later use. Determination of the concentration of total cholesterol (TC), and triacylglycerol, and fast performance liquid chromatography (FPLC) of lipoproteins in plasma were carried out as described previously.21
Statistical analysis
The correlation between the order of docking scores and experimental variables (relative inhibition, Dil-LDL uptake, and amounts of LDLR, and PCSK9) was analyzed by Spearman's rank-order correlation coefficient method using SPSS software (version 20, IBM Corporation, Armonk, NY, USA). All statistical tests were bilateral, and p<0.05 was considered statistically significant.
RESULTS
Evaluation of in silico screening for correlation with functionality in vitro
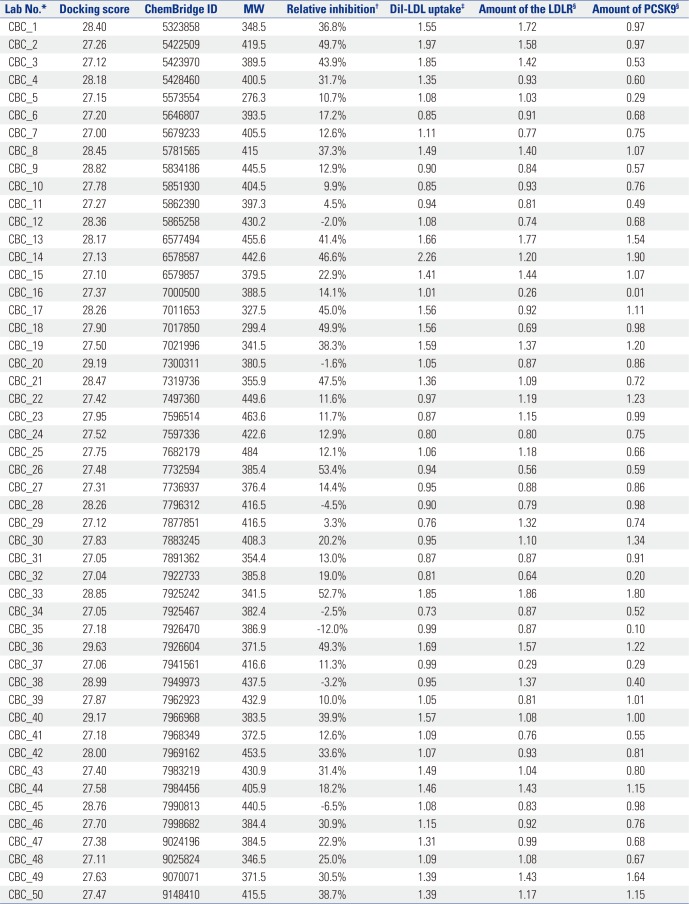
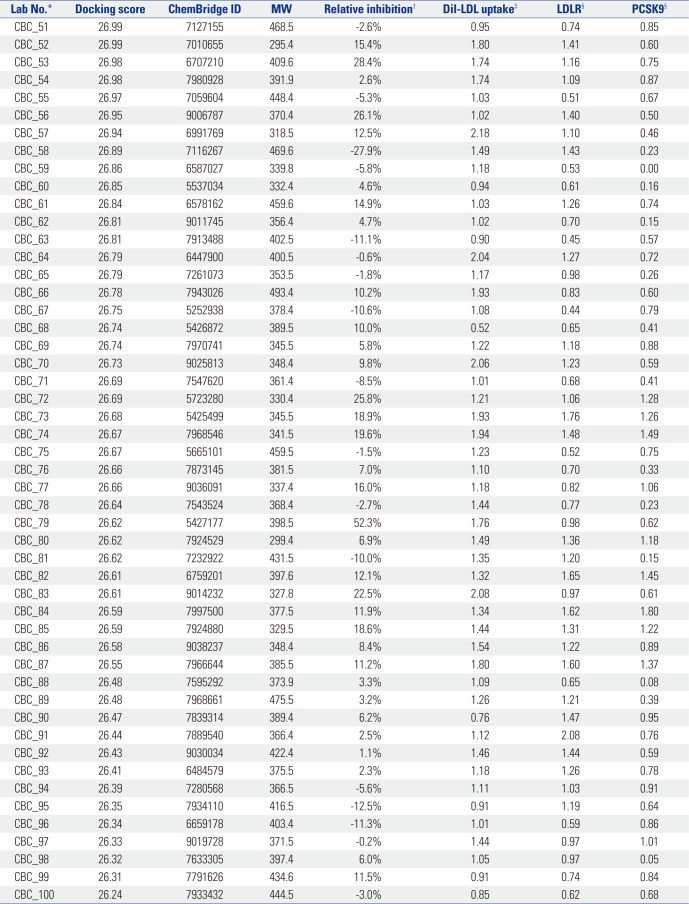
The top 100 chemicals with the highest docking score from the ChemBridge Express collection were selected via docking simulation using the GOLD algorithm. To evaluate the validity of this virtual screening as a tool for developing PCSK9 inhibitors, we performed the following set of in vitro experiments in HepG2 cells: a PCSK9 inhibition assay using the in vitro PCSK9-LDLR binding assay kit, a LDL-cholesterol uptake assay using fluorescence-labeled Dil-LDL, and immunoblot analyses for PCSK9 and the LDLR. The ChemBridge IDs of chemicals, their docking scores, and in vitro effects of chemicals are listed in Supplementary Table 1 and 2 (only online).
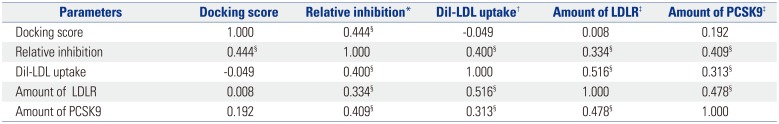
To explore the relationship between the order of docking scores and in vitro variables (relative inhibition, Dil-LDL uptake, and amounts of LDLR and PCSK9), we determined the Spearman correlation coefficients (ρ). As shown in Table 1, the order of docking scores correlated closely with the inhibition of PCSK9-LDLR binding (relative inhibition; ρ=0.444, p<0.01). However, being different from what we expected, the order of docking scores did not correlate significantly with changes in the Dil-LDL uptake and the amount of LDLR. A weak relationship of the order of docking scores with the increase in the amount of PCSK9 was observed (ρ=0.192); however, this correlation was insignificant statistically. Most notably, the inhibition of PCSK9-LDLR binding by chemicals correlated with all parameters significantly: fluorescence-labeled LDL-cholesterol uptake (Dil-LDL uptake, ρ=0.400, p<0.01), the amount of LDLR (ρ=0.334, p<0.01), and the amount of PCSK9 (ρ=0.409, p<0.01). The Dil-LDL uptake correlated with the amount of LDLR (ρ=0.516, p<0.01) most strongly, and there was also a correlation with the amount of PCSK9 (ρ=0.478, p<0.01). The amount of PCSK9 showed positive correlation with the relative inhibition of PCSK9-LDLR binding (ρ=0.409, p<0.01), the Dil-LDL uptake (ρ=0.313, p<0.01), and the amount of LDLR (ρ=0.478, p<0.01). These results suggest that the docking score alone is insufficient for functional validation of candidate chemicals; however, it has strong potential for the prediction of blocking ligands for PCSK9 when one of the in vitro experiments, particularly the PCSK9-LDLR binding assay, is carried out concurrently.
Effects of CB_36 and its analogs in vitro
Effects of the chemical with ChemBridge ID #7926604 (lab ID, CB_36), which had the highest docking score (Supplementary Table 1, only online), and its three-dimensional analogs (#7632817 and #7338220) proposed by ChemBridge's online website (http://www.hit2lead.com/) were evaluated for in vitro parameters in HepG2 cells. The structures of these chemicals are depicted in Fig. 1. The concentrations of chemicals applied were determined experimentally and set as low as possible. All three chemicals increased the expression of the LDLR and PCSK9 in a dose-dependent manner (Fig. 2A). The decrease in the LDLR and PCSK9 by the compound #7632817 at a concentration of 20 µg/mL appeared to be due to cytotoxicity (Fig. 2A, lane 12). The uptake of Dil-LDL was increased accordingly with the increase in LDLR and PCSK9 expression (Fig. 2B). When the intensity of the fluorescence in cells was quantitated using flow cytometry analysis, CB_36 at 5 µg/mL increased the uptake of Dil-LDL by a factor of 1.69 compared to the vehicle (DMSO) (Fig. 2C). Interestingly, #7632817, the compound that had the most similar three-dimensional structure (94%) and was predicted not by the GOLD algorithm but by ChemBridge, increased the Dil-LDL uptake most strongly by a factor of 2.13. Chemical #7338220 (75% similarity) was relatively less effective in increasing the LDL uptake (by a factor of 1.37 at a concentration of 30 µg/mL). These results suggest that CB_36 and its analogs function to increase the uptake of LDL cholesterol in HepG2 cells despite the simultaneous increase in the amount of PCSK9.
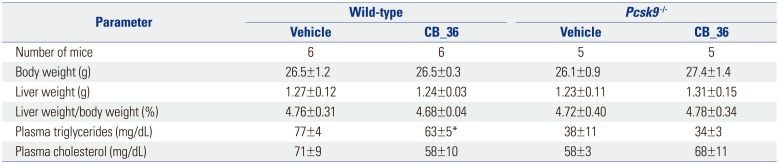
In vivo effects of CB_36 in wild-type and Pcsk9 knockout mice
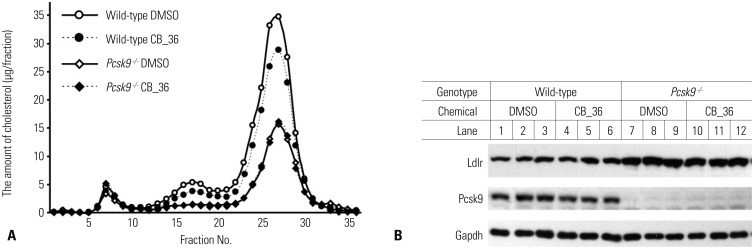
Due to the unavailability of the compound #7632817, which showed the most effective LDL-cholesterol uptake in HepG2 cells, the effect of only CB_36 was elucidated on the plasma cholesterol level in wild-type and Pcsk9-/- mice. The chemical #7338220 was not evaluated due to its weak effect on the uptake of Dil-LDL in HepG2 cells. C57BL/6J male mice (six per group) and Pcsk9-/- mice (five per group) were injected with CB_36 via tail vein at a concentration of 1 mg/kg for 2 consecutive days, and metabolic parameters were evaluated (Table 2). CB_36 significantly lowered the concentration of TC in wild-type mice by 18% compared to that in vehicle-treated mice (p<0.05), while the other phenotypic parameters in wild-type mice remained unchanged. More importantly, CB_36 had no effect on any parameters in Pcsk9-/- mice, suggesting that the action of CB_36 may involve a PCSK9-dependent pathway. The decrease in the plasma concentration of TC by CB_36 in wild-type mice was re-defined as a consequence of the decrease in LDL fractions in the lipoprotein profile determined by FPLC in wild-type mice (Fig. 3A; fraction numbers 15-22), while no change was observed in Pcsk9-/- mice. In wild-type mice, CB_36 also lowered the cholesterol level in fractions containing high-density lipoprotein (Fig. 3A; fraction numbers 23-30), of which the ApoE was also the ligand to the LDLR.22 However, in contrast to the results from HepG2 cells, CB_36 showed no differences in the amounts of LDLR and PCSK9 in the livers of wild-type or Pcsk9-/- mice (Fig. 3B). These results strongly suggest that CB_36 has the effect of lowering the TC level in plasma, particularly by lowering the LDL fraction of lipoproteins in a PCSK9-dependent manner, although amounts of LDLR and PCSK9 in the liver remained unchanged.
DISCUSSION
Inhibition of PCSK9 is an attractive objective in the development of new therapeutics for hypercholesterolemia. As almost all patents of statin drugs expired recently, numerous pharmaceutical industries are devoting effort to developing new drugs that can be used in patients with hypercholesterolemia in combination with statins. The other advantage of PCSK9 inhibition is possible augmentation of the cholesterol-lowering effect by statins, which induce simultaneously the expression of PCSK9 and LDLR. Among several strategies applied for the development of PCSK9 inhibitors, it is evident that the most up-to-date approach is the use of monoclonal antibodies against PCSK9. However, the cost-effectiveness and the injection route of antibody therapeutics into patients with hypercholesterolemia alone would be the major obstacles to overcome. In this respect, recent advances in public computational algorithms and open chemical databases have enabled standard laboratories to carry out a large-scale screening of small molecular inhibitors of protein-protein interaction for drug development at ease. In silico virtual screening has been used to discover many small-molecule inhibitory ligands for enzymes such as BCR-ABL tyrosine kinase,23
P. falciparum dihydrofolate reductase,24 and inhibitors of proteinprotein interaction such as interaction between insulin-like growth factor-1 and the N-terminus of the IGF-binding protein-525 or the C-terminal tail of myosin A and the myosin-tail interacting protein in P. falciparum.26 However, without any evident reason, there have been no known reports involving searches for small chemical molecules that inhibit PCSK9-LDLR interaction.
In this study, we report the first approach for the development of small molecular inhibitors targeting the protein-protein interaction between PCSK9 and the LDLR by performing in silico virtual screening using commercially available chemical libraries and the GOLD algorithm. In general, in order to acceptably predict desirable compounds, multiple selection processes using various docking programs such as AutoDock Vina27 or Glide28 must be applied; however, we did not attempt to complete these comprehensive processes, as the primary purpose of this study was to evaluate the usefulness of relatively simple in silico chemical development methods that offered ease of use.
CB_36, the chemical with the highest docking score among 100 predicted chemicals, was validated for its ability to inhibit the binding of PCSK9 to the EGF-AB domain of the LDLR in a dose-dependent manner (Supplementary Fig. 1, only online). Detailed kinetic studies on the mechanism of inhibition by CB_36 were not carried out, as the required research resources were unavailable and the purpose of this study was limited to the overall evaluation of the application of in silico screening. Direct evidence by mapping the ligand-binding site by site-directed mutagenesis of PCSK9 or by performing NMR studies, for example, needs to be obtained in future studies. CB_36 and its two analogs, which were proposed by Chem-Bridge's web-based information, inhibited the PCSK9-LDLR interaction and increased the amount of LDLR, PCSK9, and the uptake of LDL-cholesterol in vitro. Most importantly, CB_36 lowered the total plasma cholesterol level in wild-type mice, particularly LDL cholesterol. Several additional chemicals other than CB_36 showed similar results both in vitro and in vivo (data not shown). However, the mechanism for this cholesterol-lowering effect by CB_36 could not be elucidated in mice, as the amounts of LDLR and PCSK9 remained unchanged by CB_36. It is possible to assume that additional mechanisms exert a feedback reconstitution of the LDLR after an increase in the metabolism of LDL cholesterol in the liver as in lovastatin-treated wild-type mice, which showed a decrease in plasma LDL cholesterol despite a slight decrease in LDLR expression.22
Additional concrete evidence for the usefulness of these chemicals remains to be provided, for example, whether these chemicals bind to PCSK9 directly, whether their effects are mediated by PCSK9 in a specific-manner, whether they are safe enough for practical application in patients, and why the decrease in blood cholesterol level by chemicals is minimal compared to that caused by statin drugs. However, this study provides strong support for in silico screening of chemical libraries for the development of new cholesterol-lowering agents that inhibit the interaction between PCSK9 and the LDLR.


 XML Download