

 PDF
PDF ePub
ePub Citation
 Print
Print


INTRODUCTION
The genetic and molecular heterogeneity of tumors is a major obstacle for cancer therapy.1 Heterogeneity elicits variable responses to anti-cancer drugs. In some tumor types, pharmacological responses are not random but may be predicted by multi-featured molecular signatures. Thus, a molecular footprint of a common set of mechanisms may exist within a specific tumor subgroup.2
Based on the success of imatinib (Gleevec), a reductionist approach to inhibit the function of a single cancer-driving somatic mutation has been a major strategy in the development of anti-cancer drugs. These targeted anti-cancer therapies consist of small molecule inhibitors of the target protein or monoclonal antibodies targeted against various membrane-associated receptors. Although targeted therapies may blunt cancer-driving signaling events, intrinsic and acquired resistance generally occur due to a robust signaling network that can compensate for inhibition of a single perturbation.3 To overcome this challenge, a proper model system that embraces the genetic heterogeneity and robust biological network of the original tumor is required.
Cancer cell lines traditionally serve as important models for oncology research, cancer drug discovery, and preclinical studies.45 The primary somatic alteration is generally preserved in a cancer cell line; further, cancer cell lines are usually able to form tumors in vivo. In addition, cancer cell lines demonstrate pharmacological characteristics similar to those of the primary tumor of origin. For example, cancer cell lines that express mutant epidermal growth factor receptor (EGFR) show sensitivity to erlotinib treatment, similar to the tumor from which they were derived.6 Recent advances in genomic technologies provide unique opportunities to systematically identify predictive biomarkers. These advances involve the simultaneous profiling of multi-omics features with drug responses or hypomorphic phenotypes in the same cell line. Steady-state multi-omics profiles include transcriptome abundance, single nucleotide variation, DNA copy number alteration, and protein abundance. These profiles can be measured with technologies, such as microarrays, next-generation sequencing (NGS), and reverse-phase protein arrays (RPPA). Profiles are often freely available from public domains. Due to advances in multiomics technologies, cell-based phenotypic drug discovery strategies have recently gained traction for addressing the aforementioned challenges.
In this review, we discuss the utility and caveats of established cancer cell lines for companion discovery of therapeutic targets/drugs and enrollment biomarkers. In addition, we summarize publically available multi-omics data sets for cancer cell lines from major tumor types. We also provide an up-to-date summary of available computational algorithms and statistical tools for analyzing large-scale screening data and performing further integrative genomics analyses for biomarker discovery. The identification of new therapeutic targets and agents linked to companion biomarkers may provide new options for cancers that have failed to respond to the current anticancer drug discovery paradigm.7
HISTOLOGICAL PERSPECTIVE
A continuously growing cancer cell line is a critical resource for studying mechanisms of tumorigenesis and screening for antineoplastic agents. However, establishing such a line was a major challenge until the early 1950s. The first human cancer cell line, HeLa, was established from cervical cancer tissue isolated from a 30-year-old woman named Henrietta Lacks by the American scientist George Gey.8 Additional cancer cell lines from different lineages, including lung,9 breast,10 ovarian,11 melanoma,12 colorectal,13 pancreatic,14 and prostate, were subsequently established.1516 A significant number of these cell lines are commercially available from several nonprofit biological resource centers, such as the American Type Culture Collection (ATCC).
These cancer cell lines have been assembled into panels, which span multiple tumor types, to facilitate disease-oriented screening of anticancer drugs.17181920 These panels have also been useful for repositioning of cancer drugs.212223 The most famous and widely used panel is the U.S. National Cancer Institute (NCI) 60, which represents nine distinct tumor types (leukemia, melanoma, and cancers of the colon, lung, brain, kidney, ovary, breast, and prostate).24 A similar derivative, the JFCR39 panel, replaced some of the lines in the NCI60 with six gastric cancer lines to represent one of the most common tumor types in East Asia. These focused panels have successfully facilitated the screening and lineage selectivity of first-line chemotherapeutic agents. However, cancer genome sequencing efforts have increased our understanding of tumor heterogeneity. In addition, a novel class of anti-cancer agents that targets genuine somatic alterations has shown great success. Thus, a larger panel that embraces a significant portion of the recurrent genetic lesions and molecular diversity of cancer is needed. Several new panels have been developed to identify novel genetic and molecular enrollment biomarkers for chemotherapeutic agents. These panels include the Cancer Cell Line Encyclopedia (CCLE; 947 cancer lines),21 Genomics of Drug Sensitivity in Cancer (GDSC; 639 cancer lines),2225 Cancer Target Discovery and Development (CTD2; 242 cancer lines),2326 Center for Molecular Therapeutics 1000 (CMT1000; 1000 cancer lines),56 and GlaxoSmithKline (GSK) (311 cancer lines).27 The same approach has been extended to a concordant discovery of biomarkers and small molecule lead compounds using a lung cancer cell line panel.28
PROS AND CONS OF CANCER CELL LINE MODELS
Preclinical models of cancer typically include genetically engineered mouse (GEM) models, tumor grafts, and in vitro cell line models.18 Each of these models has unique strengths and limitations. GEM models recapitulate the somatic alterations that drive human cancers; thus, these models are especially relevant for studying tumor initiation, progression, and vulnerabilities. To generate a GEM model, cancer-driving genetic changes are introduced into the mouse germ line as a transgene or via mutagenesis. Xenograft tumor models are made by implanting primary tumor tissues (patient-derived xenograft, PDX) or by inoculating established cancer cell lines orthotopically or subcutaneously into immunodeficient mice. Despite their clinical relevance, in vivo models are not adequate for largescale studies. In addition, in vivo models cannot embrace the wide range of tumor diversity found in patients or for high-throughput screening of antineoplastic agents. These challenges can only be addressed by in vitro cell line models; however, recent controversy has surrounded the use of in vitro cell lines as a model system for cancer research. Specifically, cell lines are prone to artificial selection during prolonged culturing, which skews gene expression programs, including those related to multidrug resistance.29 One study that compared mutations, changes in DNA copy number, and mRNA expression profiles found significant differences between ovarian cancer cell lines and high-grade serous ovarian tumor samples.30 In contrast, a similar experimental approach revealed consistency between cell lines and primary samples in other studies of other tumor types.421 Another potential concern with established cell lines is cross-contamination.31 Further, the tumor microenvironment (TME) is completely absent in cell line models.32 Because the stromal cells and immune cells of the TME make significant contributions to tumor development and metastasis, the inability of cell lines to account for their effects is viewed as a limitation. There is also the potential for bias due to the underrepresentation of tumor types from certain lineages or genetic subtypes, such as prostate cancer lines and cancer lines expressing wild-type TP53.5 Finally, inconsistent data regarding the response of a given cell line to a specific drug has been demonstrated across different platforms, raising concerns about reproducibility or reliability.33
Despite these caveats, a number of discoveries made from cell line models have clinical implications. For instance, the finding that the T790M mutation in EGFR underlies acquired resistance to EGFR inhibitors was made using a lung cancer cell line model.34 This information facilitated the recent development of an irreversible second-generation EGFR inhibitor.35 Similarly, the finding that upregulation of the platelet-derived growth factor receptor B or mutation of NRAS causes acquired resistance to BRAF (V600E) inhibition was made in melanoma cell lines and validated in patients.36 Most importantly, a number of studies show that cancer cell lines reproducibly display clinically validated correlations between biomarkers and drug sensitivity.5212225
EVOLUTION OF METHODS FOR ESTABLISHING AND CHARACTERIZING CANCER LINES
Due to the discrepancies between in vivo and in vitro conditions, most primary cells are extremely difficult to grow directly in vitro. In addition, the in vivo growth environments required for tumors of different lineages are highly variable and generally unknown; thus, approaches based on trial-and-error are employed until optimal growth conditions for cancer cells from each lineage are identified. Traditional methods for establishing permanent cell lines from lung cancer have been relatively well-documented. Briefly, resected tumor tissues are mechanically or enzymatically dissociated into single cells. These cells are then grown on collagen-coated tissue culture dishes in specialized media, such as ACL4 or HITES without fetal bovine serum (FBS), to remove contaminating normal cells. Cells are then grown on media with FBS to boost the growth of cancer cells.37 Unfortunately, this traditional approach has yielded relatively low rates of establishing cancer cell lines, with only 4.5% and 9.7% success rates for lung and colon cancers, respectively.3839
New methods that significantly increase the efficiency of establishing cell lines have recently been introduced. One method involves establishing cancer cell lines from PDX tumor models. Although this method is indirect, the end result has a higher success rate.39 Conditionally reprogrammed cell culture (CRC) methods have also been used to selectively amplify non-fibroblast epidermal cells in a mixed cell population cocultured with irradiated feeder cells.40 Feeder cells together with a Rho-associated protein kinase (ROCK) inhibitor allow selective proliferation of epithelial cells. This method enables matched tumor/normal cell line models to be generated from a single patient in a relatively short period of time compared to that developed with the traditional transgenesis method.41 Crystal, et al.42 recently applied the CRC method to effusions and biopsies from lung cancer patients and reported a success rate of 50%. Using this CRC-generated cell line model, the investigators identified novel combinatorial therapeutic strategies for non-small cell lung cancers (NSCLCs) that have acquired resistance to targeted therapies. Three-dimensional organoid culture models, in which resected tumor specimens or biopsies are grown in Matrigel supplemented with required tissue-specific growth factors, are another emerging method for establishing cell lines. This in vitro model mimics original tumor growth more accurately than that of traditional two-dimensional culture methods. Further, organoids successfully recapitulate various features of primary tumors.4344 Boj, et al.44 recently established human pancreatic organoids from resected tumors with a success rate of approximately 80%.
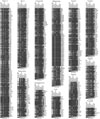
To identify the factors underlying tumor diversity, initial efforts focused on targeted sequencing of commonly mutated genes.154546 Identified somatic DNA alterations from primary and metastatic tumors as well as from established cancer cell lines have been deposited in the Catalog of Somatic Mutations in Cancer database. The information in this database is professionally curated with published literature regardless of the discovery platform.47 Recently innovated platforms in microarray and NGS technology have allowed more in-depth and high-resolution profiling of cancer variations, including gene expression changes in various cancer cell lines4849 and genome and exome level deciphering of DNA variations at relatively low cost. In addition, epigenomic50 and proteomic profiles are also beginning to be employed for such analyses.51 These multi-omics characterizations of cancer cell lines have been pursued for various lineages of tumors, including breast,46525354 lung,45555657 gastric,58 melanoma,12 pancreatic,1459 colorectal,1360 glioblastoma,61 ovarian,1130 prostate,1516 and pan-cancer lines.19212223254962 The annotated established cancer cell lines for 12 major solid tumor types have been surveyed and summarized with respect to the type of assay and depth of corresponding orthogonal data sets (Fig. 1).
Beyond in vitro cell line models, genomic technologies fueled efforts to catalog somatic variations in thousands of tumor tissue specimens from various tumor types.63 The Cancer Genome Atlas (TCGA) project began in 2005 following the success of imatinib and the invention of NGS technologies. The first round of the project sought to discover the most highly recurrent mutations by sequencing at least 500 cases for each cancer type, which initially included nine major tumor types. The TCGA has now expanded to more than 30 tumor types and has also begun to characterize hundreds of rare tumor types. These data led to high-resolution mapping of somatic alterations in major tumor types, including glioblastoma, ovarian carcinoma, colorectal cancer, lung squamous cancer, breast cancer, acute myeloid leukemia, endometrial cancer, kidney cancer, bladder cancer, lung adenocarcinoma, and gastric cancer (http://cancergenome.nih.gov). Importantly, all of the multi-level discoveries from the TCGA are publically available and searchable through cBioPortal (http://www.cbioportal.org).64
UTILITY OF CANCER CELL LINE PANELS: DRUG DISCOVERY AND REPOSITIONING
The Developmental Therapeutics Program (DTP; http://dtp.nci.nih.gov) of the U.S. NCI employed the NCI60 cancer cell line panel in the early 1990s for the screening of anti-cancer drugs after experiencing failure with mouse model screening systems. More than 100000 compounds have been tested with this panel.4 Some of the candidate compounds were examined by secondary screening in xenograft tumor models. Initially, the screen was focused on cytotoxic agents that kill the majority of cancers or a certain lineage of cancer. These early efforts with cancer cell lines helped position several cytotoxic agents as first-line treatment options for many tumor types.
There is a significant amount of inter- and intra-tumor heterogeneity. Thus, the identification of subtypes that share vulnerabilities to particular therapeutic agents and enrollment biomarkers that predict anti-tumor responses are one of the top priorities in cancer research. Most cancer-driving genetic variations are found in only a small percentage of patients, with the exception of a few hotspot mutations. For example, response rates to gefitinib and crizotinib are only 15% and 6%, respectively, in patients with lung cancer. These low response rates are based on the low incidence of EGFR and ALK mutations, which are predictive of sensitivity to these targeted agents. Therefore, in vitro efforts to systematically identify this kind of precision vulnerability must have sufficient statistical power to address the low frequency of the target variations. During the past few years, several groups have attempted to implement systematic approaches to identify drug-biomarker relationships for cytotoxic and targeted agents at various clinical and preclinical stages in hundreds of cell lines. The most important projects include the CCLE, GDSC, CTD2, CMT1000, and GSK, which are all described in detail below.62122232527
The CCLE project compiled multi-omics data from 947 cancer cell lines and included targeted deep sequencing of 1600 genes and array-based determination of chromosomal copy number changes and mRNA expression levels.21 Among the included cell lines, 479 were analyzed with an eight-point dose response assay for 24 targeted and cytotoxic agents. Correlation analyses between multi-omics profiles and pharmacological profiles identified anti-cancer drugs that are associated with genetic-, lineage-, and gene expression-based predictors. As proof of concept, this analysis rediscovered known druggene relationships, including PLX4720 (RAF inhibitor) and BRAF mutation, PD-0325901 (MEK inhibitor) and BRAF mutation, erlotinib (EGFR inhibitor) and EGFR mutation, lapatinib (HER2 inhibitor) and ERBB2 amplification, PF-2341066 (MET/ALK inhibitor) and MET amplification, Nutlin-3 (inhibits p53-MDM2 interaction) and MDM2 overexpression, and 17-AAG (Hsp90 inhibitor) and NQO1 expression. Known drug-lineage relationships, such as the effect of panobinostat (HDAC inhibitor) in hematologic cell lineages, were also assessed as proof of concept. Importantly, these analyses identified previously unknown relationships, such as irinotecan (topoisomerase I inhibitor) sensitivity and SLFN11 expression, PD0325901 and AHR expression in NRAS mutant cancer, and AEW541 (IGF1 receptor inhibitor) and multiple myeloma. This CCLE approach was extended to 345 small molecule probes that modulate known target molecules and pathways important for cancer in a subset of CCLE cell lines (n=242) enriched for preannotated genomic features.23 This group, which was a part of the NCI Cancer Target Discovery and Development Network (CTD2),26 identified mutations in β-catenin as predictors of sensitivity to navitoclax, a BCL-2 inhibitor. Furthermore, this group built a web-based portal called the Cancer Therapeutics Response Portal (http://www.broadinstitute.org/ctrp) to help researcher access to their discoveries.
The same strategy was employed by a collaboration effort between the Cancer Genome Project (CGP) at Wellcome Trust Sanger Institute and Cyril Benes' group at Harvard.22 This project assembled 639 cancer lines and performed targeted exome-seq and microarray-based copy number analysis and mRNA profiling. The cell line panel was examined with a ninepoint dose response assay to generate pharmacological profiles for 130 drugs that are in clinical and preclinical stages of investigation. This project reproduced many preconceived drug-biomarker relationships, such as PLX4720-BRAF mutation, lapatinib-ERBB2 amplification, PD-173074 (FGFR inhibitor)-FGFR2 mutation, Nutlin-3-TP53 mutation, and PD-0332991 (CDK inhibitor)-RB1 inactivation. Novel discoveries from this effort include drug-lineage relationships, such as obatoclax mesylate (MCL1 inhibitor)-melanoma, and drug-gene relationships, such as ABT263-NOTCH1 mutation, 17AAG-STK11 inactivation, MS275 (HDAC inhibitor)-FBXW7 loss, 681640 (WEE1 and CHK1 inhibitor)-TET2 loss, and AZD2281 (PARP inhibitor)-EWS/FLI1 rearrangement. The GDSC web portal (http://www.cancerrxgene.org) provides a user-friendly interface that enables gene or drug queries to identify matching relationships.25
An earlier study from Jeffrey Settleman's group at Harvard examined the oncogenotypes of 500 cancer cell lines by targeted resequencing, genomic copy number variations, and mRNA expression levels using a microarray platform. Greshock, et al.27 at GSK used a similar approach to assess 311 cancer lines. These groups evaluated the genetic and molecular subtype-dependent vulnerabilities to 14 kinase inhibitors and 19 targeted/anti-mitotic agents, respectively. The Settleman group utilized the CMT1000 panel to recapitulate known genotype-drug sensitivity relationships including that of erlotinib with EGFR mutation, PHA665752 (MET inhibitor) and MET amplification, and AZ628 (BRAF inhibitor) with BRAF mutation.6 The GSK group found that PI3K/AKT and MEK inhibitors are selective for the luminal and basal subtypes of breast cancer lines, respectively, and that IGF-1R inhibitors are selective for colon cancer lines.27
Identical driver alterations do not necessarily behave the same in different tumor types. For example, most melanomas with BRAF (V600E) mutations respond to specific inhibitors of the BRAF oncoprotein, whereas colon cancers with the same mutation do not respond.65 Thus, in addition to feature-centric pan-cancer analyses, lineage-focused panels are important for the companion discovery of anti-cancer drugs and enrollment biomarkers within a tumor type. For example, Ashraf, et al.66 found that the mutational status of KRAS/BRAF/PIK3CA exon 20/PTEN predicts the efficacy of cetuximab in a study of 64 colorectal cancer cell lines. The highly annotated lung cancer cell line panel (n=84) created by Drs. Adi Gazdar and John Minna at UT Southwestern Medical Center has also been used to screen for predictive biomarkers of response to clinical compounds.67 Using this panel, the investigators re-discovered that the gatekeeper mutation T790M in EGFR confers resistance to EGFR inhibitors. Further, they discovered that cancers with KRAS mutations are sensitive to Hsp90 inhibition in vitro and in vivo.67 Recently, as part of the CTD2 network, our group utilized the same lung cancer cell line panel to simultaneously screen for small molecule drug candidates and enrollment biomarkers anchored to a specific pair of cancer/normal cell lines from a single patient. For this project, 260000 synthetic small molecules were subjected to multiple rounds of single-dose and confirmation screenings followed by 12-point dose response assays in the entire panel of lung cancer cell lines. We identified an indolotriazine compound that is selectively toxic in a subset of lung cancer lines. These lines share a common multi-gene expression signature. In addition, the indolotriazine compound induces a robust endoplasmic reticulum stress response.28
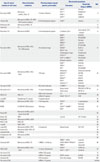
The main discoveries made with these pan-cancer or lineage-focused large-scale studies employing cancer cell line panels are summarized in Table 1.
UTILITY OF CANCER CELL LINE PANELS: TARGET IDENTIFICATION THROUGH FUNCTIONAL GENOMICS
Current techniques for sequencing-based discovery of therapeutic cancer targets have clear limitations. A significant fraction of tumors do not harbor known druggable driver mutations. Instead, these cancers often have mutated tumor suppressor genes, the functions of which are difficult to restore therapeutically. In addition, some of the major oncogenes, including RAS and MYC, have been pharmacologically intractable to date. Thus, overcoming the challenges of this so-called "dark matter" of current cancer therapeutics remains a priority.68
Reverse genetic loss-of-function screens provide powerful strategies for cell-based identification of genes that are responsible for various phenotypes. RNA interference (RNAi) and the more recently described clustered regularly interspaced short palindromic repeats (CRISPR) and CRISPR-associated (Cas) genes (CRISPR-Cas) systems are examples of such strategies. RNAi screens were the first to map the landscape of putative essential human genes via interruption of gene function at the mRNA level.6970 CRISPR-Cas-mediated screens have allowed the identification of bona fide essential genes by completely abrogating gene function at the DNA level.7172 The genome-wide RNAi approach has been used in a variety of cancer cell line models to identify cancer-selective vulnerabilities and genes that exhibit synthetic lethality in response to anti-cancer drugs. Moreover, RNAi has been extended to lineage- or oncogene-dependent synthetic lethal targets (Table 1). Some of these genetic discoveries can be translated to pharmacological agents via the identification of actionable targets directly from the screen or from systems-level analysis of the hits.
RNAi screens are based on two different delivery platforms: short interference RNA (siRNA) and short hairpin RNA (shRNA). The most straight-forward and simplest method for delivering siRNA to cells is in complex with a lipid-based transfection reagent, although this effect is transient. In contrast, shRNA enables stable knockdown during repeated cell divisions due to the use of a chromosome-integrated vector construct. Therefore, shRNA experiments usually require a few weeks before phenotypic outcomes can be assessed. The three most common platforms for shRNA screens are pLKO by The RNAi Consortium (TRC),73 pGIPZ from a collaboration between Gregory Hannon at Cold Spring Harbor Laboratory and Stephen Elledge at Harvard Medical School,74 and the open source DECIPHER libraries (http://www.decipherproject.net/shRNA-libraries/), which were produced through community efforts.
The first generation TRC library is based on a simple hairpin structure and was used to identify essential cancer genes using pooled hairpins; this method requires post-hoc deconvolution of the individual hairpins.73 Further screenings for lineage-selective essential genes7576 and selective vulnerabilities according to genetic and molecular subtype have identified numerous subtype-vulnerability relationships, including BRAF mutant-BRAF/EGFR co-inhibition,65 KRAS mutant-TBK1 inhibition,77 KRAS mutant-BCL-xL/MEK co-inhibition,78 Myc overexpression-SAE1/2 inhibition,79 RAS mutant-PLK1 inhibition,80 and KRAS dependent cancer lines-STK33 inhibition.81 The TRC library is currently being employed for a large-scale screening for essential genes in a pan-cancer cell line panel as part of "Project Achilles" (http://www.broadinstitute.org/achilles). The second generation pGIPZ platform takes advantage of the stem-loop structure of endogenous miRNA and incorporates our understanding of natural miRNA processing74 to successfully identify cancer targets in vitro and in vivo.828384 Finally, the DECIPHER library is the newest open-source resource that employs the pRSI lentiviral vector system and is available to researchers as pooled collections with a minimum handling fee.
Genome-wide libraries of synthetic siRNA oligos are also commercially available and have been used typically in "onegene, one-well" high-throughput screen formats. In this context, the outcome of transiently depleting an individual gene can be assessed in a relatively short period of time (i.e., within a few days). Discoveries made with siRNA platforms include lineage- and molecular subtype-dependent vulnerabilities, such as the KIF11 dependence of head and neck and lung cancers,85 proteasome addiction of triple-negative breast cancer,86 CSNK1e dependence of MYC-overexpressing cells,87 and KRAS/STK11 dual mutation-driven addiction to lysosomal function in lung cancer.28 Synthetic lethality and mechanisms of resistance to anti-cancer drugs have also been investigated. These studies have revealed that microtubule and proteasome depletion are synthetic lethal for paclitaxel in lung cancer,88 NF1 depletion leads to EGFR inhibitor resistance in lung cancer,89 CDK5 is a synthetic lethal for PARP inhibitor,90 RAS suppression synergizes with MEK inhibitor in KRAS-mutant colorectal cancer,91 and FAT1 is a negative regulator of TRAIL-induced extrinsic apoptosis in glioblastoma.92
A new mammalian gene-knockout tool, the CRISPR-Cas system, is rapidly being adapted in a variety of fields, including cancer functional genomics.93 For example, Tyler Jacks' lab at M.I.T. recently employed CRISPR-Cas for the functional investigation of a panel of tumor suppressor genes in a Krasdriven mouse lung cancer model.94 CRISPR-Cas and other genome editing tools, such as transcription activator-like effector nucleases (TALEN), should facilitate the identification of additional cancer target genes and synthetic lethalities, especially ones that are not detectable by partial knockdown via RNAi methods.
DATA PROCESSING AND IN SILICO ANALYSIS METHODS
Typical cancer cell line-based drug or siRNA screens involve high-throughput assays that employ robotic liquid transfers and handling of thousands of barcode-tagged plates. These assays exhibit batch-to-batch or plate-to-plate variations in the degree of penetrance due to uneven evaporation within a plate or between plates during multiple days of incubation. Therefore, statistical evaluations of screening quality and normalization procedures for correcting these systematic errors are essential. The most popular quality control metric is the Z-factor (Z'), which is a measure of statistical effect size using assay values of positive and negative controls within a plate.95 If the Z' is small or negative, then the assay conditions are not optimal for detecting hits. Thus, these Z' values indicate that those plates should be reconsidered and re-assayed if possible. The normalization step requires the identification of various sources of systematic errors followed by corrections using controls or samples on the plates. One of the most user-friendly tools we developed runs with Microsoft Excel, enabling informed and easy processing of the screening data by the investigators who perform the screens.96
Unlike siRNA or small molecule screens, typical shRNA screens are performed in a single tissue culture vessel per condition. Cells are transduced with a pool of different hairpin molecules, which span the whole gene set. These molecules then compete against each other according to their impact on cell growth. Luo, et al.73 developed a statistical framework, the RNAi gene enrichment ranking (RIGER) score, to test the significance of the effect of a group of hairpins that targeted a single gene. This method is based on the Kolmogorov-Smirnov (KS) statistic, which examines the biased distribution of the hairpins for a gene toward the top of the list. The KS statistic is implemented in the Broad Institute's GENE-E software package (http://www.broadinstitute.org/cancer/software/GENE-E). Alternatively, classical Z score or robust Z score statistics can be adopted to identify individual hit shRNAs.83
Responses to anti-cancer agents vary among cancer lines, possibly due to heterogeneity of the target molecule or pathway. Thus, the pharmacological profile obtained from many cancer cell lines may represent a footprint of the target mechanism of each drug, although the actual target molecule may be unknown. An important contribution of the NCI60 panel is the ability to infer the mode of action (MOA) of a drug based on similarity with a drug that has a known MOA. For example, if a small molecule compound exhibits a sensitivity profile that is very similar to that of erlotinib, it is reasonable to speculate that the compound may function as an inhibitor of EGFR. NCI researchers formulated this concept as a pattern recognition algorithm called COMPARE.24 This algorithm relies on a meangraph pattern created by plotting delta values, which are panel-mean centered Log GI50 or LC50 values of the cell lines. A Pearson product moment correlation coefficient for each set of delta value pairs is then calculated and rank ordered for similarity to a reference set of mean-graphs of chemical probes.97
To identify features that directly correlate with drug response, simple statistical tests, such as multivariate analysis of variance, can be used in cases with two or more dependent variables; these variables may include tissue type, oncogenotype, chromosomal rearrangements, microsatellite instability, or gene expression.22 Identifying a predictive model from multiomics features is challenging because the number of features (i.e., >20000 in multi-omics dataset) is much larger than the number of observations (i.e., drug response from several hundred cell lines). Therefore, a regularization and variable selection method called elastic net outperforms other similar methods, such as ridge regression and lasso.98 Elastic net achieves both sparsity of representation (ridge regression does not) and grouping effect (lasso does not).98 Elastic net has been successfully implemented in recent studies involving large-scale cancer cell line panels.2122 To summarize the method, the optimal values for two parameters, alpha and lambda, are estimated using the Z score-converted input values by cross-validation to minimize error. Bootstrapping is then performed with the optimal parameters and the resampled data to estimate the weight and frequency of the significant features. Biomarkers that exceed the given thresholds for weight and frequency can then be selected.
Recently, the NCI-DREAM drug sensitivity prediction challenge evaluated 44 proposed algorithms for their predictive power based on the drug-response profiles of breast cancer cell lines that were randomly divided into training and test datasets. This community effort identified Bayesian multitask multiple kernel learning (MKL) as the top-performing prediction algorithm.99 The Bayesian multitask MKL is a machinelearning method that integrates nonlinear regression, multitask learning, multiview learning, and Bayesian inference. MKL estimates the kernel weights for each of the multiple profiling data sets (genomic views). Further multitask learning steps estimate the drug-specific regression parameters for all drugs simultaneously with the shared kernel weights across drugs. Bayesian inference is then used to estimate all of the model parameters to leverage uncertainty from a small sample size.99
FUTURE PROSPECTS
The statistical power that is now possible due to the number of available cancer cell lines combined with recent advances in genomic technologies has led to a series of discoveries that were previously deemed impossible. Early efforts were focused on potential repositioning of a variety of anti-cancer drugs according to associated predictive biomarkers. Although this may help to identify patients who are likely to benefit from specific anti-cancer drugs, current therapeutics are not capable of inhibiting all forms of cancer. Many cancer subtypes are resistant to first-line chemotherapy options and do not harbor known targetable somatic mutations; examples include the triplenegative subtype of breast cancer and stem cell-like subtype of colorectal cancer. In this respect, future endeavors should be expanded to include ab initio discovery of new drugs to fill existing gaps. The highest priority should be given to refractory subtypes. Specifically, established cancer cell lines must be properly classified according to tumor molecular subtype100 to allow more focused functional genomic screens or chemical screens for cancers that exhibit poor prognosis and/or drug resistance. However, a substantial number of cancer lines is required for each tumor type to yield robust hits within a subtype. Importantly, recent CRC-based methods promise a faster pace for the accumulation of cell lines.
Major bottlenecks occur when patient-derived cancer cells are used as guides for clinical therapeutic decisions. Recent CRC applications in patient-derived lung cancer tissues took 2-6 months to establish cancer cells in sufficient amounts to perform drug screens.42 Overcoming the bottleneck in sample size, such as from core needle biopsies of lung cancer, and minimizing the time required to obtain a sufficient mass of tissue remain challenges that require further technical innovations.
Another obstacle in cell line-based modeling of drug responses is the poor correlation of drug-response measures among different studies.33 This discrepancy is unlikely to be due primarily to in vitro genetic drift of cell lines, because the genomic features of the same cell lines were remarkably similar among the different studies.33 This difference is more likely to be the result of epistasis with different growth conditions or differences in cell culture practice. The same is true for the relationship between cell line models and in vivo tumor models. Considering discrepancies in the growth conditions of cancer cell lines and original tumors, identifying the sources of the epistatic relationships between vulnerabilities and the TME is important. Thus, optimizing in vitro culture conditions may be necessary to minimize potential false positives and false negatives. Nevertheless, it is almost impossible to completely mimic the physiological tumor setting on plastic. Therefore, discoveries made with cancer cell lines in vitro almost always require further validation in appropriate in vivo models. Traditionally, xenograft models of cancer cell lines in immune-compromised mice were the most popular option; however, accumulating PDX models with genomic annotations may be a better fit for this purpose, as these models maintain an intact TME.
Predictive biomarker(s) for a therapeutic regimen may indicate the context in which sensitivity to an anti-cancer drug will occur; identification of these markers is often complicated by the lack of adequate variables. Therefore, the presence of more orthogonal dimensions of novel features provides an increased opportunity for capturing a more robust predictive model. In this respect, current advances in metabolomic and proteomic quantitative profiling technologies, such as mass spectrophotometry, have great potential. In addition, emerging functional genomic technologies, such as the CRISPR-Cas system, will also provide additional advances in the field by uncovering qualitative genetic vulnerabilities in a more stringent fashion than can be achieved with conventional RNAi-based hypomorphic screens.
CONCLUSION
Cancer cell lines have become a powerful tool for basic cancer research and anti-cancer drug development. Now empowered by various genomic tools, these cell lines offer utility as a platform for the discovery of precision cancer medicine and for drug repositioning. An increasing number of studies employing this cancer cell line panel provide unprecedented opportunities for data-driven discoveries of novel anti-cancer therapeutic strategies. These strategies integrate multi-dimensional data sets of genetic/molecular profiles, drug responses, and molecular dependencies generated by different research laboratories. To efficiently implement this strategy, we need to overcome challenges associated with differences in experimental design and assay platforms. Development of community-wide, consensus-based guidelines for good standard of practice for using cancer cell line panels should be considered. Further, a mechanism for central deposition of multi-dimensional genomics and various cell-based assay data sets should be established.
 XML Download