

 PDF
PDF ePub
ePub Citation
 Print
Print


INTRODUCTION
The purposes of health screening programs are to decrease mortality and incidence rates, as well as increase early detection and treatment rates, for target diseases.1 Screening is thus considered to be a form of secondary prevention against disease.2 Nevertheless, while screening programs are commonly offered as part of preventive health services in many countries, participation rates play a significant role in increasing the benefits thereof.3
In Korea, a nationwide health screening program was initiated in 1980, targeting individuals with chronic diseases working for the government or in schools.2 In 1995, the Ministry of Health and Welfare initiated the General Health Screening Program (GHSP)2 to include local and corporate subscribers with National Health Insurance (NHI). In 2007, a new life cycle-based national health screening program was implemented to overcome the limitations of the GHSP.4 This program targeted participants aged 40 and 66 years to capture health transitions in their life cycle: middle age begins around the age of 40 years, at which time the incidence of chronic disease increases;5 old age begins around 66 years, at which time geriatric approaches to health promotion are needed.6 In contrast to the GHSP, the life cycle-based national health screening program provides follow-up consultation services after screening to modify participants' health behaviors.1 The National Health Insurance Corporation (NHIC) reported that 69.8% of the participants were satisfied with this program, and 65% felt that it was superior to the GHSP.7 Furthermore, the NHIC stated that participants who completed primary and secondary screening in 2009 and 2011, respectively, were more likely to change their lifestyles (41%) than were those who participated only in primary screening in 2009 (29%).8
Kasl and Cobb9,10 defined health behaviors as "any activity undertaken by a person who believes himself to be healthy for the purpose of preventing disease or detecting disease in an asymptomatic stage." To explain health behavior changes, social psychologists in the US introduced the health belief model in the 1950s to evaluate "the widespread failure of people to accept disease preventives or screening tests for the early detection of asymptomatic disease."9,11 Variables affecting health behavior, such as demographic, sociopsychological, and structural variables, were identified.12 In addition to these variables, several dimensions affecting health behavior changes were established; these included perceived susceptibility, severity, benefits, and barriers.12,13 Rosenstock13 stated that the levels of perceived susceptibility and severity influence an individual's actions, and perceived benefits help to determine preferred paths of action. Some form of stimulation is needed in the decision-making process: it may be internal, such as symptoms, or external, such as mass media communications, interpersonal interactions, or reminder postcards from health care providers.13 New detection of diseases via health screening programs could increase one's perceived susceptibility and severity, and newly diagnosed individuals who participate in a physician consultation program could gain perceived benefits of guided decisions on courses of action.
The effect of disease detection via health screening programs on health behavior changes is an important issue in health care. Regarding smoking behavior, Hsu, et al. discovered a positive effect on smoking behavior with cancer diagnosis.14,15 Also, Neutel, et al.16 reported that newly diagnosed hypertensive patients often quit smoking. Accordingly, the purpose of this study was to investigate the effect that detection of chronic disease via health screening programs has on health behaviors, particularly smoking.
MATERIALS AND METHODS
Subjects
The baseline age of the study subjects was 40 years in 2007 and 42 years in 2009. A total of 312480 individuals participated in the life cycle-based national health screening program in 2007, and 194238 of these participants completed follow-up screening in 2009. After excluding participants who did not participate in one of the screening sessions, as well as those for whom data for variables were missing and had unclear responses, the final study population was 153518 (77307 men and 76211 women).
The subjects were recruited from the NHIC; all were aged 40 years and were eligible for the life cycle-based national health screening program (e.g., covered by NHI or Medical aid) in 2007.2 The NHIC and public health centers campaigned (including by mail) to increase the participation rate among the target population. Qualified clinics, hospitals, and public health centers provided the screening service. Targeted individuals were allowed to select a screening center.
Variables
Independent variables were divided into two groups: demographic factors [health insurance type (local or corporate), socioeconomic status (average monthly income in quartiles, and Q4 is the highest income), and body mass index (BMI; <23, 23 to <25, and ≥25)] and health status [family history of cardiovascular (CV) and/or neurovascular (NV) disease (heart disease and stroke; yes/no); status of diabetes, hypertension, and hyperlipidemia (none, known, and newly diagnosed)]. "No disease" was defined as no history of disease and no disease in 2007. "Known disease" was defined as a history of disease and diagnosed with disease in 2007. "Newly diagnosed with disease" was defined as no history of disease and a new diagnosis.
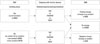
Changes in smoking behavior (positive, none, negative) was used to characterize the dependent variable (Fig. 1). "Positive change" was defined as smoking cessation (smoker in 2007, ex-smoker in 2009). "No change" was defined as no smoking behavior change between 2007 and 2009. "Negative change" was defined as smoking initiation (ex-smoker or non-smoker in 2007, smoker in 2009).
Statistical analysis
Multiple logistic regression analyses were conducted adjusting for health insurance type, socioeconomic status, BMI, diabetes, hypertension, hyperlipidemia, and family history of CV and/or NV disease. This study conducted multiple logistic regression analyses for two groups, current smoker group and ex-smoker or non-smoker group in 2007. We analyzed the current smoker group for smoking cessation and the ex-smoker or non-smoker group for smoking initiation. The analysis was stratified by sex due to differences in smoking characteristics between men and women.17 Statistical analyses were performed using SAS software (version 9.2; SAS Institute Inc., Cary, NC, USA).
RESULTS
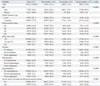
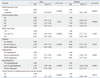
Table 1 shows the baseline characteristics of the study population. A total of 153518 individuals (77307 men and 76211 women; 94193 non-smokers, 20403 ex-smokers, 38922 current smokers) participated in screening in 2007. In 2007, 3466 individuals (1443 non-smokers, 611 ex-smokers, 1412 current smokers) were newly diagnosed with diabetes; 9823 (4388 non-smokers, 1944 ex-smokers, 3491 current smokers) were newly diagnosed with hypertension; and 22023 (8863 non-smokers, 4059 ex-smokers, 9101 current smokers) were newly diagnosed with hyperlipidemia.
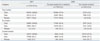
Changes in smoking behavior during the study period are described in Table 2. Most (97.6%) individuals who were non-smokers in 2007 remained ex-smokers or non-smokers in 2009; 2.4% were current smokers in 2009. Most (83.8%) individuals who were ex-smokers in 2007 retained this status, although 16.2% were current smokers in 2009. Similarly, most (87.0%) individuals who were current smokers in 2007 continued to smoke, although 13.0% were ex-smokers or non-smokers in 2009.
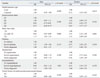
Table 3 and 4 show the results of the multiple logistic regression analyses of changes in smoking behavior. Table 3 lists the results of a positive change in smoking behavior among current smokers in 2007. The analysis revealed no significant relationship among women. In men, the risk of smoking cessation was 1.11 [95% confidence interval (CI), 1.03-1.20] times higher for men newly diagnosed with hyperlipidemia in 2007 than among those who had never had hyperlipidemia. Smoking cessation was 1.33 (95% CI, 1.05-1.68) times higher for men who had known diabetes in 2007 than among those who had never had diabetes. The risk of smoking cessation was 1.06 (95% CI, 0.95-1.19) times higher for men newly diagnosed with hypertension in 2007 than among those who had never had hypertension, although the result was not statistically significant. The risk of smoking cessation was 1.17 (95% CI, 1.01-1.35) times higher among men with BMI≥25, compared to men with BMI<23. Table 4 shows the results of a negative change in smoking behavior among ex-smokers or non-smokers in 2007. Among men, the risk of smoking initiation was 0.75 (95% CI, 0.64-0.88) times and 0.79 (95% CI, 0.73-0.85) times lower for those newly diagnosed with diabetes or hyperlipidemia in 2007 than among those who had never had diabetes or hyperlipidemia, respectively. The risk of smoking initiation was 1.55 (95% CI, 1.31-1.82) times higher for those with known hypertension in 2007 than among those who had never had hypertension. The risk of smoking initiation was 0.62 (95% CI, 0.55-0.69) times lower among men with BMI≥25, compared to men with BMI<23. There were no significant results in women.
DISCUSSION
In this study, to investigate the relationship between disease detection by screening programs and changes in smoking behavior, changes among women and men were analyzed with adjustment for health insurance type, socioeconomic status, BMI, diabetes, hypertension, hyperlipidemia, and family history of CV and/or NV disease.
In this study, the probability of smoking cessation among current smokers was higher among men with newly diagnosed hyperlipidemia and smoking initiation among ex-smoker or non-smoker was lower among men with newly diagnosed diabetes or hyperlipidemia, compared to those without disease, respectively. Meanwhile, studies have mentioned that hyperlipidemia patients are more likely to not know of their disease before being diagnosed by a doctor, compared to those with diabetes or hypertension.18,19 In the present study, the number of people who were newly diagnosed with hyperlipidemia was greater than those newly diagnosed with diabetes or hypertension. Among 153518 individuals, 22023 (14.4%) were newly diagnosed with hyperlipidemia, while only 3466 (2.3%) and 9823 (6.4%) were newly diagnosed with diabetes and hypertension, respectively. According to Omboni, et al.,19 awareness of the presence of CV risk factors among individuals newly diagnosed with hypertension, diabetes, or hyperlipidemia differs significantly: in their study, 44.5% of people diagnosed with hyperlipidemia, 22.7% with hypertension, and 3.5% with diabetes were not aware of their condition. Therefore, differences in a lack of awareness of existing disease may influence rates of change in smoking behaviors for individual conditions. Additionally, according to BMI, the risk of smoking initiation was lower and the risk of cessation was higher among men with a BMI≥25, compared to those with BMI<23, similar to results reported by Lee, et al.;20 in their study, among individuals who successfully quit smoking, 72.4% had a BMI≥23.
In 2010, smoking rates among men and women in Korea were 48.3% and 6.3%, respectively.21 According to the Organization for Economic Co-operation and Development (OECD), the average smoking rates among men and women were 27.5% and 17.5%, respectively, in 2011.22 According to the OECD Factbook 2011-2012: Economic, Environmental and Social Statistics, the difference in smoking rates between men and women was larger in Korea than in other OECD country.22 The sex-based difference in smoking behavior for Korea is related to many variables, including gender roles, social norms,17 and other cultural and economic factors.23 For instance, marriage status affects this difference in Asian, but not European, countries.1,17 In addition, cigarette use is acceptable under cultural norms for men in social and business settings.24 However, in women, smoking is considered to be against cultural norms.24 Previously, according to a transtheoretical model, Audrain, et al.25 noted gender differences in smoking behavior changes: gender differences were discovered for several stages of smoking behavior change, such as ready to quit smoking, perceived benefits and cost of smoking, and self-efficacy. For these reasons, our analysis of changes in smoking behavior was stratified by sex.
This study has several limitations. A lot of data were missing from responses, which may have impacted the statistical power of the analysis. In addition, the multiple logistic regression analysis did not allow for the determination of causal relationships. Furthermore, we had no information about the number of cigarettes smoked, smoking duration, or experiences with smoking cessation attempts. Despite these limitations, this study is the first to focus on behavioral changes induced by the life cycle-based national health screening program in Korea. Future studies should be conducted using advanced statistical methods and data obtained with high response rates, as well as adjustment for additional smoking-related variables.
In conclusion, smoking behavior changes after participation in a health screening program were detected only in Korean men. In particular, among men newly diagnosed with hyperlipidemia, current smokers were more likely to stop smoking, while non-smokers or ex-smokers were less likely to start smoking.
 XML Download