

 PDF
PDF ePub
ePub Citation
 Print
Print


INTRODUCTION
Behçet disease is a chronic and recurrent multisystem inflammatory disorder of unknown etiology. Although its exact pathogenesis remains unclear, the underlying pathology is an obliterative vasculitis that affects both the arteries and veins in all organs.1 Ocular involvement, which can include anterior uveitis, vitritis, retinal vasculitis, optic neuropathy, and scleritis, occurs in approximately 70% of Behçet's cases, and the visual prognosis for a patient with posterior segment inflammation is generally considered to be poor.2 Among many ocular manifestations, retinal vasculitis has been reported to be one of the most common ocular findings and suggested to be significantly correlated with visual prognosis in many studies.3,4,5 As chronic and recurrent inflammation of retinal vessels is of major concern in Behçet retinal vasculitis due to the cumulative damage it causes to retinal structures,6 the identification of specific angiographic findings of such pathology and their association with visual acuity (VA) bear clinical significance.
Fluorescein angiography (FA) is essential in assessing the activity and extent of the inflammation and monitoring the response to treatment in Behçet retinal vasculitis. FA allows for the recognition of retinal vascular inflammation based on fluorescein dye leakage from compromised retinal vessels as the breakdown of the inner blood retinal barrier occurs.7
Previous studies have explored the clinical features of Behçet uveitis in general.5,8 Although a few reports have described the fluorescein and indocyanine green angiographic findings in ocular Behçet's disease,9,10,11 the correlations between various FA findings and VA were not taken into consideration in these studies. Further, the impact of vascular leakage severity and its changes on VA have not been previously explored.
In this retrospective study, we intend to identify clinically significant FA findings that are associated with VA and assess the correlations between changes of FA findings and VA in Behçet retinal vasculitis.
MATERIALS AND METHODS
Patient selection
A retrospective review was performed of the medical records of 68 consecutive patients with active retinal vasculitis associated with Behçet disease who had been examined between January 2007 and March 2011 at the Behçet Uveitis Clinic at the Yonsei University Medical Center. The study was approved by the Institutional Review Boards at the Yonsei University Medical Center (IRB approval number: 4-2011-0829) and was performed in accordance with the tenets of the Declaration of Helsinki and all federal laws. Inclusion of patients were based on the following criteria. First, patients that satisfied the diagnostic criteria of the International Study Group for Behçet disease12 were identified. Then, their FA were retrospectively evaluated for signs of retinal vasculitis such as vascular sheathing or leakage and staining of the retinal capillaries or large vessels in FA. Only patients who presented with their first episode of active retinal vascular inflammation were included in the study.
The exclusion criteria were as follows: concurrent active infection, a history of tuberculosis, sarcoidosis, end-stage vasculitis with no light perception, a previous history of ocular inflammation, presence of any other disease, such as diabetic retinopathy and age-related macular degeneration, that could contribute to vascular leakage, inability to visualize the fundus due to a severe media opacity such as a dense cataract or a vitreous opacity, posterior synechiae, cataract or retinal surgery during the follow-up period, and macular pathologies, such as epiretinal membrane, macular holes, and optic nerve atrophy. In total, 86 eyes of 48 patients (27 males and 21 females; 10 patients with unilateral involvement; mean age: 35.63±10.18 years) were finally enrolled in the study.
Data collection
The demographic and clinical data gathered were age at the time of diagnosis, gender, laterality, HLA-B51 status, duration of follow up, best corrected Snellen visual acuity (BCVA) at initial presentation, at 2 years within +/- six months and at the last follow up. For BCVA at 2 years, the visit closest to the 2 year time point within a 3 months window was counted as the visit to be used. All patients were examined by the same uveitis specialist (SCL). Ophthalmic examinations included a slit lamp examination, a dilated fundus examination, and measurement of the intraocular pressure. Further, the Standardization of Uveitis Nomenclature (SUN) Group grading scheme was used for the assessment of the degree of inflammation in the anterior chamber and the vitreous.13 Patients underwent FA and optical coherence tomography (OCT) for the evaluation of retinal vasculitis and macular edema. FA findings at initial presentation and at 2 years within +/- three months were graded according to the FA classification described below.
For a change in VA to be considered as an improvement, there had to be an improvement of at least three Snellen chart lines between the initial VA and VA at 2 year time point within a 3 months window, whereas a drop of at least three Snellen chart lines was considered a worsening of VA. A change in VA of fewer than three lines was regarded as no change.
Imaging
Fluorescein angiography
Images were obtained with a confocal scanning laser ophthalmoscope (HRA 2; Heidelberg Engineering, Heidelberg, Germany). The images were selected from multiple early-phase and late-phase FA images, and analyzed by experienced, independent retinal specialists (MK and SCL).
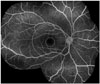
We devised a grading system for retinal vasculitis by slightly modifying a grading criteria previously used in several studies.14,15,16 All classifications were based on the late phase of angiograms. The macular and posterior pole regions were delineated through the use of an image overlay with measuring capability that was built into the HRA system. To define a macular region of interest, an overlayed circle with a diameter of 1.5 mm was centered on the fovea in an FA image. To define the posterior pole, an overlayed circle with a diameter of 5.5 to 6.0 mm that approximated both the superior and inferior temporal vascular arcades was used (Fig. 1).
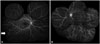
Eyes with retinal vasculitis were classified based on the anatomical location of the retinal vascular leakage. Those that exhibited leakage within the posterior pole were classified as having posterior pole-involved vasculitis, and those that only showed angiographic leakage in the periphery were defined as having peripheral vasculitis. The extent of the vascular leakage was classified as either focal-type in cases where there was a specific focus of dye leakage and/or if a well-defined focal area of leakage could be localized to within one quadrant, or diffuse-type if there was widespread leakage and/or a large area of multifocal leakage that involved more than one quadrant and did not have a specific focus of dye leakage (Fig. 2).
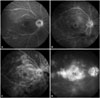
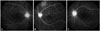
After classification based on the anatomical location of the leakage, those with posterior pole leakage were further evaluated to determine whether the macula was involved. Macular leakage was graded based on FA findings according to criteria previously proposed by Yannuzzi16 in which grade 0 equals no perifoveal hyperfluorescence, grade 1 indicates incomplete perifoveal hyperfluorescence, grade 2 indicates mild 360° hyperfluorescence, grade 3 indicates moderate 360° hyperfluorescence with the hyperfluorescent area being approximately 1 disc diameter across, and grade 4 indicates severe 360° hyperfluorescence with the hyperfluorescent area being approximately 1.5 disc diameters across (Fig. 3).
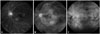
For the grading of the severity of the retinal vascular leakage in the late angiographic phases, a grading system similar to that used previously by others was adopted.14,15 Leakage was classified as mild for staining of vessels with minimal leakage, moderate for more intense leakage with a distinct vascular margin, and severe for even greater leakage with blurring of the large vessel margins (Fig. 4). In vasculitis involving the posterior pole, grading was performed with regard to only the retinal vessels outside the macular area to avoid the inclusion of the small vessel leakage associated with macular leakage in this grade.
Optic disc hyperfluorescence in the late angiographic phases was also graded using a system similar to that used previously by others.14,15 Hyperfluorescence was categorized as none (normal exiting of fluorescein and normal staining of the scleral rim), partial (partial staining of the optic disc), diffuse (diffuse leakage without blurring of the disc margin), and diffuse with blurring of the disc margin (Fig. 5).
For the evaluation of the change in vascular leakage during follow up, the magnitudes of retinal vascular leakage, optic disc hyperfluorescence, and macular leakage were compared collectively between the initial FA and FA at 2 year time point (within +/- three months) in which the visit closest to the 2 year time point within a three month window was counted as the visit to be used. Then, they were categorized into three patterns. A change in the magnitude of the overall vascular leakage was considered an improvement or worsening of the leakage, depending on the direction of the change, whereas, the eye was considered to have had no change in vascular leakage, if there was no discernible difference in the degree of leakage. FA analysis was performed by two independent observers (MK and SCL) who were blind to the other's reading and the relevant clinical characteristics of the patients (such as VA and slit lamp findings). Any disagreement on the FA findings was resolved by open adjudication.
Statistical analysis
The VA, demographics, and angiographic findings at initial presentation were analyzed with the Pearson chi-square test (Fisher's exact test was used when the expected cell counts were less than five) or independent Student's t-test (or Mann-Whitney U test). Mantel-Haenszel chi-square analysis was done to assess any trends in the level of retinal vascular leakage and optic disc hyperfluorescence in peripheral and posterior pole-involved vasculitis. The Cohen's kappa coefficient was calculated to evaluate intergrader and intragrader reliability by measuring chance-adjusted agreement for angiographic grading.
In vasculitis involving the posterior pole, multivariable linear regression analysis was performed with initial VA as the dependent variable and the angiographic features as independent variables after adjusting for potential confounders. A compound symmetry covariance structure was used to account for potential correlations between the two eyes of an individual. Kendall's tau beta coefficient was calculated for the correlation analysis of the relationship between the changes of VA and leakage during follow up at 2 year time point within a 3 months window.
p-values less than 0.05 were considered statistically significant SAS software version 9.2 (SAS Institute Inc., Cary, NC, USA) was used for the statistical analyses.
RESULTS
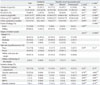
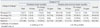
Retinal vasculitis was classified into two types based on the anatomic location involved. As shown in Table 1, retinal vasculitis involved the posterior pole in 63 eyes (73.3%), all of which also showed vascular leakage in the periphery. Isolated peripheral involvement (i.e., no vascular leakage in the posterior pole) was found in 23 eyes (26.7%). The mean logarithm of the minimum angle of resolution (logMAR) VA for eyes with vasculitis involving the posterior pole was significantly worse than that of those with peripheral vasculitis (p<0.0001). These two groups did not differ in the presence of cataracts, the magnitude of anterior uveitis, and posterior vitreous inflammation (all p>0.05, data not shown). Regarding the extent of vascular leakage, a diffuse-type of retinal vascular leakage was found in 69 eyes (80.2%), whereas 17 eyes were classified as focal-type (19.8%). Retinal vascular leakage was accompanied by optic disc involvement in 71 eyes (82.6%, partial: 39.5%, diffuse: 33.7%, diffuse with blurring of disc margin: 9.3%). Subgroup analysis (based on anatomic location) revealed a significant trend towards a more severe and diffuse-type of vascular leakage in retinal vasculitis involving the posterior pole compared to peripheral vasculitis (Mantel-Haenszel chi-square test, all p<0.0001). In contrast, most of the eyes with peripheral vasculitis had only a mild degree of retinal vascular leakage (95.6%), with one eye displaying moderate retinal vascular leakage (4.4%). However, there was not a significant difference in optic disc hyperfluorescence between the two groups (p=0.108).
Eyes with posterior pole vasculitis were further subdivided into those that involved the macular region and those without any evidence of macular leakage (extramacular subtype). Comparison of these two subtypes showed a significant trend towards more severe retinal vascular leakage in those with macular involvement (p=0.012), but a significant difference was not found in optic disc hyperfluorescence (p=0.50). There was not a significant difference between macular and extramacular types in either initial or follow-up VA at the two year time point, but the initial and follow-up VA of eyes with peripheral vasculitis were significantly better than those of eyes with the extramacular subtype of posterior pole vasculitis (p=0.001 and p=0.005, respectively) (Table 1).
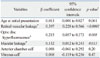
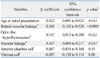
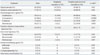
Univariable linear regression analysis identified retinal vascular leakage, optic disc hyperfluorescence, and macular leakage as factors significantly associated with worse VA in the eyes with retinal vasculitis involving the posterior pole (all p<0.05) (Table 2). Multivariable regression analysis with stepwise variable selection showed that these variables remained significantly associated with worse logMAR VA after adjusting for potential confounding variables (adjusted R2=0.41) (Table 3). However, in peripheral vasculitis, no significant association between angiographic findings and logMAR VA could be identified (all p>0.05, data not shown).
During the follow-up period (33.3±17.9 months), the 12 eyes that had vasculitis involving the posterior pole without any evidence of angiographic macular leakage (the extramacular subtype) all remained free of any macular involvement at the final follow up, and did not show a significant change in VA (Wilcoxon signed rank test, p>0.05). Only one eye (4.3%) with peripheral vasculitis eventually progressed to having vasculitis involving the posterior pole. This eye developed grade 2 macular leakage over 5 years, and the VA decreased from 20/30 to 20/50.
Inter-grader reliability for grading of angiographic findings of Behçet retinal vasculitis was very favorable (k: kappa value; extent of leakage, k=0.95; degree of retinal vascular leakage, k=0.96; optic disc hyperfluorescence, k=0.95; Macular leakage, k=0.91; change in leakage, k=0.93). Intra-grader reliability regarding these findings also was favorable (extent of leakage, k=1.00; degree of retinal vascular leakage, k=0.98; optic disc hyperfluorescence, k=0.98; macular leakage, k=0.95; change in leakage, k=0.97).
As shown in Table 4, in posterior pole-involved vasculitis, no significant correlation was found between the changes in vascular leakage and the change in VA evaluated at 2 year time point (correlation coefficient τ=0.199, p=0.092). Furthermore, we could not establish any significant correlation between the overall change in vascular leakage and the change in VA in eyes with peripheral vasculitis at 2 year time point (p=0.75).
With regard to treatments, a significantly higher percentage of the eyes with posterior pole vasculitis received systemic immunosuppressants (azathioprine, cyclosporin A, methotrexate) and intravitreal bevacizumab injections compared to those with peripheral vasculitis, but there was no significant difference in systemic corticosteroids administered between the two groups (Table 5).
DISCUSSION
Our study demonstrated that in Behçet retinal vasculitis, posterior pole involvement, the degree of retinal vascular leakage, optic disc hyperfluorescence, and macular leakage were significantly associated with worse VA. This suggests that the proposed angiographic classification of Behçet retinal vasculitis may be clinically valuable in terms of patients' visual prognosis.
Takeuchi, et al.5 suggested that a lesion located within the retinal vascular arcade in ocular Behçet disease is more likely to be associated with an irreversible visual disturbance caused by inflammatory cell-mediated damage to photoreceptors and ganglion cells in the macula. Optic disc hyperfluorescence has been previously suggested to be a marker of disease activity in posterior uveitis,17 and Gedik, et al.18 demonstrated optic disc staining and leakage in 89.8% of eyes, a finding similar to our finding of 82.6% of eyes. Previously, Nussenblatt, et al.19 reported no significant relationship between VA and the amount of fluorescein staining measured in the posterior pole. However, in our study, multivariable regression analysis indicated that the magnitude of macular leakage, retinal vascular leakage, and optic disc hyperfluorescence were significantly associated with VA. A higher prevalence of vascular anastomosis at the time of the initial FA suggests that an eye with posterior pole-involved retinal vascultis was more likely to have sustained cumulative ischemic damage due to vasoocclusive inflammation before the patient was first diagnosed with retinal vasculitis. These findings collectively suggest that at initial presentation, patients with angiographic evidence of retinal vasculitis with posterior pole involvement and greater degree of leakage may require prompt and aggressive treatment, because prolonged retinal vascular inflammation could result in a significant alteration of retinal function by promoting retinal edema, scarring, and optic nerve dysfunction.20
During follow up, vascular leakage persisted or worsened despite treatment with immunosuppressive agents in 61 eyes (70.9%), whereas 25 eyes (29.1%) showed an improvement in overall vascular leakage. In a subgroup analysis, no significant correlation was observed between vascular leakage change and VA change (τ=0.199, p=0.092) in eyes with posterior pole-involved retinal vasculitis. Retinal vascular inflammation causes the zonulae occludentes to open up and the retinal vessels to become leaky, resulting in fluorescein leakage through the open intercellular spaces of the endothelium and the staining of the vascular wall and the area surrounding the inflamed vessel.21 This implies that differentiation between progression to active vascular leakage and persistent vascular leakage resulting from chronic damage incurred on the endothelial blood retinal barrier might be difficult in chronic vasculitis such as Behçet retinal vasculitis. Further, mild leakage could persist after the cessation of active inflammation as a damaged blood vessel could remain leaky for a long time after the active inflammation had resolved.20 This may explain the lack of significant correlation between leakage change and VA change in our study. To differentiate chronic, inactive inflammation from acute exacerbation of active inflammation, additional means to evaluate the activity of inflammation might be necessary.
In this study, there were no cases that progressed from extramacular vasculitis to vasculitis that involved the macula, whereas there was one eye in which the vasculitis progressed from involving only the periphery to involving the posterior pole 5 years after the time of the initial FA. Considering the relatively short mean follow up of 33.3±17.9 months, it is unclear whether we might have observed more cases in which retinal vasculitis limited to the periphery could progress to involve the posterior pole, and whether the treatment or natural history is what prevented initially peripheral only cases from becoming posterior pole involved vasculitis since most of peripheral retinal vasculitis have also received various treatments.
There were 12 eyes with retinal vasculitis involving the posterior pole that did not have any angiographic evidence of macular leakage. Despite the absence of leakage in the macular area, the VA of these eyes was not significantly different from that of those with macular leakage, implying that vascular inflammation within the posterior pole area could have a significant impact on VA even in conditions in which there was no apparent involvement of the macular area in FA. Several possible mechanisms have been suggested for the VA decrease that occurs in retinal vasculitis, including antiretinal antibodies released from a damaged blood retinal barrier causing the apoptotic death of photoreceptors,22,23 macular ischemia secondary to occlusive vasculitis, persistent leakage of inflammatory mediators such as nitric oxide24 and free radicals25 from damaged blood vessels leading to the oxidative stress and apoptotic death of photoreceptors,26,27 interference of signal transduction within the inner nuclear layer, and macular thickening due to inflammation.
There are several limitations in the present study. We adopted and slightly modified previously used criteria.14,15,16 However, there is an inherent subjectivity in grading angiographic leakage. With regard to the evaluation of visual function, due to the retrospective nature of the study, we were able to evaluate only VA. Also, the use of the best or final VA outcomes does not accurately reflect the true extent and severity of this disease as the disease tends to wax and wane with frequent recurrences,28 and that is why the visit closest to the 2 year time point within a 3 months window was counted as the visit to be used for correlation between the change in vascular leakage and the change in VA. Further prospective studies involving more patients with diverse ethnic backgrounds are warranted in the future.
In conclusion, this study demonstrated that posterior pole involvement, the degree of retinal vascular leakage, optic disc hyperfluorescence, and macular leakage are significantly associated with worse VA in Behçet retinal vasculitis. This suggests that the proposed angiographic classification and grading of Behçet retinal vasculitis may be clinically significant in terms of patients' visual prognosis and physician's treatment strategy.
 XML Download