

 PDF
PDF ePub
ePub Citation
 Print
Print


INTRODUCTION
Annually, 36 million deaths (more than two-thirds of total deaths in the world) are caused by non-communicable chronic diseases (NCDs) including cardiovascular diseases (17.3 million deaths), cancers (7.6 million), chronic respiratory diseases (4.2 million), and diabetes (1.3 million).1 In high-income countries, the health care burden of NCDs remains high; however, the death rates of NCDs have been decreasing over the last few decades.2 For example, the age-adjusted mortality for coronary heart disease decreased by more than 50% between 1980 and 2000 in the U.S.3 The prevention and management of major risk factors contributed to a 44% reduction in coronary heart disease mortality, while treatments contributed 47% to the reduced mortality.4 Smoking cessation is the largest contributing factor to the reduced lung cancer mortality;5 however, the prevalence of smoking has substantially decreased in most high-income countries.2 In most low- and middle-income countries, NDCs are now the leading causes of death, and the burden of NCD is increasing rapidly in low-income populations.1 Annually, 80% of NCD deaths and 90% of premature NCD deaths (before the age of 60) occur in low- and middle-income countries.1 In Korea, cancer, cardiovascular diseases, chronic respiratory diseases and diabetes are the four main NCDs that are among the top 10 causes of death, and these NCDs account for more than 60% of all deaths in 2012.6 In Korea, unlike other high-income countries, the death rates of most NCDs have been increasing or plateauing over the past few decades.6 Moreover, the health care burden of NCDs is expected to steeply increase with a rapidly aging Korean population. Thus far, efforts to prevent NCDs have been mainly invested at the population level, such as through mass health screenings and campaigns for smoking cessation, reducing alcohol abuse, encouraging a healthy diet, and exercise. Although this kind of population-based approach has greatly improved NCD prevention, personalized medical care is also important to assess disease risk and preventive strategies at an individual level.
Epidemiological research contributed much to NCD prevention by identifying major risk factors and by evaluating the performance of screening, diagnosis, and treatment modalities. Traditional epidemiologic studies measure the impact of a risk factor on a certain disease by calculating relative risk and odds ratios.7 However, these measures of risk are difficult to apply at an individual level because an individual may have a disease without any exposure to risk factors or may be exposed to multiple risk factors at various exposure levels.7 Therefore, in the clinical decision-making process, absolute disease risk should be estimated for each individual.7 Disease risk prediction (or health risk appraisal) models have been developed to assess the impact of multiple risk factors together for the estimation of an individual's absolute disease risk.7 The development of risk prediction models is a very active area of research where epidemiologic findings are translated into clinical applications. If an individual's future risk for certain diseases can be predicted, then efficient and personalized treatment strategies can be chosen.
HOW TO DEVELOP CHRONIC DISEASE RISK PREDICTION MODELS
Identifying risk predictors
Chronic disease risk prediction models use multiple covariates to estimate the probability of having or developing a certain chronic disease within a specific time period.8,9,10 Reliable data must be secured to develop the risk prediction model so that potential risk factors (or predictors), disease outcomes, and their associations may also be evaluated. The most reliable data comes from prospective cohort studies since the risk factors and their contributions to the disease incidence can be evaluated. Data from retrospective cohort studies are also frequently used to develop risk prediction models.10 Retrospective cohort data can save time and decrease costs, but these data are documented usually for health screening or administrative purposes. Therefore, limited information on covariates and disease outcomes might affect the performance of the prediction model. Data from case-control studies are generally not reliable for prediction model development, but data from nested case-control or case-cohort designs within an established cohort can be successfully used.10 Moreover, suspected outcomes such as disease events or deaths should be ascertained using medical records and/or death certificates. Candidate risk predictors may include variables related to demographics, medical history, family history, physical examinations, and biomarkers. These variables should be measured by standardized methods, and the validity and reliability of the measurements should be evaluated regularly over the study period. Among the evaluated variables, potential risk predictors could be selected based on the literature and statistical investigation of the study dataset.
Developing candidate risk prediction models
Multiple linear regression, multiple logistic regression, and Cox's proportional hazard regression models are employed frequently to quantify the contribution of each covariate (predictor) on the development of a new event (the disease of interest). After potential risk predictors and disease outcomes are selected, the strength of the association (regression coefficients) between the covariates at baseline and the incident event is estimated using an appropriate statistical model. If risk factors were measured repeatedly during the follow-up period, the predictive performance may be improved by including updated values or considering time-trend of the risk factors. Moreover, competing risks of developing other diseases may also be considered, especially for models that predict long-term or lifetime disease risk.11,12 Once regression coefficients are calculated, they can be multiplied and rounded off as integers to simplify the model.
Evaluating the performance of the risk prediction model
To find the most effective risk prediction model, multiple candidate models that include a different combination of the selected risk factors should be evaluated in diverse aspects: global model fitness, discrimination, calibration, and reclassification.10,13 First, global model fitness is measured to find the best-fit model with the least number of covariates. Among the various measures of global model fitness, the Akaike Information Criterion and the Bayes Information Criterion are the two commonly used methods.13,14
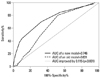
Second, discrimination refers to the ability to separates those with events from those without events. Receiver operating characteristics (ROC) curves are commonly used for evaluating discrimination performance.15,16 The ROC curve is a plot of sensitivity on the y-axis and 1-specificity on the x-axis for all possible cut-off values. The values of area under the ROC curve (AUC) and C-statistic should fall between 0.5 and 1.0 with a high score indicating a high power of discrimination (Fig. 1). AUC scores of 0.70 to 0.80 are considered an acceptable range of discriminative power, and a score of 0.80 or higher is considered to indicate excellent model discrimination.17
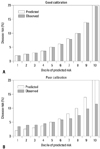
Third, calibration is a measure of how accurately the predicted probabilities of developing a disease match the subsequently observed event rate. The most common approach is comparing predicted and observed disease rates across disease different risk groups. The study population is then divided into multiple risk categories (often deciles) according to the predicted risk. Then, the predicted and observed event rates in each category are graphically compared. Fig. 2 shows an example of a good and poor calibration performance. Smaller differences between predicted and observed rates indicate better model calibration. The statistical significance of the difference between predicted and observed rates is often assessed by the Hosmer-Lemeshow's chi-square test.17 The Brier score, which is the sum of the squared difference between the observed outcome and fitted probability, is a measure of fit that considers both calibration and discrimination.14
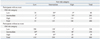
Fourth, reclassification tables are commonly used to compare a new model with an existing model to determine if adding a new predictor or replacing an existing model with a new one improves an individual's risk stratification. Additionally, reclassification tables are constructed separately for participants with and without events to calculate the net reclassification improvement (NRI), an index of improved risk stratification. These tables quantify the correct and incorrect movements of participants into specific categories after applying the new prediction model.18 Any participants with an event who moved upward (reclassified into higher risk categories) or without an event who moved downward (reclassified into lower risk categories) indicate that a correct reclassification has been made. On the contrary, any downward movement for participants with an event or upward movement for participants without an event implies that an incorrect reclassification was made. The NRI is calculated as the difference of the proportion of patients correctly classified minus that of those incorrectly classified (Table 1).18
The integrated discrimination improvement (IDI) index is another reclassification tool that calculates the new model's ability to improve integrated sensitivity without sacrificing integrated specificity.18
Moreover, bar graphs and scatter plots can be employed to depict the predictive performance of the developed model in diverse aspects.7 Fig. 3 is a simulated scatter plot comparing the performance of two prediction models. Vertical and horizontal axes indicate the risks predicted by an old model and a new model, respectively. The red dots are those with an event of interest, and the blue open circles are those without event. This plot visually displays how closely the two models predict disease risk for each individual. With adding lines indicating cut-off points for risk classification, the plot can show who are to be reclassified into a different category when we replace the old prediction model with a new one.7,13
Validating the risk prediction model
When a new risk prediction model is developed, it needs to be validated in a dataset independent of the dataset that has been used to develop the model. Validating and updating (if needed) the developed model are important because, without generalizability, the model may perform poorly in a real clinical setting. For validation, an internal or external dataset can be used. For internal validation, a study dataset is randomly divided into two subsets; one for developing and the other for validating the suggested model.19 Bootstrapping, which repeatedly tests the model in the different random subsets of the total dataset, is a preferred method for internal validation, especially when the study dataset is too small to be divided into development and validation subsets.20 However, validating a model in an external dataset is desirable because by testing the new model in a more generalized population, the reliability of its performance can also be tested.19 Additionally, testing for temporal validation (using data from a different time period), geographical validation (using data from another geographic area), and domain validation (using data collected in a different setting) also provide information on the generalizability of the model.9,20 As was true for the development of the model, global model fitness, discrimination, calibration, and/or reclassification analyses also need to be evaluated in the validation dataset.19
EXAMPLES OF CHRONIC DISEASE RISK PREDICTION MODELS
Cardiovascular disease risk prediction models
The Framingham Risk Score is the most well-known example of a health risk assessment model that assesses an individuals' cardiovascular disease (CVD) risk and suggests lifestyle changes and/or early pharmacologic treatment for individuals. The Framingham Heart Study started with 5209 Framingham residents between the ages of 30 and 62 in 1948. The major aim of the original cohort was to secure epidemiological data on arteriosclerotic and hypertensive CVD, and successfully followed up these participants.21 From 1960, major CVD risk factors including cigarette smoking, cholesterol level, blood pressure, physical inactivity, left ventricular hypertrophy, and glucose intolerance have been specified based on this cohort.21 The Framingham Heart Study was expanded to the Offspring Cohort in 1971, the Ommi cohort in 1994, the Third Generation Cohort in 2002, and the New Offspring Spouse Cohort and Second Generation Ommi Cohort in 2003 to reflect the diverse community in Framingham.21 After the 18 years of follow-up, a risk prediction model was developed to estimate the 8-year risk of various CVDs including coronary heart disease, brain infarction, intermittent claudication, and hypertensive heart failure.22 In this model, a multiple logistic regression model was applied to obtain regression coefficients of each risk factor, and a risk function score was developed with the coefficients of an efficient set of risk factors. Using this model, health care professionals identified persons at a high CVD risk who need preventive treatment.22 The Framingham Risk Score has been continuously developed and modified based on updated evidence. For example, Cox's proportional hazards regression analysis has been used to estimate an individuals' 10-year total CVD risk as well as a specific CVD risk (for atrial fibrillation, coronary heart disease, congestive heart failure, diabetes mellitus, hypertension, and intermittent claudication).21,23 Furthermore, a 30-year risk and lifetime risk of developing various CVDs have been suggested using advance statistical techniques to avoid bias in the assessment of true absolute risk.12
Even though the Framingham Heart Study results are fundamental evidence for the prediction of CVD risk, risk factors and the effect of risk factors on developing CVDs may differ by population. In fact, a study tested the Framingham Risk Score using the 2001 Korea National Health and Nutrition Examination Survey data, which is linked to the Korea National Health Insurance Corporation and is a representative population of non-institutionalized Koreans.24 They reported that the Framingham model overestimated the risk of ischemic heart disease (IHD) by 150% to 320%.24 Thus, even a well-established risk prediction model such as the Framingham Risk Score requires frequent recalibration or adjustment for use in other populations including the Korean population. More preferably, a CVD risk prediction model should be developed and validated using cohort data from the Korean population. One group of researchers in Korea has developed an IHD prediction model based on health screening and national health insurance data, which is a representative population of Koreans.25 Data are from biennial health screening tests between 1992 and 1995 of civil servants, school teachers, and their spouses insured by the National Health Insurance Corporation.25 For outcome variables, deaths from IHD between 1993 and 2002 were detected by linking the Cause of Death Statistics database from the Korea National Statistical Office, and hospital admissions for IHD between 1998 and 2002 were identified using the National Health Insurance Corporation claim database.25 Among a total of 931467 participants, a random sample of half of the population was used to develop an IHD prediction model incorporating risk predictors of age, total cholesterol, systolic blood pressure, smoking, and diabetes.25 After development, the model was validated in the other half of the population by dividing risk of IHD into percentiles of 10 for predicted risk.25 The C-statistic, which shows the discriminatory power of the model, was 0.75 for men and 0.80 in women.25 This is the first IHD risk prediction model that was developed based on Korean data, but several limitations exist. Although the three datasets employed to develop the model (data from health screenings, cause of death statistics, and insurance claims) were collected nationwide, they were not originally constructed for research purposes. Therefore, available risk predictors were limited and the measurements were not fully standardized. Moreover, the causes of death and hospitalization records were not centrally adjudicated. Last, the clinical usefulness of this model in Korea is limited because most of the assessed individuals will fall into low-risk categories; therefore, individual preventative strategies cannot be determined clinically.
Breast cancer prediction models
Another example of a health risk assessment model is the Breast Cancer Risk Assessment Tool (Gail model) that helps to identify high-risk individuals among screened women. As a part of the Breast Cancer Detection Demonstration Project, data from 2852 Caucasian women who were first diagnosed with breast cancer between 1973 and 1980 and 3146 controls were used to calculate the relative risk for each risk factor and estimate probabilities of developing breast cancer.26 In this model, variables related to a family history of breast cancer in a first-degree relative, a late age at first childbirth, early menarche, and multiple previous benign breast biopsies were included.26 Ten years later, this model was validated in 5969 Caucasian women who were followed up for 48.4 months and was found to provide useful information for women who plan to participate in regular mammographic screenings.27 Since its validation, it has been updated for atypical hyperplasia and to include African Americans and Asian Americans using the Contraceptive and Reproductive Experiences Study and the Asian American Breast Cancer Study, respectively.28 The current model calculates a woman's five-year and lifetime risk of developing breast cancer by accounting for age, age at menarche, age at the time of her first child's birth (or if they have never given birth), family history of breast cancer (mother, sister, or daughter), number of past breast biopsies, number of breast biopsies showing atypical hyperplasia, and race or ethnicity.28
Recently, a Korean breast cancer risk assessment tool was developed based on the modified Gail's equation.29 The study included 3789 sets of cases and controls from the Seoul Breast Cancer Study. In this population, the identified risk factors for women under the age of 50 were a family history of breast cancer in first-degree relatives, age at menarche, age at first full-term pregnancy, menopausal status, breastfeeding duration, oral contraceptive usage, and exercise. Breast cancer incidence and mortality was calculated from the Korean National Cancer Registry and the Cause of Death Statistics from the Korea National Statistical Office, respectively. Individual probabilities of developing breast cancer were projected by combining information on an individual's relative risk, baseline hazard rate, and competing risk. The developed model was validated in two separate Korean cohorts; the AUC values were 0.61 in the Korean Multicenter Cancer Cohort and 0.89 in the National Cancer Center Cohort. This breast cancer risk assessment tool used the modified Gail model; however, the original Gail model was developed for women who participated in annual mammographic screening program, therefore further adjustment in the Korean model is needed. Additionally, because the study participants were Korean women who visited three teaching hospitals in Seoul for either breast cancer treatment or a community health screening, they may not represent the total population of Korean women. Therefore, this modified Gail model should be further validated in a representative, epidemiological cohort of Korean women.
CLINICAL APPLICATION
The health care burden of NCDs has been rapidly increasing, but fortunately NCDs are preventable by managing risk factors.4,5 However, each individual is concomitantly exposed to multiple risk factors and at various exposure levels; therefore, tailored medical decisions are required to identify an individual's disease risk and to provide personalized care. Validated, reliable NCD prediction models assist healthcare professionals in the decision-making process by selecting candidates for intensive preventive interventions or additional tests.30,31 For individuals, knowing their predicted risk increases their awareness of their chronic disease and the importance of prevention, helps to communicate their risk levels with others and their physicians, and motivates lifestyle modifications or adherence to treatment.30
In the field of NCD prediction, developing an accurate and reliable prediction model is fundamental, yet other characteristics are required before the model can be deemed clinically useful. First, to use a NCD prediction model in broad range of populations with confidence, intensive model validation and continuous updates are required. Second, the model's ease of use is also important. Physicians and individuals should have easy access to the model and be able to easily calculate disease risk as well as interpret the results to encourage widespread use. Finally, the results of the prediction model should be linked to clinical practice. The Gail model is a good example of a clinically useful NCD prediction tool, and the modified Gail model has been extensively validated and updated worldwide. Both models are easily accessible to physicians and their patients to calculate breast cancer risk. For example, when a five-year breast cancer risk of 1.66 percent or higher is calculated by the modified Gail model, the patient is advised to begin preventive chemotherapy to reduce breast cancer risk. 32, Thus, the modified Gail model continues to be widely used in daily clinical practice.
The clinical utility of a disease prediction model can be population specific because the baseline disease risk, subtype distribution of the disease, and exposure levels to risk factors differ by region and ethnicity. Several chronic disease risk prediction models have been suggested for use in the Korean population,29,32,33,34,35,36 but have not been employed as frequently as expected. One reason for this could be that most of the prediction models have not been thoroughly validated in other independent datasets. Validation requires diverse community-based cohort studies to be used, but these kinds of data are not yet available in Korea. Although a considerable number of cohort studies have started over the last few decades in Korea, most lack a standardized process of outcome ascertainment and adjudication. Also, the more recent cohort studies are not suitable for use as a validation dataset because the follow-up period is short and only a small number of outcomes have been observed. Thus, it is currently not possible to validate a disease prediction model using various independent datasets in Korea. To maximize the clinical utility of disease prediction models, a wealth of epidemiological data from the Korean population is required. Furthermore, existing cohort studies should allocate more resources to improve the process of outcome ascertainment and adjudication. Ischemic heart disease, breast cancer, and colorectal cancer are among the most frequently predicted chronic diseases in Western countries; however these diseases are relatively uncommon in the Korean population. Although the incidence of these diseases is rapidly increasing in Korea, the currently measured incidences are still lower than that of Western populations. Therefore, a majority of individuals fall into the low-risk group when their disease risk is assessed with a prediction model. Even with a disease prediction model that is validated in a Korean population, high-risk individuals who merit aggressive preventive treatment are difficult to identify. Finally, clinical practice guidelines and recommendations are not widely accepted in Korea as a method for disease prevention.7 Assessing an individual's disease risk has only limited clinical value because the predicted disease risk has little influence on the clinical decision-making process for chronic disease prevention.
FUTURE OF CHRONIC DISEASE PREDICTION
A large number of disease prediction, risk assessment, and health risk appraisal tools have been developed and recommended for general clinical use. However, their prediction accuracy and clinical utility vary widely. Moreover, there is little evidence supporting the idea that existing chronic disease prediction tools can improve clinical outcomes. Chronic disease prediction models deemed relevant to the Korean population should be continuously developed, validated, updated, and modified using prospective epidemiologic data. Newly suggested prediction models should be assessed extensively for their predictive power and clinical utility, and independent datasets should be employed when possible. These approaches require diverse community-based cohort studies with adequate sample size, follow-up length, and outcome adjudication. In the meantime, substantial efforts are required to improve risk communication, motivate physicians and individuals to execute preventative strategies, and develop clinical decision-making algorithms.

 XML Download