

 PDF
PDF ePub
ePub Citation
 Print
Print


INTRODUCTION
The cardiopulmonary exercise test (CPET) is an important clinical tool used to determine the severity and prognosis of heart failure (HF). Among the various CPET parameters, peak oxygen uptake (peak VO2) and ventilatory response to exercise (VE/VCO2 slope), measured by the slope of the increase in ventilation with respect to CO2 output, have been demonstrated to have a prognostic significance as indices of exercise capacity and ventilatory efficiency.1,2,3
Red cell distribution width (RDW), a measure of size variability among red blood cells, has been found to be a prognostic marker in patients with HF and acute dyspnea.4,5,6,7,8 Although the mechanism for the association between increased RDW and poor prognosis in HF is not clearly elucidated, chronic inflammation, kidney dysfunction, hepatic congestion, and nutritional deficiencies in HF were suggested for the underlying mechanism for the increased RDW.9,10,11,12 Therefore, we hypothesized that a higher RDW, which represents an increased severity of and an adverse prognosis for HF, would be related to exercise intolerance or ventilatory inefficiency, the measurements reflecting the severity of HF, especially in patients with chronic HF (CHF). In contrast, for control subjects who have much less conditions for increased RDW, it might be less related to exercise intolerance or ventilatory inefficiency compared to those with CHF. Therefore, the present study evaluated the relationship between RDW and CPET parameters, especially peak VO2 and VE/VCO2 slope, in patients with CHF and in healthy controls.
MATERIALS AND METHODS
Subjects
We retrospectively identified 1038 patients who underwent CPET between August 2011 and June 2012. Among them, we consecutively enrolled 120 CHF patients all in stable clinical condition with regard to symptoms and therapy for at least 3 months and with a left ventricular ejection fraction (LVEF) ≤55%. Patients with known hematologic diseases, neoplastic metastases to bone marrow, pregnancy, severe arthritis, inflammatory bowel diseases, chronic obstructive pulmonary disease, transfusion, iron replacement therapy (which can increase plasma RDW levels), and other extracellular fluid increasing diseases (e.g. hypothyroidism and liver cirrhosis) were excluded. A total of 35 patients without laboratory test results within 3 months from the CPET examinations were excluded, and the final analysis included 85 CHF patients. Also, we analyzed 107 healthy controls that underwent CPET in the same periods. They did not have any cardiovascular risk factors such as hypertension, diabetes or dyslipidemia.
The institutional review board of Yonsei University College of Medicine approved the study protocol.
Laboratory and echocardiographic measurements
Blood samples were obtained after an 8-h overnight fast by venipuncture into plain and EDTA tubes. Patients had venous blood collected for the measurement of routine blood chemistry. Using the Advia 2120i automated analyzer (Siemens Healthcare Diagnostics, Deerfield, IL, USA), hematologic variables such as hemoglobin, hematocrit, mean corpuscular volume, and RDW were measured. The reference range for RDW in our laboratory was 11.5-14.5%. Renal function was determined by estimated glomerular filtration rate using the Modification of Diet in Renal Disease formula.13
Two-dimensional echocardiographic findings were obtained. LVEF was measured using the modified Quinones method.14 In patients who had regional wall motion abnormalities, LVEF was calculated by the biplane Simpson's method using apical four and two-chamber views.15 Left atrial volume index (LAVI) was measured using the prolate ellipsoid method.16 Pulsed-wave Doppler echocardiography of mitral inflow and tissue Doppler imaging from the apical four-chamber view with 2- to 5-mm sample volumes placed at the septal corner of the mitral annulus were used to determine the peak velocity of early diastolic filling (E), late filling (A), peak systolic velocity (S') and early diastolic velocity (E').17 Systolic pulmonary artery pressure was estimated from tricuspid regurgitation velocity by adding the right atrial pressure.
Cardiopulmonary exercise testing
A symptom-limited CPET was performed on a treadmill according to the modified Bruce ramp protocol. Patients were strongly encouraged to achieve a peak respiratory exchange ratio (RER) >1.10. Expired gases were collected continuously throughout exercise and analyzed for ventilator volume, oxygen (O2) content, and carbon dioxide (CO2) content using a calibrated metabolic cart (Quark CPET, COSMED, Chicago, IL, USA). Expired gases were reported every 15 s. During the exercise test, monitoring consisted of continuous 12-lead electrocardiography, manual blood pressure measurements every stage, and heart rate (HR) recordings every stage via the electrocardiogram. CPET was terminated according to following criteria; patient request, ventricular tachycardia, ≥2 mm of horizontal or down-sloping ST segment depression or a drop in systolic blood pressure ≥20 mm/Hg during exercise. A qualified exercise physiologist with physician supervision conducted each test.
The following variables were derived from the CPET results: peak oxygen consumption (peak VO2); peak RER, defined by the ratio of CO2 production to O2 consumption at peak effort; VE/VCO2 slope, defined as the slope of the increase in peak ventilation/increase in CO2 production through-out exercise. Peak RER had the highest 30-s averaged value during the last stage of the test. Heart rate reserve (HRR) was defined as the difference between basal and peak HR.
Statistical analysis
Continuous variables are expressed as mean±standard deviation and categorical variables as numbers and percentages. RDW values were treated as categorical variables in tertile groups because RDW was not normally distributed even after a log transformation. To compare baseline variables among RDW tertile groups, we used ANOVA for continuous variables and the chi-square test for categorical variables. Simple linear regression analysis was performed to assess the relationship between CPET parameters and other clinical, laboratory, and echocardiographic parameters. The independent predictors of peak VO2 and VE/VCO2 slope were assessed by a multiple linear regression, performed on the clinical and laboratory covariates identified in previous published studies as affecting to peak VO2 and VE/VCO2 slope.2,18,19 All analyses were performed for patients with CHF and for healthy controls.
To test the statistical significance of adding RDW to other clinical and laboratory parameters for prediction of outcomes, we compared a model with RDW (full model) with a model without RDW (reduced model) using R2, adjusted R2 and the root mean square error (RMSE). Finally, the predictive power of RDW for identifying patients with peak VO2 ≤20 mL/kg/min and VE/VCO2 slope ≥34 was quantified in terms of the area under the receiver operating characteristic (ROC) curve. Peak VO2 ≤20 mL/kg/min and VE/VCO2 slope ≥34 were one of the most commonly suggested dichotomous threshold values for poor prognosis in CHF.3,20
All analyses were conducted using SPSS Statistics (version 18.0.0, IBM Corp., Armonk, NY, USA). A p value of less than 0.05 was considered statistically significant.
RESULTS
Baseline characteristics
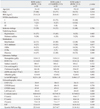
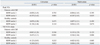
Baseline characteristics according to tertile subgroups of RDW are summarized in Table 1 for patients with CHF and in Table 2 for healthy controls. For patients with CHF, the highest tertile group tended to be older, leaner and had a more severe New York Heart Association functional classification. Regarding laboratory findings, the highest tertile group had significantly lower average albumin levels compared to the lowest tertile group. Also, the highest tertile group had lower hemoglobin and higher uric acid. With regard to echocardiographic indices, LVEF was not different among three groups. However, S' velocity was lower in the highest tertile group with a marginal significance. LAVI was significantly different among the three groups with the highest value in the highest tertile group. Also, A' velocity was lowest in the highest tertile group. E/E' was higher in the highest tertile group compared with the lowest tertile group. Lastly, estimated systolic pulmonary artery pressure was significantly elevated in the highest tertile group than the lowest tertile group (23.3±6.6 mm Hg vs. 24.7±4.7 mm Hg vs. 31.0±16.1 mm Hg, p=0.031).
In healthy controls, most subjects had RDW levels of the reference range (11.5-14.5%). However, eight subjects had higher RDW levels than the reference range. Age, hemoglobin, albumin levels, and E/E' were significantly different among three groups in the healthy controls (Table 2).
Cardiopulmonary exercise test data
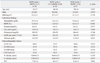
When we analyzed the patients with CHF, exercise duration was significantly shorter in the highest tertile group compared with the lowest tertile group (Table 3). The RDW level had a graded relationship with maximal workload, peak VO2 and VE/VCO2 slope. The highest tertile group had highest VE/VCO2 slope compared with the lowest tertile group. There were no differences in peak RER, baseline HR, peak HR, and HRR during exercise among the three groups (Table 3).
However, when we analyzed the healthy controls, exercise duration, maximal workload, and peak VO2 were not different according to the RDW tertile groups. Only VE/VCO2 slope, peak HR and HRR were significantly different according to the RDW tertile groups. Similar to the patients with CHF, the highest tertile group had highest VE/VCO2 slope compared with the lowest tertile group in healthy controls (Table 3).
Relationship between CPET parameters and clinical, laboratory, or echocardiographic parameters
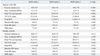
When data were analyzed using simple linear regression for patients with CHF, peak VO2 level was significantly correlated with age (β=-0.3, p=0.006), male gender (β=0.2, p=0.022), hemoglobin level (β=0.3, p=0.004), albumin level (β=0.3, p=0.002), LVEF (β=0.3, p=0.004), E/E' (β=-0.4, p<0.001) and RDW tertile groups (Table 4). With regard to ventilatory inefficiency for patients with CHF, VE/VCO2 slope was also significantly correlated with age (β=0.2, p=0.033), body mass index (BMI) (β=-0.3, p=0.007), hemoglobin level (β=-0.3, p=0.015), albumin level (β=-0.3, p=0.002), LVEF (β=-0.4, p=0.001), E/E' (β=0.4, p<0.001) and RDW tertile groups (Table 5).
However, notably in healthy controls, peak VO2 level and VE/VCO2 slope did not significantly correlated with RDW tertile groups (Table 4).
Independent predictors for peak VO2 and VE/VCO2 slope
Multiple linear regression analysis demonstrated an independent association between peak VO2 and RDW tertile groups (Table 4). BMI and E/E' were other independent predictors of peak VO2. Similarly, an independent association between VE/VCO2 slope and RDW tertile groups was observed (Table 4). Also, E/E' was another independent predictor of VE/VCO2 slope.
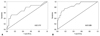
For prediction of both peak VO2 and VE/VCO2 slope, the R2 and adjusted R2 of the full model was greater than those of the reduced model and the RMSE of the full model was less than that of the reduced model (Table 5). ROC curve indicated a good power of RDW in identifying patients with peak VO2 ≤20 mL/kg/min and VE/VCO2 slope ≥34 [area under the curve 0.717, 95% confidence interval (CI)=0.556-0.878 for peak VO2 and AUC 0.858, 95% CI=0.747-0.970 for VE/VCO2 slope] (Fig. 1). The optimal cutoff value of RDW for predicting peak VO2 ≤20 mL/kg/min and VE/VCO2 slope ≥34 was 13.6% (sensitivity 53%, specificity 89%) and 13.4% (sensitivity 75%, specificity 82%), respectively.
DISCUSSION
The principal findings of this study are that 1) higher RDW is related to lower exercise capacity with lower peak VO2 and ventilatory inefficiency with higher VE/VCO2 slope in patients with CHF, 2) in contrast to patients with CHF, RDW is not related to exercise capacity or ventilatory inefficiency in healthy controls, and 3) RDW is an independent predictor of peak VO2 and VE/VCO2 slope when controlling for other confounding variables in patients with HF.
Among various prognostic markers for CHF, increased RDW has emerged as an additional predictor of poor outcomes, especially for patients with HF. It is known that RDW is typically high when red cell production is not effective, such as iron deficiency, vitamin B12 or folate deficiency.21,22,23 Although the reasons for higher RDW and poor prognosis in HF is not fully understood, some explanations have been suggested. Persistent inflammation has been known to predict progressive illness, cardiovascular mortality, and death in HF.9 Systemic inflammatory response could affect iron metabolism or bone marrow dysfunction. Pro-inflammatory cytokines have been found to inhibit erythropoietin-induced erythrocyte maturation and proliferation and down regulate erythropoietin receptor expression, which is associated with increases in RDW.10,11 Also, RDW may serve as an integrative measure of multiple processes simultaneously occurring in CHF, such as kidney dysfunction, hepatic congestion, and nutritional deficiencies.6,12 Therefore, increased RDW in CHF might be representative of chronic inflammation, and this can lead to poor prognosis in patients with CHF who have higher RDW.
Chronic inflammation plays a key role in HF pathophysiology, and it is known to be more pronounced in advanced disease stages.24,25 Also, Thierer, et al.18 reported that the functional capacity measured by the 6-min walk test was related to the degree of inflammatory activity and catabolism. The relationship between chronic inflammation and exercise capacity is well established not only in CHF but also in respiratory diseases such as chronic obstructive pulmonary disease and cystic fibrosis.26 Chronic inflammation results in anemia, muscle mass loss, and is associated with decreased lung volumes.18,27 Therefore, it is plausible that chronic inflammation may play an important pathophysiological role in exercise intolerance and ventilatory inefficiency in patients with CHF. In the present study, we demonstrate that increased RDW, which can represent chronic inflammation, is associated with exercise intolerance and ventilatory inefficiency in patients with CHF. Increased RDW can be a further indication of more severe HF and is associated with ventilatory inefficiency as well as exercise intolerance. Interestingly, when we analyzed the healthy controls, RDW was higher than patients with CHF. Furthermore, RDW did not have significant correlation with peak VO2 or VE/VCO2 slope. Thus, these data can further support our suggestion that increased RDW in the patients with CHF as a result of inflammation could be associated with exercise intolerance and ventilatory inefficiency.
Interestingly, despite the selection criteria of the healthy controls without any cardiovascular risk factors such as hypertension, diabetes or dyslipidemia, we found that the highest tertile groups in the healthy controls were older and had lower hemoglobin and albumin levels. Thus, the above mechanisms could be applied to the healthy controls as well.
Consistent with our findings, Van Craenenbroeck, et al.28 previously reported that higher RDW was negatively correlated with peak VO2 and positively correlated with VE/VCO2 slope. However, in contrast to our findings, higher RDW was an independent predictor of peak VO2 only and not independently related to VE/VCO2 slope. This discrepancy is likely attributable to the differing patients' characteristics enrolled in each study. The patients enrolled in our study were relatively younger and had less severe HF symptoms. Also, exercise capacities along with LV systolic and diastolic function were much better in this study compared to those in the previous report. RDW cutoff values, 13.6% and 13.4% for predicting peak VO2 ≤20 mL/kg/min and VE/VCO2 slope ≥34 in our study were also comparable with the previous study, the Candesartan in Heart Failure Assessment of Reduction in Mortality and morbidity program (CHARM).4 In the CHARM study, adverse events for death or hospitalization were increased with patients with RDW greater than 14.7%. Also, we previously reported that RDW for prediction of elevated LV filling pressure, E/E' >15, was greater than 13.5%.29
Moreover, these results confirmed our previous findings that reported a significant relationship between increased RDW and LV filling pressure, represented by increased E/E', although the previous study subjects were acute decompensated heart failure patients.29 Increased E/E' or increased systolic pulmonary artery pressure with higher RDW might be another explanation why CHF patients with higher RDW have exercise intolerance and ventilatory inefficiency. Our findings are consistent with previous studies that report LV diastolic dysfunction as being more likely to present a poorer CPET response (higher VE/VCO2 slope, lower peak VO2).19,30 Interestingly, in the present study, both peak VO2 and VE/VCO2 slope were significantly correlated with E/E' and LVEF, but only E/E' remained as an independent predictor for peak VO2 and VE/VCO2 slope. Thus, in line with these findings, hemodynamic stress to the heart in CHF also could be an important factor for exercise intolerance and ventilatory inefficiency.
Several potential limitations of the present study need consideration. First, due to the cross sectional design of this study we cannot define, but only suggest, a causal relationship between RDW levels and both exercise capacity and ventilatory inefficiency. Second, the present study included mostly younger patients with mild CHF. Extrapolations of this association to CHF of higher clinical severity should be made with caution. Third, assessment of inflammatory stress, by measuring other proinflammatory cytokines could have identified a possible link between inflammation, exercise intolerance, and high RDW. Unfortunately, these data were not available in our study. Fourth, there was a time interval between the laboratory test (RDW) and CPET, although we excluded patients whose interval was longer than 3 months.
In conclusion, higher RDW is independently related to exercise intolerance and ventilatory inefficiency in patients with CHF, but not in healthy controls. Based on our findings in measuring RDW, which is inexpensive and easily performed, it might help predict functional capacity and ventilatory efficiency in CHF patients. Further investigations are needed to determine whether increased RDW plays a pathophysiological role in exercise intolerance or ventilatory inefficiency in CHF patients.

 XML Download