

 PDF
PDF ePub
ePub Citation
 Print
Print


INTRODUCTION
Ovarian cancer (OC) is the second most common gynecologic cancer and the leading cause of death from gynecologic cancers in the United States.1 The high mortality rate from OC is attributed to the fact that more than 70% of OCs are diagnosed at an advanced stage of disease.2 Moreover, while there have been significant improvements in the morbidities and complications associated with surgical treatment and chemotherapy, the overall survival rate remains low.3 Despite disease-free intervals that may last for months to years after optimal debulking surgery and chemotherapy, recurrent OC is inevitable: theoretically, there should be no residual ovarian tissue after standard treatment, total hysterectomy with bilateral salpingo-oophorectomy. Therefore, recurrent OC following primary treatment should be considered a metastatic recurrence that involves other organs or tissues.
The main path of OC cell metastasis is the transcoelomic route, which leads to ascites-mediated intraperitoneal seeding of cancer cells.4,5 Although the mechanisms of metastatic recurrence are not clearly understood, changes in the tumor microenvironment at the cancer implantation site may play important roles in the transcoelomic seeding of OC.6 In particular, specific epigenetic alterations that lead to differential gene expression may affect the tumor microenvironment. These epigenetic alterations may serve as promising new targets for the treatment of advanced OC. Thus, understanding the pathophysiologic effects of epigenetic and genetic changes may help identify mechanisms that drive OC metastasis or recurrence.
To investigate epigenetic alterations involved in the metastasis and recurrence of ovarian cancer, we compared the gene expression and methylation profiles of the SK-OV-3 human ovarian cancer cell line with those of an SK-OV-3 intraperitoneal metastatic mouse model. Further, we selected promising genes and relevant methylation changes that were validated through subsequent functional studies for additional experimentation.
Carbonic anhydrase 9 (CA9) is a zinc-containing, membrane-associated glycoprotein and a marker of tumor hypoxia.7,8 CA9 is a critical regulator of pH homeostasis due to catalysis of the reversible reaction H2O+CO2↔H++HCO3-.9 Tumor cells in a hypoxic microenvironment during metastasis or propagation require CA9 overexpression to help maintain a normal intracellular pH.10,11
CA9 is located on chromosome 9p12-13 and comprises 11 exons, which encode 459 amino acids. CA9 is not expressed in most tissues, but increased expression has been reported in numerous cancers.12 In this study, we found that DNA methylation at CpG sites within the CA9 promoter region regulate CA9 expression. Furthermore, expression of the CA9 gene promoted an aggressive phenotype in ovarian cancer cells.
MATERIALS AND METHODS
Cell culture
The human ovarian cancer cell line SK-OV-3 was purchased from the American Type Culture Collection (ATCC no. HTB-77) and cultured in McCoy's 5A medium (Gibco/BRL, Rockville, MD, USA) containing 10% fetal bovine serum (Gibco/BRL), 100 U/mL penicillin (Gibco/BRL), and 100 µg/mL streptomycin (Gibco/BRL) in a 95% humidified air and 5% CO2 atmosphere at 37℃.
Ovarian cancer mouse xenograft model
All procedures for handling and euthanizing the animals in this study were performed in strict compliance with the guidelines of the Korean animal protection law and approved by the Institutional Animal Care and Use Committee of Ewha Womans University School of Medicine. SK-OV-3 cells (2×10⁶) suspended in culture media were intraperitoneally injected into 10 female nude mice (BALB/c, 4-6 weeks old). Four weeks after inoculation, the xenograft mice were sacrificed, and at least four implants adhering to the mesothelial surface of each mouse were harvested.
RNA preparation and quantitative reverse-transcription polymerase chain reaction (qRT-PCR)
Total RNA was extracted from the metastatic implants of ovarian cancer mouse xenografts and SK-OV-3 cells using the RNeasy mini kit (Qiagen, Valencia, CA, USA) according to the manufacturer's protocol. One microgram of total RNA was converted to cDNA using Superscript II reverse transcriptase (Invitrogen, Carlsbad, CA, USA) and oligo-(dT)12-18 primers (Invitrogen) according to the manufacturer's instructions. Quantitative reverse-transcription polymerase chain reaction was performed in a 20-µL reaction mixture containing 1 µL cDNA, 10 µL SYBR Premix EX Taq (Takara Bio, Otsu, Japan), 0.4 µL Rox reference dye (50x, Takara Bio), and 200 nM primers for each gene. The primer sequences were: CA9 (forward), 5'-TGACTCTCG GCTACAGCTGAACT-3'; CA9 (reverse), 5'-CCACTCC AGCAGGGAAGGA-3'; GAPDH (forward), 5'-AATC CCATCACCATCTTCCA-3'; and GAPDH (reverse), 5'-TGGACTCCACGACGTACTCA-3'. The reactions were run on a 7500 fast real-time PCR system (Applied BioSystems, Foster City, CA, USA) at 95℃ for 30 s, followed by 40 cycles of 95℃ for 3 s and 60℃ for 30 s, and a single dissociation cycle of 95℃ for 15 s, 60℃ for 60 s, and 95℃ for 15 s. All PCR reactions were performed in triplicate, and the specificity of the reaction was detected by melting-curve analysis at the dissociation stage. Comparative quantification of each target gene was performed based on cycle threshold (CT) normalized to GAPDH using the ΔΔCT method.
Messenger RNA microarray chip processing and analysis of gene expression data
Total RNA was extracted from the harvested metastatic-implants of ovarian cancer mouse xenografts and SK-OV-3 cells using the RNeasy mini kit (Qiagen), and one microgram of total RNA was amplified and labeled according to the Affymetrix GeneChip Whole Transcript Sense Target Labeling protocol. The resulting labeled cDNA was hybridized to Affymetrix Human Gene 1.0 ST arrays (Affymetrix, Santa Clara, CA, USA). The scanned raw expression values were background corrected, normalized, and summarized using the Robust Multiarray Averaging approach in the Bioconductor "affy" package (Affimetrix). The resulting log2-transformed data were used for further analyses.
To identify differentially expressed genes (DEGs), we applied moderated t-statistics based on an empirical Bayesian approach.13 Significantly up-regulated and down-regulated DEGs were defined as genes with at least a two-fold difference in expression level between the xenograft cells and the wild-type SK-OV-3 cells after correction for multiple testing (Benjamini-Hochberg false-discovery rate-adjusted p-value <0.05).14 Finally, we excluded genes with a low expression level (maximum log2 expression level in a total of eight samples <7.0) from the list of DEGs. The Database for Annotation, Visualization and Integrated Discovery (DAVID) bioinformatics resource was used to detect overrepresented the gene ontology (GO) clusters from the identified DEGs.15
Genomic DNA isolation and CpG methylation microarray
Genomic DNA was extracted from the cell line and tumor tissues using QIAmp mini kit (Qiagen), according to the manufacturer's instructions. For analysis of genome-wide screening of DNA methylation, the Illumina HumanMethylation450 BeadChip (Illumina, San Diego, CA, USA) targeted 450000 specific CpG sites. DNA methylation values were described as β-values, which are calculated by subtracting background using negative controls on the array and taking the ratio of the methylated signal intensity against the sum of both methylated and unmethylated signals. β-values range from 0 (completely unmethylated) to 1 (fully methylated) on a continuous scale for each CpG site. To identify differentially methylated CpG sites, we applied the difference in mean β-value (Δβ; mean β-value in tumors-mean β-value in SK-OV-3). If the absolute difference in mean β-values (│Δβ│) >0.06 (0.06 means a standard deviation at identical CpG site), the sites were defined as differentially methylated CpG sites. We described hypermethylated CpG sites/gene if Δβ was greater than 0.06 and hypomethylated CpG sites/gene if Δβ was less than -0.06.
Bisulfite sequencing PCR (BSP)
Genomic DNA was extracted from the harvested metastatic-implants of ovarian cancer mouse xenografts and SK-OV-3 cells using the QIAmp DNA mini kit (Qiagen) according to the manufacturer's protocol. Bisulfite treatment of genomic DNA was performed using the EpiTect Bisulfite Kit (Qiagen) according to the manufacturer's instructions. For bisulfite sequencing of the target promoter region of CA9, bisulfite sequencing PCR (BSP) was carried out using conventional PCR in a 50 µL reaction mixture containing 10 ng bisulfite-modified genomic DNA, 1.5 mM MgCl2, 200 µM dNTP, 1 U Platinum Taq polymerase (Invitrogen), 1X Platinum Taq buffer, and 200 nM specific BSP forward and reverse primers for each gene. The BSP primers were designed using the MethPrimer software (http://www.urogene.org/methprimer). For CA9, the BSP product was 405 bp (position in the human GRCh37/hg19 assembly: ch9 35673651-35674055) and contained eight CpG sites. The BSP primer sequences were: (forward), 5'-GGT GGTGTTAGGGAGAGTTTGTATA-3'; and (reverse), 5'-CACCAAAAACAACAATAACAACAAC-3'. The reaction ran at 95℃ for 5 min, followed by 30 cycles of 95℃ for 30 s, 50-55℃ for 30 s, and 72℃ for 30 s, and a final elongation step at 72℃ for 5 min.
The BSP products were purified using the QIAquick Gel Extraction kit (Qiagen) according to the manufacturer's protocols and ligated into the yT&A cloning vector (Yeastern Biotech, Taipei, Taiwan). The ligation products were used to transform competent DH5α Escherichia coli cells (RBC Bioscience, Taipei, Taiwan) using standard procedures. Blue/white screening was used to select bacterial clones, and BSP product-positive clones were confirmed by colony PCR using the BSP primers to verify the insert size. Plasmid DNA was then extracted from 6 insert-positive clones per each sample using the QIAprep Spin Miniprep kit (Qiagen) and sequenced using M13 primer to analyze the methylation status at specific CpG sites.
Quantitative methylation-specific PCR (qMSP)
Quantitative methylation-specific PCR (qMSP) was carried out with bisulfite-modified genomic DNA as the template and specific primer sequences designed to detect the methylated and unmethylated forms of CA9. The following methylated/unmethylated-specific primers were used: (methylated forward), 5'-TTTTTTTTATTTAGTTTTCGTTTTTAATG TAC-3'; (unmethylated forward), 5'-TTTTTTTTATT TAGTTTTTGTTTTTAATGTAT-3'; and (reverse), 5'-CAC CAAAAACAACAATAACAACAAC-3'. For qMSP, 20 µL reaction mixture containing 2 µL (10-100 ng/µL) bisulfite-treated DNA, 10 µL SYBR Premix EX Taq (Takara Bio), 0.4 µL Rox reference dye (50x Takara Bio), and 200 nM each primer were reacted using a 7500 fast real-time PCR system (Applied Biosystems). The amplification reaction conditions were: 95℃ for 30 s, followed by 40 cycles of 95℃ for 3 s and 58℃ for 30 s. The PCR product was then reacted at 95℃ for 15 s, 60℃ for 1 min, and 95℃ for 15 s to examine the specificity. Methylation and nonmethylation of the specific CpG sites were calculated as follows (Ct represents the threshold cycle):
The treatment of 5-aza-2'-deoxycytidine (5-aza-dC)
To demethylate methylated CpG sites, SK-OV-3 cells were treated with increasing concentrations (0, 5, and 10 µM) of 5-aza-2'-deoxycytidine (Sigma-Aldrich, St. Louis, MO, USA) for 3 days. The media was replaced daily.
Transient transfection
To establish a transient expression system, SK-OV-3 cells were transfected with pCMV6-XL5-CA9 (Origene, Rockville, MD, USA) or pEGFP-N3 (Clontech, Mountain View, CA, USA) plasmid DNAs using Lipofectamine™ 2000 (Invitrogen). Briefly, the cells were plated at a density of 6×10⁵ cells/well in six-well plates and allowed to grow overnight. Two micrograms of each plasmid DNA and 5 µL of Lipofectamine™ 2000 were diluted separately in Opti-Mem medium to a total volume of 250 µL. The diluted plasmid DNAs and Lipofectamine™ 2000 were mixed and incubated at room temperature for 20 min to generate the transfection mixtures. The cells were washed with serum-free McCoy's 5A medium, and then, the transfection mixtures were added to each well of the six-well plates containing complete growth medium and incubated at 37℃ for 24 h in a 5% CO2 incubator.
Transwell migration and in vitro invasion assay
After 24 h of transfection, the transfected cells were starved by serum deprivation. The cell migration assay was performed in 24-well Transwell plates containing inserts with a polycarbonate membrane with an 8.0 µm pore size (Corning, New York, USA). After 24 h of serum deprivation, the cells were detached from the plates and resuspended in serum-free medium at a density of 2×10⁶ cells/mL. One hundred microliters of the SK-OV-3 cell suspension was added to the upper compartment of the transwell chamber. For each experiment, both chemotactic migration to medium containing 15% fetal bovine serum (FBS) and random migration in serum-free medium were assessed in parallel Transwell plates for 6 h at 37℃ in a 5% CO2 incubator.
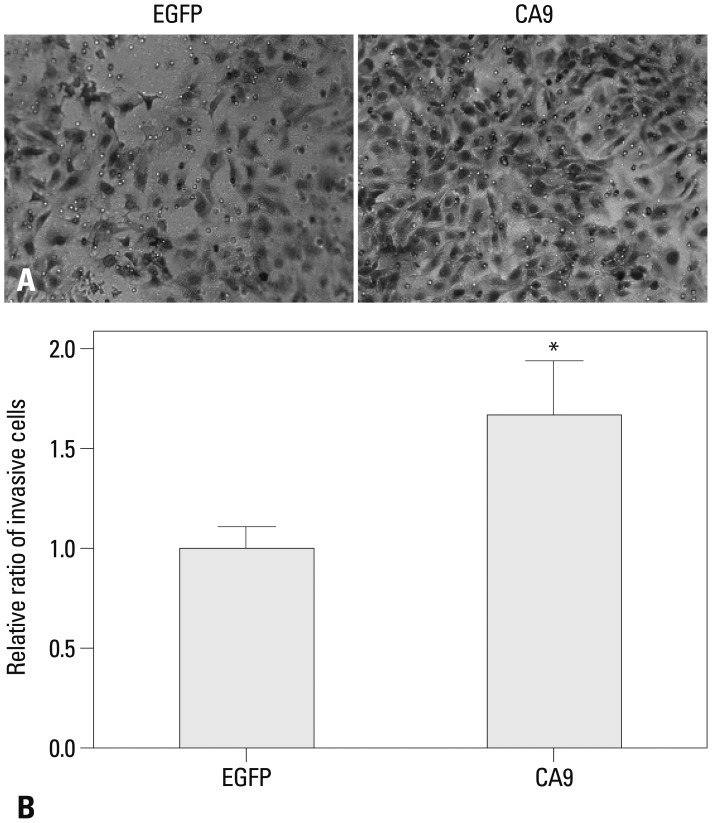
The in vitro invasion assay was performed using a BD BioCoat Matrigel Invasion Chamber (Becton-Dickinson, Franklin Lakes, NJ, USA). After 24 h of serum deprivation, SK-OV-3 cells were detached from the plates and resuspended in serum-free medium at a density of 1×10⁶ cells/mL. One hundred microliters of the SK-OV-3 cell suspension was added to the upper compartment of the invasion chamber, and 500 µL McCoy's 5A medium containing 10% FBS was added to the lower compartment of the chamber. The migration through the Matrigel chamber was allowed to proceed at 37℃ for 24 h in a 5% CO2 incubator. After the incubation period, the cells that had not migrated from the upper side of the filter were carefully scraped away with cotton swabs. The cells on the lower side of the filter were fixed for 2 min using Diff-Quick kit solution (Thermo Fisher Scientific, Waltham, MA, USA), stained with 1% crystal violet for 2 min, and washed twice with distilled water at room temperature. The images of the stained cells on the lower side of the membrane were acquired at 200× magnification in six different fields. For quantitative analysis, the stained cells were subsequently extracted with 10% acetic acid, and colorimetric measurement was performed at 590 nm.
RESULTS
Up-regulation of CA9 in metastatic tissues from SK-OV-3 cell implants in mice
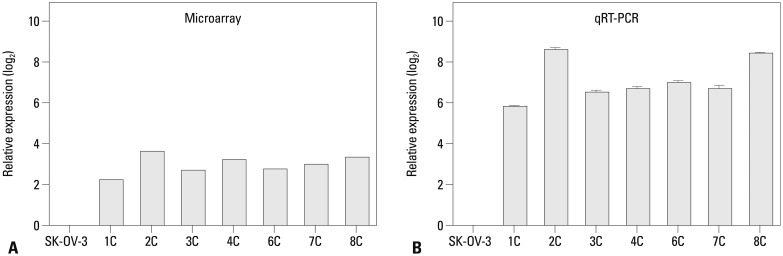
We implanted SK-OV-3 human ovarian cancer cells into the peritoneum of female nude mice to mimic human ovarian cancer metastasis. We performed mRNA expression microarray analysis on eight metastatic implants from seven different mice. Differentially expressed genes were identified by comparing these gene expression profiles to that of in vitro SK-OV-3 cell cultures (Fig. 1A). CA9 mRNA expression was higher in tumor tissues compared to that of cultured SK-OV-3 cells. We confirmed overexpression of CA9 by quantitative RT-PCR, which showed significantly higher expression in all of the tumor tissues that we tested (Fig. 1B).
DNA methylation was decreased at CpG sites in the CA9 promoter in metastatic tumor implants
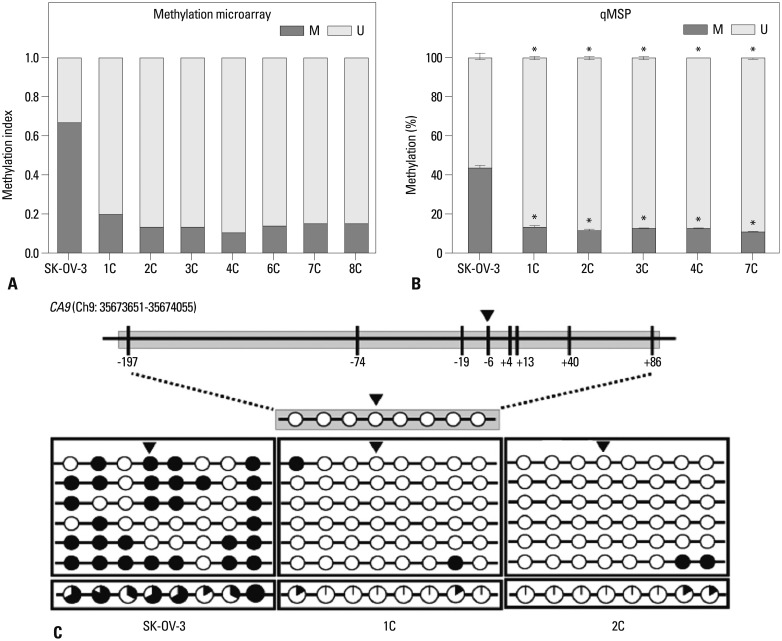
We performed global DNA methylation profiling of the eight metastatic tumor implants to examine the mechanism by which CA9 gene expression was regulated during ovarian cancer metastasis. DNA methylation of the CpG site at position-6 from the CA9 transcription start site was markedly decreased by more than three-fold (Fig. 2A). We confirmed this hypo-methylation by methylation-specific PCR (Fig. 2B). We examined DNA methylation of the CA9 promoter in two representative tumor tissues (1C and 2C) and in the wild-type SK-OV-3 cell line. We performed bisulfite sequencing analysis of the CA9 promoter region on chromosome 9 from 35673651-35674055, which contained eight CpG sites. Eight CpGs located at positions -197, -74, -19, -6, +4, +13, +40, and +86 from the transcription start site were hypo-methylated in metastatic tumor implants. In contrast, all eight sites were heavily methylated in wild-type SK-OV-3 cells (Fig. 2C), indicating that DNA methylation at these CpG sites regulates CA9 gene expression.
CA9 gene expression was modulated by pharmacological DNA methylation
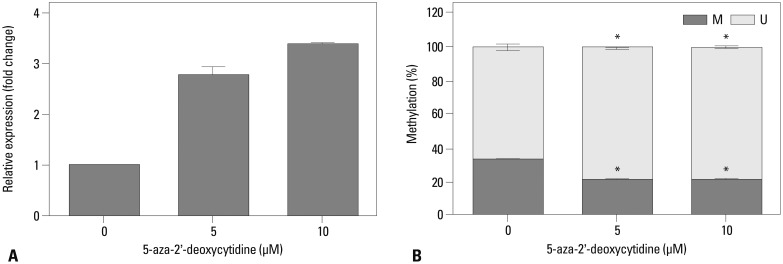
We assessed the epigenetic regulatory mechanism that controlled CA9 gene expression. Wild-type SK-OV-3 cells were treated with the DNA methyltransferase inhibitor 5-aza-2'-deoxycytidine to reduce CA9 promoter methylation. CA9 expression was significantly increased in the 5-aza-2'-deoxycytidine-treated cells (Fig. 3A) compared to that of Dimethyl sulfoxide (DMSO) vehicle-treated cells. We validated the methylation status in treated cells by methylation-specific PCR. We used a primer set specific for the CpG at position -6, which was the same site used in the microarray and bisulfite sequencing analysis (Fig. 3B). Methylation of the CpG at position -6 was significantly decreased in the 5-aza-2'-deoxycytidine-treated cells in accordance with up-regulated expression of CA9.
CA9 overexpression increased migratory and invasive activities in SK-OV-3 cells
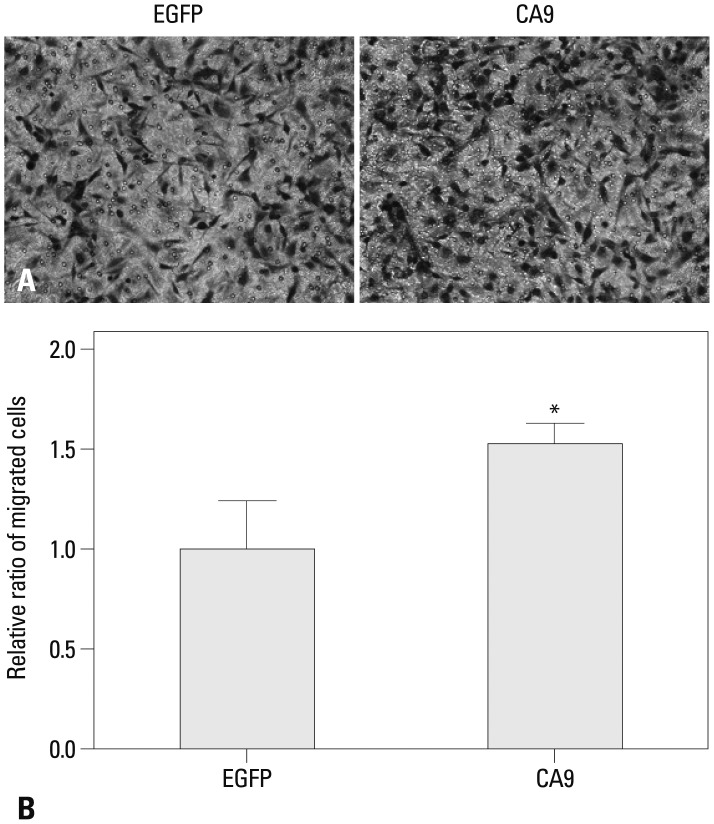
We investigated whether CA9 was crucial to the aggressive phenotype of SK-OV-3 cells. We found that overexpression of CA9 increased SK-OV-3 cell migration in a transwell assay by 50% (Fig. 4). Moreover, we observed that CA9 overexpression significantly increased invasiveness through a Matrigel-coated membrane (Fig. 5). These results suggested that epigenetic up-regulation of CA9 conferred migratory and invasive properties to tumor cells.
DISCUSSION
As solid malignancies progress, hypoxia is usually caused by an imbalance between the supply and demand of oxygen due to vascular insufficiency and increased oxygen consumption by rapidly proliferating tumor cells.16 To respond to the hypoxic tumor microenvironment, cancer cells switch to the glycolytic pathway and produce a large amount of lactic and carbonic acids through anaerobic metabolism. This leads to the acidification of the extracellular tumor environment. There is a selective advantage for tumor cells that can survive this stressful microenvironment by inducing expression of acid-regulating proteins, such as carbonic anhydrases.17
The CA family of zinc metalloenzymes is involved in the maintenance of cellular pH homeostasis through the reversible hydration of carbon dioxide to bicarbonate and protons.18 Among 16 isoenzymes, CA9 is the only transmembrane CA with an extracellular catalytic domain site adjacent to a proteoglycan-like domain.19 In addition, CA9 is the most active CA for carbon dioxide hydration.20
The expression of CA9 is sparse in normal tissues. In contrast, aberrant overexpression of CA9 in many types of solid cancers, including ovarian cancer, is associated with tumor progression, metastasis, invasion, poor prognosis, and chemotherapy resistance.21,22,23 Consistent with previous publications, CA9 mRNA expression was highly up-regulated in metastatic tissues from xenografts compared to that of wild-type SK-OV-3 cells. Migration and invasion are essential steps for metastasis. High expression of CA9 can promote cell motility and invasion by reducing E-cadherin-mediated cell adhesion through interaction with β-catenin.24 Our results also demonstrated that exogenous expression of CA9 significantly increases the migration and invasion of SK-OV-3 cells. Accordingly we discerned that overexpression of CA9 in metastatic cells from our xenografts contributed to the acquisition of metastatic potential.
CA9 is a hypoxia-inducible gene. Expression of CA9 is tightly regulated by the transcription factor hypoxia-inducible factor-1α, which binds to the hypoxia-responsive element in the CA9 promoter region.25 In addition to the transcriptional regulation of CA9, epigenetic regulation of CA9 by hypomethylation at -74 in the promoter region has been demonstrated in renal and gastric cancers.26,27,28 Methylation at -74 is a crucial determinant of CA9 expression, rather than the hypoxic-dependent pathway, in gastric cancer cells. Methylation of the CA9 promoter differs among histologic types of gastric cancers, with hypomethylation in intestinal-type and hypermethylation in diffuse-type of gastric cancer.28 DNA methylation-dependent epigenetic regulation of CA9 has not previously been investigated in ovarian cancer. Our bisulfite PCR sequencing analysis of the CA9 promoter region revealed that all eight CpG sites were hypo-methylated in metastatic tumor implants, compared to that of wild-type SK-OV-3 cells. Treating wild-type SK-OV-3 cells with the demethylating agent 5-aza-dC caused dose-dependent enhancement of CA9 expression. These results suggested that transcriptional regulation of CA9 expression is controlled by promoter methylation.
 XML Download