Abstract
Purpose
Materials and Methods
Results
Conclusion
Figures and Tables
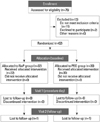
 | Fig. 1Consolidated Standards of Reporting Trials (CONSORT) flow chart detailing the conduct of the study. Visit 1 (the day of colonoscopy and post-preparation); Visit 2 (1 week follow-up after colonoscopy). NaP, sodium phosphate; PEG, polyethylene glycol. |
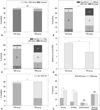
 | Fig. 2Comparison of bowel cleansing efficacy between the NaP tablet group and the PEG solution group. (A) Sub-analysis of Ottawa scale score (cleansing of each colon segment, 5-point scale; total amount of remnant fluids in the entire colon, 3-point scale). (B) Percentage of patients with adequate level of bowel preparation. Adequate level of bowel preparation was defined as a total Ottawa score of ≤4. *p<0.05. NaP, sodium phosphate; PEG, polyethylene glycol; NS, not significant. |
 | Fig. 3Comparison of patient-related outcomes between the NaP group and the PEG group. (A) Patient compliance. i) Complete: intake of the whole solution or tablets; ii) Good: intake of at least 75% of the solution or tablets; iii) Poor: intake of <75% of the solution or tablets. (B) Patient acceptance of the assigned bowel cleansing agent (what was the overall impression how difficult it was it to take the study regimen?). (C) Taste, (D) Satisfaction, (E) Preference (patients who would repeat the preparation in future). (F) Adverse events in both groups. *p<0.05. NaP, sodium phosphate; PEG, polyethylene glycol; NS, not significant; VAS, visual analogue scale. |
 | Fig. 4Comparison of laboratory tests results between two groups during the study period. (A) Inorganic phosphorus. (B) Total calcium. (C) Potassium. *p<0.05 by the paired t-test; †p<0.05 by independent t-test. NaP, sodium phosphate; PEG, polyethylene glycol; TCa, total calcium; K, potassium; IP, inorganic phosphorus. |
Table 1

NaP, sodium phosphate; PEG, polyethylene glycol; N, number; BMI, body mass index; PC, previous colonoscopy.
All data are expressed as mean±standard deviation or number (percentage), as appropriate.
*p-value was calculated using the independent t-test.
†p-value was calculated using the chi-square test.
‡p-value was calculated using the Fisher-Freeman-Halton extension of Fisher's probability test.
Table 2

NaP, sodium phosphate; PEG, polyethylene glycol; N, number; OBPQS, Ottawa Bowel Preparation Quality Scale; CIR, cecal intubation rate; CIT, cecal intubation time; TIIR, terminal ileal intubation rate; TIIT, terminal ileal intubation time; WT, withdrawal time; TPT, total procedure time; PDR, polyp detection rate; ADR, adenoma detection rate.
All data are expressed as mean±standard deviation or number (percentage), as appropriate. The OBPQS was calculated by adding 0 to 4 points for each colon segment and 0 to 2 points for total fluid quantity in the entire colon. The scale has a range from 0 to 14. Adequate level of bowel cleansing was defined as a total OBPQS score of ≤4.
*p-value was calculated using the independent t-test.
†p-value was calculated using the chi-square test.
‡p-value was calculated using the Fisher-Freeman-Halton extension of Fisher's probability test.
Table 3

NaP, sodium phosphate; PEG, polyethylene glycol; N, number; cm, centimeter; VAS, visual analogue scale.
All data are expressed as in mean±standard deviation or number (percentage), as appropriate.
*p-value was calculated using the independent t-test.
†p-value was calculated using the chi-square test.
‡p-value was calculated using the Fisher-Freeman-Halton extension of Fisher's probability test.
Table 4

NaP, sodium phosphate; PEG, polyethylene glycol; WBC, white blood cells count; Hb., hemoglobin, Hct., hematocrit; Plt., platelet; FPG, fasting plasma glucose; BUN, blood urea nitrogen; Cr., creatinine; eGFR, estimated glomerular filtration rate; Na, sodium; K, potassium; Cl, chloride; TCO2, total carbon dioxide; Ca, calcium; IP, inorganic phosphorus; Mg, magnesium; AST, aspartate transaminase; ALT, alanine transaminase; Alb., albumin.
All data are expressed as mean±standard deviation or number (percentage), as appropriate.
*p-value was calculated using the paired t-test.
†p-value was calculated using the Wilcoxon signed rank test. Laboratory tests were conducted three times in all of the participants: i) baseline (the day of enrollment and allocation); ii) visit 1 (the day of colonoscopy and post-preparation); iii) visit 2 (1 week follow-up after colonoscopy). eGFR was calculated using the Modification of Diet in Renal Disease (MDRD) study equation: eGFR (milliliter per minute per 1.73 m2)=186.3×(serum creatinine)-1.154×(age)-0.203 (×0.742 if the individual was female).
Table 5

NaP, sodium phosphate; PEG, polyethylene glycol; WBC, white blood cells count; Hb., hemoglobin; Hct., hematocrit; Plt., platelet; FPG, fasting plasma glucose; BUN, blood urea nitrogen; Cr., creatinine; eGFR, estimated glomerular filtration rate; Na, sodium; K, potassium; Cl, chloride; TCO2, total carbon dioxide; Ca, calcium; IP, inorganic phosphorus; Mg, magnesium; AST, aspartate transaminase; ALT, alanine transaminase; Alb., albumin.
All data are expressed as mean±standard deviation or number (percentage), as appropriate. Laboratory tests were conducted three times in all of the participants: i) baseline (the day of enrollment and allocation); ii) visit 1 (the day of colonoscopy and post-preparation); and iii) visit 2 (1 week follow-up after colonoscopy). eGFR was calculated using the Modification of Diet in Renal Disease (MDRD) study equation: eGFR (milliliter per minute per 1.73 m2)=186.3×(serum creatinine)-1.154×(age)-0.203 (×0.742 if the individual was female).
*p-value was calculated using the independent t-test.
†p-value was calculated using the Fisher-Freeman-Halton extension of Fisher's probability test.


 PDF
PDF ePub
ePub Citation
 Print
Print


 XML Download