

 PDF
PDF ePub
ePub Citation
 Print
Print


INTRODUCTION
Accurate assessment of the number, location, and volume of metastases is important for establishing a diagnosis and planning treatment strategies.1,2,3 Contrast-enhanced MR is the modality of choice for evaluating brain metastases. A higher dose of gadolinium (Gd) contrast material could provide higher diagnostic yield in the detection of brain metastases if contrast-related complications, such as nephrogenic systemic fibrosis, are minimized.4,5,6,7 Yuh, et al.6 reported double dose (DD) Gd-enhanced T1 weighted image (T1WI) has advantages over single dose Gd in detecting early and small brain metastases. They also reported triple dose Gd enhanced T1WI appeared to be more effective than delayed imaging with standard dose.4 Therefore, DD Gd enhanced T1WI is presumed to have at least a similar or higher level of diagnostic yield of detecting brain metastases over SD Gd.
Several previous studies proved that SD Gd-enhanced fluid-attenuated inversion recovery (FLAIR) is useful in the evaluation of superficial metastases and leptomeningeal metastases, because this sequence does not lead to contrast enhancement of vessels.8,9,10,11 However, the optimal dose of Gd to maximize the detection of metastases on Gd-enhanced FLAIR is undetermined, and unlike T1 weighted images, FLAIR with higher dose of Gd might not provide high diagnostic yield in the detection of brain metastases, because an increase in the T2 effect obscures the enhancing T1 effect.8,12 Several institutions use enhanced T1WI with DD Gd to evaluate brain metastasis. Therefore, the issue of whether enhanced FLAIR in the setting of DD Gd has a complementary role to T1WI is critical.
We hypothesize that small brain metastases might have higher signal intensities than large metastases in the setting of double dose of Gd injection, because small brain metastases might have less Gd contrast medium than large brain metastases. DD Gd-enhanced 3D FLAIR might be still effective for detecting small brain metastasis. Therefore, the purpose of our study was two-fold: first, we aimed to prove that the signal-to-noise ratio (SNR) of small brain metastases is higher than the SNR of large brain metastases on DD dose Gd enhanced 3D T2 FLAIR. Secondly, we aimed to explore the added value of DD Gd enhanced 3D T2 FLAIR in relation to 3D T1 GRE for detection of small brain metastases.
MATERIALS AND METHODS
Patient population
Approval by the Institutional Review Board was obtained and informed consent was waived for this retrospective study. Patients who had neurologic symptoms routinely underwent DD contrast-enhanced MR imaging at the outpatient oncology clinic of our institution to screen for cancer metastases in the brain; gadoterate meglumine was used as the contrast material. Between June 2012 and August 2012, 216 consecutive patients were imaged with MRI using the metastasis protocol of our institution. Of these, 67 patients were not found to have brain metastases and were excluded from the study. Diagnosis of brain metastasis was established by interpreting the initial and follow up DD Gd-enhanced 3D T1 GRE images. After examining the follow-up MRI scans, patients were confirmed as having metastatic brain tumors if their lesions increased in size with time or decreased in size following radiation therapy with or without chemotherapy. Lesions showing equivocal change in size on a follow-up MRI scan were regarded as probable metastases. Twenty-one cases that showed severe MRI artifacts were also excluded. A total of 128 cases were selected for quantitative and qualitative analysis in this study.
Subpopulation for quantitative analysis
Out 128 cases total, patients who had both small brain metastases (≤5 mm diameter) and larger metastases (>5 mm diameter) were included. Patients who had only one of small or larger metastases were excluded. Patients with tumors that were too small (less than 2 mm) to accurately measure were also excluded from the study. These criteria were satisfied by 25 patients (12 males, 13 females; age range: 41-78 years; mean: 58.4 years). The primary sites of metastasis were the lungs (n=12), breasts (n=7), kidneys (n=3), esophagus (n=1), colon (n=1), and gallbladder (n=1).
Subpopulation for qualitative analysis
Out of a total of 128 cases, patients who had small metastases were included regardless of the presence of large tumors; 72 (37 males, 35 females; age range: 37-79 years; mean: 58.6 years) were confirmed as having small brain metastases. Their primary tumor sites were the lung (n=51), breast (n=11), kidney (n=4), melanoma (n=2), esophagus (n=1), colon (n=1), gallbladder (n=1), and peripheral nerve (n=1). According to retrospective review of our protocol, MRI was scanned in the order of 3D T1 GRE and 3D T2 FLAIR (defined as delayed phase 3D T2 FLAIR) after Gd injection for 40 of the 72 patients and in the reverse order (defined as early phase 3D T2 FLAIR) for 32 of the 72.
MR imaging and contrast agent administration
All MR images were acquired using a 3T scanner (Achieva or Intera; Philips Medical Systems, Best, the Netherlands). An institutional MR imaging protocol for brain metastases (routine anatomic T1/T2 weighted images) was established. After administration of DD gadoteric acid (0.2 mmol/kg), 3D T1 GRE and 3D T2 FLAIR images were obtained. The parameters of 3D T1 3D GRE imaging were as follows: TR/TE, 9.8/4.5 ms; flip angle, 8°; bandwidth, 190.8 Hz/pixel; 224×224 matrix with 224 phase-encoding steps; 1 mm section thickness; and a 22-cm FOV. The parameters for 3D T2 FLAIR imaging were as follows: TR/TE, 8000/342 ms; TI 2400 ms using the same matrix size, phase encoding steps, section thickness and the same FOV as the 3D T1 GRE. Post-Gd 3D T1 GRE images were acquired 3 min after the Gd injection. Scanning time for 3D T1 GRE was 5 min 30 s. Right after 3D T1 GRE, the 3D T2 FLAIR image was acquired; its scanning time was 8 min 40 s. When MRI was scanned in the reverse order, the 3D T2 FLAIR image and 3D T1 GRE were acquired without pause after Gd injection.
Imaging analysis
Quantitative analysis
Quantitative analysis was performed by a board-certified neuroradiologist (A.S.J). Two pairs of metastases per patient (two small metastasis and two large metastasis) were selected in the quantitative analysis. We regarded the two largest metastases as representative lesions for large brain metastasis and regarded the two smallest metastases as representative lesions for small brain metastases to maximize the size difference. A total of 50 pairs of small brain and large brain metastases were analyzed. The representative lesions were to have shown homogeneous enhancement without hemorrhage, necrosis, and fibrosis. The largest possible circular region of interest was drawn in the enhancing portion of each brain lesion and frontal white matter on the post contrast 3D T2 FLAIR image.
SNR was measured for these lesions. The standard deviation (SD) of the signal intensity (SI) of the background could not be used as a measure of noise in the parallel imaging.13 Instead, we used homogenous tissue, such as frontal white matter close to the target lesion, to measure noise.14 We estimated the SNR as follows: SImetastasis/SDfrontalWM. We also defined contrast ratio (CR) of metastasis to normal parenchyma as the signal intensity of metastasis over that of frontal white matter. Wilcoxon signed rank tests were performed to evaluate the statistical significance of differences in SNR and CR between small and large metastases on post contrast 3D T2 FLAIR images.
Qualitative analysis
Two experienced neuroradiologists independently reviewed all the brain images. At the first session, they recorded small brain metastases using only DD Gd enhanced 3D T1 GRE. Intraclass correlation coefficient was measured between the two reviewers. Numbers of metastases for further analysis were determined by consensus between the two readers. At the second session after 2 weeks, they reviewed 3D FLAIR and 3D T1 GRE simultaneously and recorded the existence or non existence of small brain metastases. Intraobserver variability was analyzed. Numbers of metastases for further analysis were also determined by consensus between the two reviewers. Lesions detected only on 3D T2 FLAIR but not on 3D T1 GRE were counted as metastasis based on the following criteria: first, the location of lesions had to be superficial. Secondly, the morphology of lesions was nodular. Thirdly, signal intensity of the lesions was similar to that for the choroid plexus. Lesions that were located in the deep white matter or showed a signal intensity that was not as high as the choroid plexus of the lateral ventricle were regarded as a white matter lesion, such as leukoaraiosis.
The standard reference was initial and follow-up 3D T1 GRE. Diagnostic sensitivities of DD post 3D T1 GRE and combination of DD post 3D T1 GRE and 3D T2 FLAIR were compared using the McNemar test. Comparison of the number of metastases was analyzed using the Wilcoxon singed rank test. p-values <0.05 were considered statistically significant.
RESULTS
Quantitative image analysis
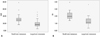
The SNRs and CRs of small brain metastases were significantly higher than those of large metastases (Fig. 1). The mean SNR±SD of small and large brain metastases were 32.82±13.03 and 19.38±11.73 for post contrast 3D T2 FLAIR (p<0.001) (Fig. 2). The mean CR±SD of small and large brain metastases were 2.14±0.57 and 1.29±0.63 (p<0.001).
Qualitative image analysis
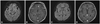
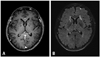
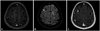
Four hundred and four small brain metastases were recorded after reviewing both initial and follow up 3D T1 GRE (242 for 3D T1 GRE taken in the early phase, 162 for 3D T1 GRE taken in the late phase). Out of the 242 metastases, 185 metastases (76.45%) were detected on the early phase 3D T1 GRE alone. Meanwhile, 242 metastases (100%) were detected on early phase 3D T1 GRE plus 3D T2 FLAIR, which was significantly more than those on early phase 3D T1 alone (p<0.001, Wilcoxon signed-rank test). The diagnostic sensitivities for small brain metastases were significantly higher for early 3D T1 GRE plus delayed 3D T2 FLAIR than early 3D T1 GRE alone (p<0.001, McNemar test) (Table 1). DD enhanced early phase 3D T1 GRE missed 57 metastases that were detected with early 3D T1 GRE and delayed 3D T2 FLAIR. Out of the 57 missed metastases, 52 metastases (92%) showed enhancement on early 3D T1 GRE, but were not detected by both reviewers (Fig. 3). Five metastases (8%) showed no enhancement on early 3D T1 GRE (Fig. 4).
Of the 404 metastases, 162 metastases were discovered when 3D T1 GRE was taken in the delayed phase. One hundred and forty six out of 162 metastases (90.57%) were detected on delayed 3D T1 GRE alone. Meanwhile, 162 metastases (100%) were detected on delayed 3D T1 GRE plus early 3D T2 FLAIR, which was significantly more than those on delayed 3D T1 GRE alone (p=0.003, Wilcoxon signed-rank test). The diagnostic sensitivities for small brain metastases were significantly higher for delayed 3D T1 GRE plus early 3D T2 FLAIR than delayed 3D T1 GRE alone (p<0.001, McNemar test) (Table 2). DD enhanced delayed 3D T1 GRE missed 16 metastases that were detected with delayed 3D T1 GRE and early 3D T2 FLAIR. Sixteen missed metastases showed enhancement on delayed phase 3D T1 GRE, but were not detected by both reviewers.
Intraclass correlation coefficients between both reviewers were excellent regardless of scan timing (0.873 for delayed T2 FLAIR, 0.941 for early T2 FLAIR).
DISCUSSION
Gd enhanced FLAIR imaging is a useful tool for detecting superficial parenchymal and meningeal lesions.8,9,15 However, unlike in T1WI scans, signal intensity on FLAIR images decreases as Gd concentration increases because of an increase in the T2 shortening effect. We set out to explore whether contrast enhanced FLAIR imaging has diagnostic value for brain metastases when a double dose of Gd contrast material is used.
According to our results, small brain metastatic lesions have a higher SNR than large brain metastases. The relatively lower signal intensity of large brain metastases on DD Gd-enhanced 3D T2 FLAIR might be explained by the increased concentration of Gd from altered tumor environments, such as progression of angiogenesis and increase in the amount of paramagnetic materials, such as microhemorrhage or extracranial primary tissue, suppressing the T1 shortening effect.16,17,18,19 Based on our quantitative results, we focused the qualitative analysis on small brain parenchymal metastasis (less than 5 mm in diameter). In addition, accurate detection of small brain lesions is extremely important clinically because small lesions respond much better to therapies and can be controlled at a substantially higher rate, compared to larger lesions.20,21 For small parenchymal metastases, the combined results of 3D T1 GRE and 3D T2 FLAIR showed a significantly higher sensitivity for the detection of metastasis than 3D T1 GRE alone regardless of scan timing (p<0.001). Mostly, reviewers could not detect the metastases although metastases showed enhancement on DD Gd enhanced 3D T1 GRE, because these lesions are difficult to differentiate from cortical veins or too small to detect on 3D T1 GRE alone. However, with the addition of DD Gd enhanced 3D T2 FLAIR, they were easily recognized. Some of the missed metastases (8% for delayed 3D T2 FLAIR, 14% for early 3D T2 FLAIR) showed no enhancement in the 3D T1 GRE, but they were prominent on 3D T2 FLAIR probably because DD Gd-enhanced 3D T2 FLAIR is more sensitive to a lower concentration Gd than DD-enhanced 3D T1 GRE. Although phantom analysis revealed a relationship between Gd concentration and signal intensity on FLAIR, the optimal dose of Gd to maximize signal intensity in vivo is unknown.10 Unfortunately, comparison between DD and SD Gd enhanced FLAIR has not yet been conducted. Considering the high sensitivity of FLAIR to lower concentrations of Gd, the benefit of DD Gd enhanced FLAIR is expected to be reduced in comparison with SD GD enhanced FLAIR. However, the concentration of Gd in the metastasis is dependent on size, vascularity, and MR acquisition time, as well as the dose of Gd. Our qualitative analysis suggests that DD Gd enhanced 3D T2 FLAIR images might complement DD Gd-enhanced 3D T1 GRE for evaluating small brain metastases by detecting lesions missed on 3D T1 GRE and improve diagnostic sensitivity.
The benefits of DD Gd enhanced-3D T2 FLAIR are similar with SD Gd enhanced 3D T2 FLAIR. First, 3D T2 FLAIR does not demonstrate enhancement in vessels, unlike 3D T1 GRE.22,23 Some small brain metastases may be missed on 3D T1 GRE images because metastases are frequently located near the corticomedullary junction, mimicking the enhanced vessels. However, FLAIR images exclude enhancement of vessels, and radiologists are able to easily identify abnormally enhanced parenchymal lesions. Second, phase shift artifacts of enhanced vessels, mimicking brain metastases, are reduced on FLAIR images. Third, peri-tumoral edema is better detected on FLAIR images. Peri-lesional massive edema surrounding the larger brain metastasis might interrupt detection of another lesion. On the other hand, peri-lesional minimal edema surrounding small lesions might make them appear larger and more conspicuous.
There are several limitations to our study. First, because we did not include precontrast 3D T2 FLAIR in our protocol, it is difficult to define true enhancing lesions on DD Gd-enhanced 3D T2 FLAIR. Therefore, enhancing lesions on FLAIR, which were not detected on T1 GRE, could be false positives. To reduce these errors, we carefully defined enhancing lesions on 3D FLAIR according to their location, morphology, and signal intensity, as stated in the materials and methods. However, enhancing lesions on 3D T2 FLAIR not detected on 3D T1 GRE should be carefully interpreted. Therefore, DD Gd enhanced 3D T2 FLAIR should be considered complementary to DD enhanced T1 GRE rather than replacing it in the detection of brain metastases. Second, the specificities of 3D T1 GRE alone and 3D T1 GRE plus 3D FLAIR images were not evaluated in this study. We regarded T2 hyperintense lesions, such as leukoaraiosis or slow flow on 3D T2 FLAIR, as true negatives. However, these lesions were too many to be counted. Practically, the specificity of 3D T1 GRE plus 3D T2 FLAIR could not be calculated. Third, nephrogenic systemic fibrosis is related to higher doses of gadolinium. In our institution, DD Gd contrast material is routinely used for metastasis. However, the stable Gd contrast agent, ionic cyclic form contrast medium, gadoterate meglumine is used for the DD metastasis protocol.24 Furthermore, patients are carefully selected to prevent nephrogenic systemic fibrosis; for patients with estimated eGFR less than 30 mL/min, the use of gadolinium is avoided.
In conclusion, small brain metastases were found to show higher signal intensity than large brain metastases on the DD Gd enhanced FLAIR images. DD Gd enhanced 3D T2 FLAIR imaging may have a complementary role to 3D T1 GRE for evaluating small brain metastases.


 XML Download