

 PDF
PDF ePub
ePub Citation
 Print
Print


INTRODUCTION
Ovarian cancer is the most lethal gynecological malignancy. The high mortality of this cancer can be explained by the fact that greater than 70% of ovarian cancer patients are first diagnosed at advanced stages1 due to the lack of reliable biomarkers for early detection and predominantly asymptomatic early-stage disease. Despite progress in surgical treatments and chemotherapy, the overall survival rate still remains low.2 Therefore, a better understanding of the molecular mechanisms that contribute to the aggressive behavior of ovarian cancer would be useful to identify new therapeutic targets and biomarkers for early detection and prediction of cancer treatment response.
Mucins are macromolecular glycoproteins produced by epithelial cells. Mucins are characterized by numerous tandem repeat-domains rich in proline and serine and/or threonine residues linked to a large number of O-glycans.3,4 Under normal physiological conditions, mucins function as a physical barrier that protects epithelial cells from pathogens, toxins, and harsh environments.3,4,5 Mucins are also involved in proliferation, differentiation, cell-cell adhesion, and immunosuppression of epithelial cells by transmitting external signals to epithelial cells in response to alterations in the local molecular environment.4,5 Alterations in expression and protein modifications, including glycosylation, of mucins have been implicated in tumorigenicity and metastasis of a variety of cancers, such as colon cancer,6 pancreatic cancer,7 breast cancer,8,9 and ovarian cancer.10,11,12 In particular, overexpression of various mucins (MUC1, MUC2, MUC3, MUC4, MUC 5AC, MUC13, and MUC16) has been reported in many epithelial ovarian cancers, compared with normal ovarian surface epithelium and benign ovarian tumors.4,13 Although it is necessary to improve its sensitivity and specificity, mucin 16 (MUC16), which encodes the CA125 antigen, is currently used as a serum marker to diagnose ovarian cancer.14,15 Other differentially expressed mucins, including MUC116 and MUC4,17 have also been suggested as potential biomarkers for early ovarian cancer detection and prognosis.
In the present study, we overexpressed MUC13 in human ovarian carcinoma peritoneal xenografts and explored the mechanisms regulating MUC13 expression. We report novel epigenetic regulation of MUC13 and examine its influence on aggressive phenotypes of ovarian cancer.
MATERIALS AND METHODS
Cell culture
The human ovarian cancer cell line SK-OV-3 was purchased from the American Type Culture Collection (ATCC no. HTB-77) and cultured in McCoy's 5A medium (Gibco/BRL, Rockville, MD, USA) containing 10% fetal bovine serum (Gibco/BRL), 100 U/mL penicillin (Gibco/BRL), and 100 µg/mL streptomycin (Gibco/BRL) in a 95% humidified air and 5% CO2 atmosphere at 37℃.
Ovarian cancer mouse xenograft model
All procedures for handling and euthanizing the animals in this study were performed in strict compliance with the guidelines of the Korean animal protection law and approved by the Institutional Animal Care and Use Committee of Ewha Womans University School of Medicine. SK-OV-3 cells (2×10⁶) suspended in culture media were intraperitoneally injected into 10 female nude mice (BALB/c, 4-6 weeks old). Four weeks after inoculation, the xenograft mice were sacrificed, and at least four implants adhering to the mesothelial surface of each mouse were harvested.
RNA preparation and quantitative reverse-transcription polymerase chain reaction (qRT-PCR)
Total RNA was extracted from the metastatic implants of ovarian cancer mouse xenografts and SK-OV-3 cells using the RNeasy mini kit (Qiagen, Valencia, CA, USA) according to the manufacturer's protocol. One microgram of total RNA was converted to cDNA using Superscript II reverse transcriptase (Invitrogen, Carlsbad, CA, USA) and oligo-(dT)12-18 primers (Invitrogen) according to the manufacturer's instructions. Quantitative reverse-transcription polymerase chain reaction (qRT-PCR) was performed in a 20-µL reaction mixture containing 1 µL cDNA, 10 µL SYBR Premix EX Taq (Takara Bio, Otsu, Japan), 0.4 µL Rox reference dye (50x, Takara Bio), and 200 nM primers for each gene. The primer sequences were: MUC13 (forward), 5'-AGAAACATTC CATGGCCTATCAA-3'; MUC13 (reverse), 5'-TGTCCA TAAACAGATGTGCCAAA-3'; GAPDH (forward), 5'-AAT CCCATCACCATCTTCCA-3'; and GAPDH (reverse), 5'-TGGACTCCACGACGTACTCA-3'. The reactions were run on a 7500 fast real-time PCR system (Applied BioSystems, Foster City, CA, USA) at 95℃ for 30 s, followed by 40 cycles of 95℃ for 3 s and 60℃ for 30 s, and a single dissociation cycle of 95℃ for 15 s, 60℃ for 60 s, and 95℃ for 15 s. All PCR reactions were performed in triplicate, and the specificity of the reaction was detected by melting-curve analysis at the dissociation stage. Comparative quantification of each target gene was performed based on cycle threshold (CT) normalized to GAPDH using the ΔΔCT method.
Messenger RNA microarray chip processing and analysis of gene expression data
Total RNA was extracted from the harvested metastatic-implants of ovarian cancer mouse xenografts and SK-OV-3 cells using the RNeasy mini kit (Qiagen), and one microgram of total RNA was amplified and labeled according to the Affymetrix GeneChip Whole Transcript Sense Target Labeling protocol. The resulting labeled cDNA was hybridized to Affymetrix Human Gene 1.0 ST arrays (Affymetrix, Santa Clara, CA, USA). The scanned raw expression values were background corrected, normalized, and summarized using the Robust Multiarray Averaging approach in the Bioconductor "affy" package (Affymetrix). The resulting log2-transformed data were used for further analyses.
To identify differentially expressed genes (DEGs), we applied moderated t-statistics based on an empirical Bayesian approach.18 Significantly up-regulated and down-regulated DEGs were defined as genes with at least a twofold difference in expression level between the xenograft cells and the wild-type SK-OV-3 cells after correction for multiple testing (Benjamini-Hochberg false-discovery rate-adjusted p-value <0.05).19 Finally, we excluded genes with a low expression level (maximum log2 expression level in a total of eight samples <7.0) from the list of DEGs. The Database for Annotation, Visualization and Integrated Discovery (DAVID) bioinformatics resource was used to detect overrepresented the gene ontology (GO) clusters from the identified DEGs.20
Bisulfite sequencing PCR (BSP)
Genomic DNA was extracted from the harvested metastatic-implant of ovarian cancer mouse xenografts and SK-OV-3 cells using the QIAmp DNA mini kit (Qiagen) according to the manufacturer's protocol. Bisulfite treatment of genomic DNA was performed using the EpiTect Bisulfite Kit (Qiagen) according to the manufacturer's instructions. For bisulfite sequencing of the target promoter region of MUC13, bisulfite sequencing PCR (BSP) was carried out using conventional PCR in a 50 µL reaction mixture containing 10 ng bisulfite-modified genomic DNA, 1.5 mM MgCl2, 200 µM dNTP, 1 U Platinum Taq polymerase (Invitrogen), 1X Platinum Taq buffer, and 200 nM specific BSP forward and reverse primers for each gene. The BSP primers were designed using the MethPrimer software (http://www.urogene.org/methprimer). For MUC13, the BSP product was 413 bp (position in the human GRCh37/hg19 assembly: ch3 124653578-124653990) and contained six CpG sites. The BSP primer sequences were: (forward), 5'-ATTTGAGGA GGAAATGATTTTTTTT-3'; and (reverse), 5'-CCTCT TCAAAAATTCTCAAAACTACA-3'. The reaction ran at 95℃ for 5 min, followed by 30 cycles of 95℃ for 30 s, 50-55℃ for 30 s, and 72℃ for 30 s, and a final elongation step at 72℃ for 5 min.
The BSP products were purified using the QIAquick Gel Extraction kit (Qiagen) according to the manufacturer's protocols and ligated into the yT&A cloning vector (Yeastern Biotech, Taipei, Taiwan). The ligation products were used to transform competent DH5α Escherichia coli cells (RBC Bioscience, Taipei, Taiwan) using standard procedures. Blue/white screening was used to select bacterial clones, and BSP product-positive clones were confirmed by colony PCR using the BSP primers to verify the insert size. Plasmid DNA was then extracted from at least 15 insert-positive clones using the QIAprep Spin Miniprep kit (Qiagen) and sequenced using M13 primer to analyze the methylation status at specific CpG sites.
Quantitative methylation-specific PCR (qMSP)
Quantitative methylation-specific PCR (qMSP) was carried out with bisulfite-modified genomic DNA as the template and specific primer sequences designed to detect the methylated and unmethylated forms of MUC13. The following methylated/unmethylated-specific primers were used: (methylated forward), 5'-GGGTATAAAGTTTAGTTATT AATTGAC-3'; (unmethylated forward), 5'-GGGTATAA AGTTTAGTTATTAATTGAT-3'; and (reverse), 5'-AAAA TCCTAACTTATTTTAAACTTTAAATC-3'. For qMSP, 20 µL reaction mixture containing 2 µL (10-100 ng/µL) bisulfite-treated DNA, 10 µL SYBR Premix EX Taq (Takara Bio), 0.4 µL Rox reference dye (50x Takara Bio), and 200 nM each primer were reacted using a 7500 fast real-time PCR system (Applied Biosystems). The amplification reaction conditions were: 95℃ for 30 s, followed by 40 cycles of 95℃ for 3 s and 58℃ for 30 s. The PCR product was then reacted at 95℃ for 15 s, 60℃ for 1 min, and 95℃ for 15 s to examine the specificity. Methylation and nonmethylation of the specific CpG sites were calculated as follows (Ct represents the threshold cycle):
Percent methylation=100/[1+2(ΔCtmeth-ΔCtnonmeth)]
The treatment of 5-aza-2'-deoxycytidine (5-aza-dC)
To demethylate methylated CpG sites, SK-OV-3 cells were treated with increasing concentrations (0, 5, and 10 µM) of 5-aza-2'-deoxycytidine (5-aza-dC) (Sigma-Aldrich, St. Louis, MO, USA) for 3 days. The media was replaced daily.
Transient transfection
To establish a transient expression system, SK-OV-3 cells were transfected with pCMV6-XL5-MUC13 (Origene, Rockville, MD, USA) or pEGFP-N3 (Clontech, Mountain View, CA, USA) plasmid DNAs using Lipofectamine™ 2000 (Invitrogen). Briefly, the cells were plated at a density of 6×10⁵ cells/well in six-well plates and allowed to grow overnight. Two micrograms of each plasmid DNA and 5 µL of Lipofectamine™ 2000 were diluted separately in Opti-Mem medium to a total volume of 250 µL. The diluted plasmid DNAs and Lipofectamine™ 2000 were mixed and incubated at room temperature for 20 min to generate the transfection mixtures. The cells were washed with serum-free McCoy's 5A medium, and then the transfection mixtures were added to each well of the six-well plates containing complete growth medium and incubated at 37℃ for 24 h in a 5% CO2 incubator.
Transwell migration and in vitro invasion assay
After 24 h of transfection, the transfected cells were starved by serum deprivation. The cell migration assay was performed in 24-well Transwell plates containing inserts with a polycarbonate membrane with an 8.0 µm pore size (Corning, New York, USA). After 24 h of serum deprivation, the cells were detached from the plates and resuspended in serum-free medium at a density of 2×10⁶ cells/mL. One hundred microliters of the SK-OV-3 cell suspension was added to the upper compartment of the transwell chamber. For each experiment, both chemotactic migration to medium containing 15% fetal bovine serum (FBS) and random migration in serum-free medium were assessed in parallel Transwell plates for 6 h at 37℃ in a 5% CO2 incubator.
The in vitro invasion assay was performed using a BD BioCoat Matrigel Invasion Chamber (Becton-Dickinson, Franklin Lakes, NJ, USA). After 24 h of serum deprivation, SK-OV-3 cells were detached from the plates and resuspended in serum-free medium at a density of 1×10⁶ cells/mL. One hundred microliters of the SK-OV-3 cell suspension was added to the upper compartment of the invasion chamber, and 500 µL McCoy's 5A medium containing 10% FBS was added to the lower compartment of the chamber. The migration through the Matrigel chamber was allowed to proceed at 37℃ for 24 h in a 5% CO2 incubator. After the incubation period, the cells that had not migrated from the upper side of the filter were carefully scraped away with cotton swabs. The cells on the lower side of the filter were fixed for 2 min using Diff-Quick kit solution (Thermo Fisher Scientific, Waltham, MA, USA), stained with 1% crystal violet for 2 min, and washed twice with distilled water at room temperature. The images of the stained cells on the lower side of the membrane were acquired at 200× magnification in six different fields. For quantitative analysis, the stained cells were subsequently extracted with 10% acetic acid, and colorimetric measurement was performed at 590 nm.
RESULTS
MUC13 expression is increased in the ovarian carcinoma xenografts
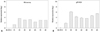
Ovarian carcinoma SK-OV-3 cells were injected into the peritoneal cavities of female nude mice. Four weeks after inoculation, dense solid tumors formed in the intestine, liver, and omentum were harvested from seven mice. We analyzed their expression profiles in comparison to wild-type SK-OV-3 cells using expression microarray. The microarray results revealed alterations of mRNA expression of more than two-fold in 937 genes, including 444 up-regulated genes and 529 down-regulated genes. Among the 444 up-regulated genes, MUC13 mRNA expression was highly over-expressed (2.3-11.2-fold) in the metastatic implants from ovarian carcinoma xenografts, compared to wild-type SK-OV-3 cells (Fig. 1A). To validate the microarray results, we performed qRT-PCR. The qRT-PCR results also revealed significantly higher MUC13 mRNA expression (1.7-6.1-fold) in implants from the xenografts, compared to wild-type SK-OV-3 cells (Fig. 1B).
The MUC13 promoter regions from the ovarian carcinoma xenografts are aberrantly hypomethylated
We investigated whether DNA methylation status was altered within the MUC13 promoter region in ovarian metastatic implants, compared to SK-OV-3 cells. We chose two ovarian metastatic implants to investigate: one with the smallest change in MUC13 mRNA expression (1C) and the other with the largest change in MUC13 mRNA expression (2C) (Fig. 1).
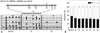
The MUC13 promoter region (124653578-124653990 in chromosome 3) was PCR amplified using bisulfite-modified genomic DNA as a template to obtain 413 bp bisulfite PCR products in the ovarian metastatic implants and wild-type SK-OV-3 cells. The DNA methylation patterns of each PCR product were determined by sequencing analyses. Our results showed that promoter CpGs are hypomethylated in both ovarian metastatic implant samples, compared to SK-OV-3 cells, particularly at -159, -123, and -64 CpGs (Fig. 2A). In addition, the CpG methylation status in implant 2C was demethylated at all six tested CpGs, compared to implant 1C and wild-type SK-OV-3 cells (Fig. 2A).
Further analyses of DNA methylation patterns using MSP also revealed significantly lower methylation at -64 CpG in the ovarian metastatic implants (n=7), compared to SK-OV-3 cells (Fig. 2B).
DNA methylation regulates MUC13 expression
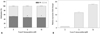
To determine whether altered MUC13 mRNA expression is regulated by DNA methylation of the promoter CpGs, we treated SK-OV-3 cells with the DNA methyltransferase inhibitor 5-aza-dC. After treatment with 0, 5, and 10 µM 5-aza-dC, decreased methylation activity at -64 CpG site was confirmed using MSP (Fig. 3A). Furthermore, MUC13 mRNA expression was significantly increased in a dose-dependent manner (Fig. 3B).
MUC13 overexpression correlates with aggressive phenotypes of ovarian cancer cells
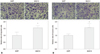
To explore the function of MUC13, we examined the effects of MUC13 on in vitro migration and invasion using transwell chambers. SK-OV-3 cells were transfected with full length MUC13 or enhanced green fluorescent protein cDNAs. MUC13 overexpression in transfected cells was confirmed using qRT-PCR (data not shown). We observed increased migration capacity of MUC13-transfected cells, compared to mock-transfected cells (Fig. 4A and B). For invasion assays, Matrigel-coated transwell chambers were used. As shown in Fig. 4, the number of invasive cells was markedly increased in MUC13-transfected cells, compared to mock-transfected cells (Fig. 4C and D).
DISCUSSION
MUC13 is a member of the membrane-associated mucin family and is commonly expressed in the trachea, kidney, esophagus, and gastrointestinal tract.18,19 The MUC13 glycoprotein is composed of a large 151-amino acid tandem repeat domain in the NH2-terminus that is highly O-glycosylated on serine and threonine residues. The degree and nature of glycosylation in this domain affects cell adhesion to the extracellular matrix and cell-cell interactions.19 The central region of MUC13 consists of a 23-amino acid transmembrane domain and three epithelial growth factor (EGF)-like domains that may potentially interact with EGF receptors to modulate ovarian cancer cell proliferation via epidermal growth factor receptor (EGFR) signaling pathways.13 The carboxyl (COOH)-terminus contains a 69-amino acid cytoplasmic domain that contains several potential phosphorylation sites and a protein kinase C phosphorylation motif,19 further suggesting that MUC13 may function as a signaling molecule.
Aberrant MUC13 overexpression has been demonstrated in colon cancer,6,20 gastric cancer,21 pancreatic cancer,22 and ovarian cancer.13 However, the regulatory mechanisms of MUC13 expression have not yet been elucidated. Our results showed that MUC13 mRNA expression is aberrantly up-regulated, with reduced methylation of specific CpG sites within its promoter in metastatic implants, compared to wild-type SK-OV-3 cells (Figs. 1 and 2). Treatment of wild-type SK-OV-3 cells with the DNA methyltransferase inhibitor 5-aza-2'-deoxycytidine dose-dependently enhanced MUC13 expression, thus implying epigenetic regulation of MUC13 by promoter methylation (Fig. 3). We also discovered that MUC13 overexpression increases migration and invasiveness, suggesting aberrant MUC13 up-regulation is strongly associated with progression of aggressive behavior in ovarian cancer cells (Fig. 4). Aberrant increased expression of MUC13 in ovarian cancer tissues, compared with normal ovary/benign tissues, has been previously demonstrated.13 In agreement with our results, Chauhan, et al.13 also reported that gain of functional MUC13 in ovarian cancer cells significantly increased cell motility, proliferation, and tumorigenesis in a xenograft mouse model system. However, DNA methylation-dependent epigenetic regulation of MUC13 has not been investigated in ovarian cancer. In this study, we demonstrated that MUC13 could be a novel metastasis-promoting gene that enhances the metastatic phenotype in ovarian cancer via epigenetic transcriptional regulation.
In conclusion, the results of the present study provide novel evidence for epigenetic regulation of MUC13 in ovarian cancer and suggest MUC13 influences the aggressive behavior of ovarian cancer. Although further clinical research is required, our findings suggest that the DNA methylation status within the MUC13 promoter region may be a potential biomarker of aggressiveness in ovarian cancer.
 XML Download