

 PDF
PDF ePub
ePub Citation
 Print
Print


INTRODUCTION
Malignant gliomas, the most common primary brain tumors, are highly invasive and neurologically destructive neoplasms with a very poor prognosis. Surgical resection is the main treatment option for glioma patients, but postoperative recurrence is a pressing problem due to the invasiveness of the gliomas. At present, comprehensive treatments, such as chemotherapy and radiotherapy, are used to treat glioma, but the prognosis is still very poor.1 The current research, therefore, has been focused on how to solve this problem.
Traditional chemotherapy is not the preferred adjuvant therapy after glioma resection due to its uncertain outcomes, but combined chemotherapy and radiotherapy or other adjuvant therapies have generally been shown to have a curative effect on glioma patients.2,3 Temozolomide (TMZ) is a new chemotherapy drug that has been shown to have positive effects on glioma patients in recent years,4 allowing doctors to reconsider the role of chemotherapy in the treatment of these patients. However, despite the fact that chemotherapy is beneficial in prolonging the survival time of patients, its impact has been limited. Drug resistance is the main reason for the failure of chemotherapy, particularly the emergence of multidrug resistance (MDR).5 Many molecular players participate in the formation of multidrug resistant glioma, including multidrug resistance protein, lung resistance-related protein, metal sulfur protein, and glutathione among others.5,6 Altered expression of these genes or proteins may be helpful in reversing the multidrug resistance of glioma.7,8 At present, patients treated with TMZ adjuvant therapy are also treated with other adjuvants, including receptor tyrosine kinase (RTK) inhibitors, to improve its curative effects.9
Leucine-rich repeats and immunoglobulin-like domains 1 (LRIG1) is a negative regulator of RTKs.10 The LRIG1 gene is the human homologue of mouse Lig-1 and is located on chromosome band 3p14.11 The expression of LRIG1 is reduced in human tumors.12,13 LRIG1 can inhibit the growth of glioma cells through the inhibition of epidermal growth factor receptor (EGFR) signaling.14 LRIG1 can also inhibit the growth of breast cancer cells, prostate cancer cells and so on.15,16,17 In addition, LRIG1 can negatively regulate c-Met receptor signaling,18 LRIG1 deletion induces upregulation of EGFR, ErbB2 and ErbB3, downregulation of LRIG1 can promote the proliferation of squamous cell carcinoma, breast cancer cells and so on.17,19 Therefore, LRIG1 may be a new tumor suppressor gene.20 LRIG1 expression is related to BCL-2 gene expression in human ependymomas,21 and B cell lymphoma/lewkmia-2 (BCL-2) is an apoptosis-inhibiting factor and is related to chemosensitivity.22 LRIG1 has been shown to improve chemosensitivity in bladder cells. However, whether LRIG1 can enhance the chemosensitivity of glioma cells and the mechanism by which it achieves this remain unknown.
We hypothesized that LRIG1 was related to the chemosensitivity of glioma cells and that LRIG1 expression could improve the cell's chemosensitivity through the inhibition of BCL-2, EGFR, and c-Met gene expression. To test this hypothesis, we constructed a multidrug resistant cell line, and studied the expression of LRIG1, BCL-2, EGFR, and c-Met. Using this cell line, we modulated the expression of LRIG1 and BCL-2, determined how these changes affected the cell's chemosensitivity.
MATERIALS AND METHODS
Reagents
Chemicals were purchased from Sigma-Aldrich (Wuhan branch, China). The LRIG1 plasmid was graciously provided by the Renmin Hospital of Wuhan University, China. The siRNAs against BCL-2 and LRIG1 were synthesized by Sangon (Shanghai, China). Antibodies were purchased from Abcam (Cambridge, UK).
Specimens
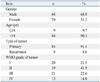
Specimens from 98 astrocytic tumors in 93 patients were collected at the Renmin Hospital of Wuhan University from April 2009 to January 2011. The present study was approved by the Ethics Committee of the Faculty of Medicine of Renmin Hospital, Wuhan University. The characteristics of these patients and tumors are shown in Table 1. Astrocytic tumor diagnoses of all specimens were panel reviewed by an experienced pathologist according to the criteria of the World Health Organization (2000).23 Included in our analyses are 20 cases of grade I, 39 of grade II, 21 of grade III, and 13 of grade IV astrocytomas.
Construction of a tissue microarray (TMA) of human brain astrocytoma
The tissue microarray (TMA) was constructed as previously described.24 The sample diameter of the tissue core in the micro-array block was 1000 µm. 5-µm thick sections were prepared from representative array paraffin blocks. Between 0 and 8.7% of samples were lost during the TMA section preparation or immunostaining procedures. The tissue array was purchased from Beacher, Sun Prairie, WI, USA. The paraffin embedding machine was purchased from Leica (Bannockburn, IL, USA); the immunohistochemistry kit was purchased from Boster (Wuhan, China); and the optical microscope (BX51) was purchased from Olympus (Tokyo, Japan).
Immunohistochemistry for LRIG1 and BCL-2 expression in the TMA
According to previously described methods,21 the LRIG1 antibody and BCL-2 antibody (Abcam, UK) developed in our laboratory were used for the immunostaining. Negative controls were not treated with primary antibodies. As shown in previous analysis,21 the astrocytic tumor cells were immunoreactive in the cytoplasmic, nuclear, and perinuclear areas. LRIG1 and BCL-2 expression in the TMA was determined. All evaluations were performed using the blind method and agreed on by four observers.
The isolation of a multidrug resistant cell line
The U251 cells were purchased from the State Key Laboratory of Molecular Biology, Institute of Biochemistry and Cell Biology, Shanghai Institutes for Biological Sciences, Chinese Academy of Sciences, Shanghai, China. The cells were cultured in Dulbecco's modified Eagle's medium supplemented with 10% fetal bovine serum in a humidified incubator (Sanyo, Osaka, Japan) with 5% CO2 at 37℃. Basal cell culture was maintained in T-75 flasks (Sigma-Aldrich, St. Louis, MO, USA). Cells were trypsinized when they reached 80-90% confluence and were seeded into 6-well plates. TMZ was added to the 6-well plates at an initial concentration of 0.25 µg/mL. The concentration was doubled after the cells were cultured for 15 days, and the final concentration of TMZ was 16 µg/mL. After withdrawal of TMZ for 2 months, the cells were re-challenged with 16 µg/mL TMZ for 1 week every month.
RT-PCR
Total RNA was isolated using an RNA miniprep kit (Sigma Santa Clara, CA, USA). For RT-PCR, the cDNA was synthesized using a cDNA reverse transcription kit (Applied Biosystems, Zurich, Switzerland), and the PCR kits were purchased from Sigma. Based on the LRIG1, BCL-2, and β-actin gene sequences, three pairs of gene-specific primers were designed: LRIG1 sense 5'-ttgctgatgttgtttcgctg-3'and antisense 5'-tgatggtctgtcacggtcg-3', BCL-2 sense 5'-ttctttgagttc ggtggggtc-3' and antisense 5'-tgcatatttgtttggggcagg-3', β-actin sense 5'-gtccaccgcaaatgcttcta-3' and antisense 5'-tgctgtcaccttcaccgttc-3'.
Transfection and CCK-8 assay
To overexpress LRIG1, U251/MDR and U251 cells at 50-80% confluence were transfected with the LRIG1 plasmid (2 µg/well, 6-well plate) using the FUGENE HD transfection reagent (Roche, Basel, Switzerland) according to the manufacturer's instructions.
For knockdown experiments, siRNAs against human BCL-2, LRIG1, and control siRNA were purchased from Sangon. According to the manufacturer's instructions, cells at 30-50% confluence were transfected with a final concentration of 40 nM siRNA using the Lipofectamine 2000 transfection reagent (Invitrogen, Carlsbad, CA, USA).
Exponentially growing cells were plated in 96-well plates (1000 cells/well). After 24 h, the U251/MDR and U251 cells were transfected and cultured for 48 h or 72 h, and Cell Counting Kit 8 (CCK-8) solution (10 µL/well) was added to the cells. The cells were then incubated for 1 h at 37℃. Cell proliferation was determined by measuring absorbance at 490 nm with a microplate reader (Leibo, Finland). The inhibition ratio of proliferation was calculated using the following equation: (control group CCK-8-experimental group CCK-8)/control group CCK-8.
Immunoblotting
Total protein was extracted from the U251 and U251/MDR cells of each group 48 h after transfection, and the total cell extracts were centrifuged at 12000 rpm at 4℃. The protein concentration was determined using the Bradford method, with bovine serum albumin as the standard. Protein lysates (30 µg) were resolved using sodium dodecyl sulfate-polyacrylamide gel electrophoresis, transferred to polyvinylidene fluoride membranes (Millipore, Bedford, MA, USA), and then probed with primary antibodies overnight at 4℃. The membranes were then incubated with the corresponding horseradish peroxidase-conjugated secondary antibodies at room temperature, and the reaction was visualized using chemiluminescent electrochemiluminescence. Antibodies were purchased from Abcam.
Statistical methods
The statistical analyses were performed using the Prism 5.0 software (Graphpad Software, La Jolla, CA, USA). All data are presented as mean±SEM. The statistical significance of the findings between the experimental and control groups was determined using Student's t-test or ANOVA. A value of p<0.05 was considered statistically significant.
RESULTS
LRIG1 was negatively correlated with BCL-2 expression in glioma tissue
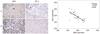
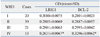
Immunohistochemical results show LIRG1 proteins localized to different subcellular compartments in human brain astrocytomas, including the cytoplasm, nucleus and perinuclear area. BCL-2 proteins are mainly located in the cytoplasm of human brain astrocytomas (Fig. 1). Moreover, LRIG1 expression was negatively correlated with BCL-2 expression (r=-0.713, p<0.05) (Fig. 1, Table 2).
Establishment of MDR cell line and the expression of LRIG1 and BCL-2
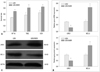
The multidrug resistant cell line U251/MDR was isolated by stepwise exposure to increasing TMZ concentrations for approximately 6 months. This cell line exhibited resistance to TMZ, etoposide (VP-16), and vincristine sulfate (Fig. 2A). The expression of LRIG1 and BCL-2 was detected in the U251/MDR cells using RT-PCR and Western blot (Fig. 2B and C), and the results showed that LRIG1 expression was reduced whereas BCL-2 expression was increased, compared to the parent cells. LRIG1 expression was negatively correlated with BCL-2 expression (p<0.05).
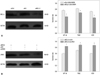
LRIG1 can inhibit BCL-2 expression and improve the chemosensitivity of glioma cells
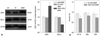
The LRIG1 plasmid was transfected into U251/MDR cells. Immunoblot analysis showed that LRIG1 expression in the LRIG1-U251/MDR cells was significantly increased whereas BCL-2 expression was downregulated when compared to the control group (Fig. 3A). Next, we detected BCL-2 expression and the changes in chemotherapy sensitivity in the LRIG1-U251/MDR cells, using the CCK-8 assay compared to the untransfected N1-U251/MDR cells (Fig. 3B). The results showed that increasing LRIG1 expression could inhibit BCL-2 expression and enhance the chemosensitivity of U251/MDR cells.
BCL-2 knock down can enhance the chemosensitivity
siRNA targeting BCL-2 was transfected into U251/MDR cells, and the results showed that BCL-2 expression was significantly reduced. Next, we found that silencing BCL-2 can enhance the chemosensitivity of glioma cells (Fig. 4).
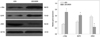
LRIG1 can enhance chemosensitivity by regulating the BCL-2 gene in glioma cells
Our results showed that LRIG1 expression improved the chemosensitivity of glioma cells and inhibited BCL-2 expression. We also showed that depletion of BCL-2 could enhance the chemosensitivity of glioma cells. To detect whether LRIG1 enhanced the chemosensitivity through the regulation of the BCL-2 gene, we knocked down BCL-2 in U251/MDR cells and then knocked down LRIG1 by siRNA. As seen in Fig. 5, siLRIG1 could reduce the sensitivity to chemotherapy and reverse the effect of siBCL-2, thus leading us to conclude that LRIG1 enhanced the chemosensitivity of glioma cells through the regulation of BCL-2 expression.
The expression of multiple RTKs was increased in U251/MDR cells, and LRIG1 negatively correlated with RTK expression
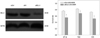
The expression of many RTKs was increased in glioma cells, including EGFR and c-Met,25,26 and some RTK inhibitors have been shown to enhance the effects of glioma therapy.27,28 We detected the expression of EGFR and c-Met in the U251/MDR cell line using immunoblot analysis, and Fig. 6 shows that the expression of these genes was increased in the U251/MDR cells, compared to the parent U251 cell line.
DISCUSSION
Gliomas are the most common malignant tumors of the central nervous system and a serious threat to a patient's health and life. Therefore, there is an urgent need to identify effective treatments that control it's the growth and recurrence. Chemotherapy is an important component in the treatment of tumors. In recent years, TMZ, a new chemotherapy drug, has proven to be effective in the treatment of gliomas. However, tumor resistance, particularly multidrug resistance, reduces the effectiveness of TMZ. How to solve this problem has become the focus of current research.
LRIG1 is an inhibitor of RTKs that was discovered in recent years, and it is highly expressed in a variety of tissues. LRIG1 is highly expressed in brain tissues, particularly glioma cells.11,29 Goldoni, et al.30 reported that LRIG1 can inhibit the growth of glioma cells through the inhibition of EGFR signaling. Our study showed that LRIG1 expression was reduced in glioma cells, and its expression level decreased with increasing tumor grade; therefore, higher grade gliomas have a stronger drug resistance. This finding indicated that LRIG1 is a tumor suppressor gene and may be related to tumor drug resistance. In addition, some researchers have reported that LRIG1 can inhibit the function of the glial cell line-derived neurotrophic factor, which can reduce the sensitivity of neuroblastoma cells to chemotherapy.31,32 Li, et al.33 also showed that LRIG1 expression in combination with cisplatin treatment can enhance the effect of chemotherapy in bladder cancer. These results suggest that LRIG1 may be involved in drug resistance. To elucidate the relationship between LRIG1 and multidrug resistance in glioma cells, we constructed the multidrug resistant cell line U251/MDR, and examined the expression of LRIG1 in these cells. Our data showed that the expression of LRIG1 was downregulated in U251/MDR when compared to the parent cells. Moreover, when an LRIG1 overexpression plasmid was transfected into U251/MDR cells, the cell's MDR status was reversed, thus confirming that LRIG1 expression either in glioma tissue or in glioma cell lines, is related to the chemosensitivity of gliomas and that upregulation of LRIG1 expression can enhance the chemosensitivity of glioma cells.
However, the mechanism by which LRIG1 improved the chemosensitivity of glioma cells remained unclear. Our earlier study showed that BCL-2 expression was higher in astrocytomas than in normal brain tissue,34 and the expression of LRIG1 is negatively correlated with the expression of BCL-2.21 BCL-2 is an inhibitor of apoptosis in tumors.35 Nordfors and colleagues found that downregulation of BCL-2 expression can increase the chemosensitivity of glioma cells.36,37,38,39 These results suggested that LRIG1 enhances chemosensitivity by regulating the expression of BCL-2 in gliomas. Our data showed that BCL-2 expression was increased compared to that in the parental U251 cells. We also downregulated the expression of BCL-2 and showed that downregulation of BCL-2 could reverse the drug resistance of the U251/MDR cells. In addition, when the LRIG1 expression in U251 cells was knocked down using siRNA, the effect of siLRIG1 was lost. This series of findings confirmed that LRIG1 can improve the chemosensitivity of glioma cells by regulating the expression of BCL-2.
LRIG1 is a negative regulator of RTKs that enhances receptor ubiquitination and degradation.15,40,41 In the resistant cell line, the expression of EGFR and c-Met increased compared to the U251 cells, and LRIG1 expression was negatively correlated with the expression of EGFR and c-Met. EGFR plays an important role in the proliferation of cancer cells. EGFR gene-targeted therapy has been used for the treatment of some cancers, and it also can stimulate apoptosis in glioma cells. Additionally, downregulation of EGFR expression can enhance the chemosensitivity of tumors.42,43,44 c-Met is an another RTK, and recent studies have shown that modulating its expression can regulate the proliferation and chemosensitivity of glioma cells,45,46,47,48 and that LRIG1 can modulate cancer cell sensitivity through its regulation of receptor tyrosine kinase signaling. Therefore, LRIG1 is likely to promote chemotherapy sensitivity by regulating RTKs in glioma cells.
In summary, we demonstrated herein that LRIG1 protein expression could improve the chemosensitivity of glioma cells through the downregulation of BCL-2 and the inhibition of the RTK signaling pathways. When glioma cells retained LRIG1 expression, the BCL-2 and RTK genes expressions were downregulated. When glioma cells lost LRIG1 expression, the BCL-2 and RTK genes became upregulated and stimulated chemo-resistance. It is, therefore, possible that treatment with BCL-2 and RTK inhibitors may improve the clinical effects of chemotherapy in glioma patients.
 XML Download