

 PDF
PDF ePub
ePub Citation
 Print
Print


INTRODUCTION
Obesity is a common condition and is increasing in prevalence worldwide, including in Asia.1 Obesity is defined as a state of excess adipose tissue, and it is associated with numerous chronic health conditions, such as type 2 diabetes mellitus, cardiovascular disease, hypertension, and cancer. Moreover, mortality rates are increased in obese individuals.2,3,4 Consequently, identifying obesity to estimate the risks of associated diseases is a major health concern.
Obesity is characterized by excess body fat, something difficult to measure. Increased body fat is usually accompanied by increased total body mass; therefore, indices of relative weight are commonly used to diagnose obesity. One of the most commonly used indices of relative weight is body mass index (BMI), which is an accepted index to characterize obesity in individuals and most widely used in epidemiological studies.5 BMI is very useful; however, despite its widespread use, it is only a surrogate measurement of body fat, and it does not provide an accurate measurement of body composition,6 and may be influenced by age, sex, and ethnicity.7 Moreover, adipose tissue is responsible for the majority of obesity-associated diseases; therefore, complex and expensive methods, such as dual-energy X-ray absorption (DXA) or magnetic resonance imaging, must be used to measure body fat accurately.8,9
Recently, the body adiposity index (BAI) was proposed as a tool to evaluate adiposity, to overcome the shortcomings of BMI.10 BAI can be calculated solely from the hip circumference and height {(hip circumference)/[(height1.5)-18]}, and it can be used to reflect body fat percentage (BF%) in adults.10 BAI was suggested to have several advantages over BMI, including that it yields similar associations with BF% for men and women and may be more practical to assess in field studies because it does not require a weight measurement.11 BAI was developed and validated in studies of Mexican-American and African-American adults. Several recent studies of BAI values for predicting fat content or metabolic disorders in European-American, Mexican-American and Caucasian subjects have reported controversial results.11,12,13,14,15,16,17,18,19,20 In Caucasians, BAI is a better estimate of adiposity than BMI in non-obese subjects, but less effectively than BMI in obese men and women.12,15 Another study reported that BMI more strongly correlated with BF% than BAI, and more highly associated with diabetes risk in Caucasian.14 In Mexican Americans, BAI was correlated more strongly than BMI with BF% in sex-pooled analyses, but not in sex-stratified analyses. Also, BAI is inferior to the widely used BMI as a correlate of the cardiometabolic risk factors.17 In a Spanish-Mediterranean population, the Receiver Operating Characteristic (ROC) curve analysis showed a higher accuracy for BMI than BAI. Also, in African-American and Hispanic women, the use of BAI has no advantage over the use of BMI.11,16,19,20 Only one study has determined the relationship between both BMI and BAI and BF% in Asian subjects,21 and additionally, the utility of this index for metabolic risk has not yet been confirmed in this ethnicity. Therefore, it is important to validate BAI for predicting adiposity and metabolic risk in other Asian groups.
The objective of this study was to determine whether BAI would accurately represent body fat and metabolic risk in Korean women.
MATERIALS AND METHODS
Subjects
The present cross-sectional study was carried out on 2950 Korean women (aged 18-39 years old) recruited from Ewha Womans University Hospital within the framework of the "Health check-ups of women", which was undergone between December 2008 and October 2010. The participants were recruited from Seoul and the surrounding urban area, and they consisted of students (n=1481), office clerks (n=622), professional workers (n=471), and unemployed women including housewives (n=376). Participants in the study provided complete medical histories regarding their health status, current medication histories, social habits, such as alcohol drinking and smoking, eating habits, physical activity, and family histories of chronic disease. Subjects were excluded from participation if they had any acute disease, severe liver, heart, or kidney dysfunction, cancer, or other conditions capable of altering body composition. The use of certain drugs, such as steroids or diuretics, was also a criterion for exclusion. The institutional review board of the Ewha Womans University Mokdong Hospital approved the study protocol, and written informed consent was obtained from all the participants.
Methods
Anthropometric examination and body fat analysis
The anthropometric examinations and bioelectrical impedance tests were performed by a single experienced nurse. The subjects were instructed to avoid all diuretics for 7 days, alcohol for 2 days, intense exercise for 1 day, and all fluids for 4 hours.
Blood pressure was measured using a sphygmomanometer with standardized oscillometric cuff sizes. Weight and height were measured for all the subjects. The waist circumference was measured on bare skin at the narrowest indentation between the 10th rib and the iliac crest at mid-respiration. The hip circumference was measured at the widest point over the greater trochanters. BMI was calculated as the weight in kilograms divided by the square of the height in meters (kg/m2), and BAI was calculated as (hip/height1.5)-188. A BMI of at least 25 kg/m2 is considered obese, based on the Asia-Pacific criteria.22
After the anthropometric measurements were obtained, the subjects were instructed to assume a resting supine position for 30 minutes, after which bioelectrical impedance measurements were taken. A single-frequency bioelectrical impedance plethysmograph was used (InBody 230, Biospace Industry, Seoul, Korea). Standard electrocardiographic electrodes were placed on the hands and feet. Isopropyl alcohol was used to clean each electrode attachment site. The subject's legs were parted, and the arms were adducted by approximately 30° to prevent skin-to-skin contact. The cut-off used to define obesity was ≥35% BF, which is the most frequently used value reported in the literature.23,24,25,26
Laboratory evaluation
The 75-g oral glucose tolerance test was performed in the morning after an overnight fast. A polyethylene catheter was placed into the antecubital vein prior to the test. After 30 minutes of supine rest, venous blood samples were obtained at baseline and at 90 minutes and 120 minutes after the 75-g glucose load. Insulin sensitivity was estimated using the insulin sensitivity index (ISI) by Stumvoll, et al.,27 according to the following formula: ISI=0.157-4.576×10⁻⁵×I120-0.00519×G90-0.000299×I0 (I120: post-load insulin at 120 minutes; G90: post-load glucose at 90 minutes; and I0: fasting insulin). Glucose tolerance was classified as follows: normal glucose tolerance: fasting plasma glucose <100 mg/dL and 2-hour post-load plasma glucose <140 mg/dL; impaired fasting glucose: fasting plasma glucose 100-125 mg/dL and 2-hour post-load plasma glucose <140 mg/dL; impaired glucose tolerance: 2-hour post-load plasma glucose 140-199 mg/dL but fasting plasma glucose <100 mg/dL; or diabetes: fasting plasma glucose ≥126 mg/dL or 2-hour post-load plasma glucose ≥200 mg/dL.28 Metabolic syndrome was diagnosed according to the Adult Treatment Panel III of the National Cholesterol Education Program (NCEP ATP III).29 This diagnosis requires the presence of central obesity with a waist circumference ≥80 cm, dyslipidemia with triglycerides ≥150 mg/dL, and high density lipoprotein (HDL) cholesterol <50 mg/dL. Hypertension and hyperglycemia were diagnosed with blood pressure ≥130/85 mm Hg and fasting plasma glucose ≥100 mg/dL, respectively. Metabolic syndrome was diagnosed when at least three of the five metabolic abnormalities were present. Plasma glucose levels were measured using the glucose oxidase method (Beckman Model Glucose Analyzer 2, Brea, CA, USA), and insulin levels were measured by radioimmunoassay using a commercial kit (Biosource, Nivelles, Belgium). Fasting serum total cholesterol, triglycerides, and HDL cholesterol levels were measured with an enzymatic assay on an automated analyzer (Hitachi 7150 Auto-Chemistry Analyzer, Tokyo, Japan).
Statistical analysis
Statistical evaluation was performed with the SPSS software package, version 18.0 for Windows (IBM Corporation, Chicago, IL, USA). The quantitative variables are provided as the means±standard deviations. Two-tailed p values <0.05 were considered significant. Pearson's correlations were used to examine the correlations between BMI and BAI and metabolic indices.15,17,19,21,30 Partial correlation was also used to adjust for the effect of age. An asymptotic test for comparing two correlated correlation coefficients, using Fisher's Z transformation, was used to compare the accuracy of BMI and BAI and their associations with other anthropometric measurements and metabolic indices.31
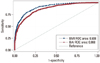
The diagnostic accuracy of BMI and BAI were assessed by constructing ROC curves to detect BF%-based obesity.18,21 The areas under each ROC curve were calculated using the logistic procedure in STATA (Stata Corp, College Station, TX, USA), in which the area under the curve (AUC) was determined by integration. A bootstrapping procedure was used to test for differences between the areas under particular curves. The ROC curve allows the evaluation of several cutoff points for different pairs of sensitivity and specificity. Cutoff values of BMI and BAI for the diagnosis of obesity were derived mathematically from the ROC curves, using the point of the ROC curve with the highest value for the formula: sensitivity+specificity.
Multiple linear regression analysis was conducted using the ISI as the dependent variable and BMI, BAI, age, mean blood pressure, total cholesterol, triglycerides, and HDL cholesterol as independent variables to determine the BMI-ISI and BAI-ISI relationships. We used the variance inflation factor after the regression to check for multicollinearity. Multivariate logistic regression analysis was performed to determine the variables that were predictive of metabolic syndrome.
RESULTS
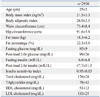
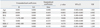
The mean age of the subjects was 25±5 years old. The mean BMI was 21.5 kg/m2 (14.5 to 39.3 kg/m2), and the mean BAI was 26.9 (18.5 to 44.2) (Table 1). Among 2950 subjects, 30 (1.0%) had diabetes, 185 (6.3%) were classified as having impaired fasting glucose or impaired glucose tolerance, and 148 (5.0%) were hypertensive. Additionally, 163 (5.5%) subjects had metabolic syndrome as diagnosed by the NCEP ATP III criteria. The prevalence of obesity was 12.2% by BMI (≥25 kg/m2) and 31.9% by BF% (≥35%).
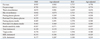
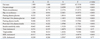
BMI and BAI were well correlated with each other (r=0.824, p<0.001). Compared to BAI, BMI showed a strong correlation with fat mass (r=0.935 vs. 0.735), fat percentage (r=0.791 vs. 0.748), and metabolic indices, such as fasting glucose (r=0.257 vs. 0.196), post-load 2-h glucose (r=0.333 vs. 0.270), fasting insulin (r=0.485 vs. 0.370), post-load 2-h insulin (r=0.463 vs. 0.378), ISI (r=-0.567 vs. -0.449), triglycerides (r=0.374 vs. 0.294), and HDL cholesterol (r=-0.315 vs. -0.263). After adjusting for age, the differences in the correlation coefficients remained statistically significant (Table 2). The correlation coefficients for fat mass, fat percentage, waist circumference, hip circumference, fasting glucose, post-load 2-h glucose, fasting insulin, post-load 2-h insulin, ISI, triglycerides, and HDL cholesterol were significantly different between BMI and BAI, as assessed by Fisher's Z test (Table 3).
The ROC curves to detect excess BF% (≥35%) showed AUC of 0.908 for BMI [confidence interval (CI): 0.897-0.918] and 0.868 for BAI (CI: 0.854-0.881). A comparison of the areas under the curve between BMI and BAI was performed with STATA, and the area under the BMI curve was significantly greater than the area under the BAI curve (Fig. 1). The sensitivity and specificity of the BMI cut-off value for the diagnosis of obesity (based on BF% ≥35%) were 36.0% and 99.0%, respectively. The BAI cut-off value for the diagnosis of obesity had sensitivity and specificity of 46.6% and 95.9%, respectively.
Multiple regression analysis showed that insulin sensitivity was significantly associated with BMI (β=-0.469, p<0.001) but not with BAI (β=0.059, p=0.198) (Table 4) after adjustments for age, total cholesterol, triglycerides, HDL cholesterol, and mean blood pressure. BMI (OR 1.57, p<0.001) and age (OR 1.10, p=0.001) were significant predictors of metabolic syndrome, based on the logistic regression analysis (Table 5).
DISCUSSION
In this study, we evaluated whether BAI, a new index of body adiposity, represents body fat and metabolic risk in Korean women similarly to or more accurately than BMI. Our results showed that BMI was a better tool for predicting body adiposity in Korean women and was more significantly associated with metabolic risks than BAI.
Various methods have been developed to assess obesity; however, BMI is the most commonly used approach to characterize obesity in individual subjects. BMI has many advantages, but the accuracy of BMI as a body-composition marker has been controversial, and BMI has several limitations, particularly its inability to differentiate lean mass from fat mass.32,33 BMI is relatively inaccurate in subjects with high lean body mass, such as athletes, and it cannot be generalized among different ethnic groups.6,34 Such limitations might be more relevant when dealing with the metabolic states associated with altered body fat distribution.
A new measurement, BAI, was recently proposed to provide more valid estimates of BF% in adults.10 In a previous study, BF%, measured by DXA, was used as the criterion for body fat, and the reported correlation of BAI with body fat percentage was greater than with BMI. BAI was found to be a strong predictor of BF% in Mexican-American subjects of widely varying adiposities, and this result was confirmed in a study of African-Americans.10 BAI had better concordance and a significantly stronger correlation with BF% than BMI, although BAI was inaccurate at low levels of adiposity in European-American adults.12 Interestingly, BAI has an advantage over BMI for defining adiposity, but BAI overestimated BF% in men and underestimated it in women.12 Another study demonstrated that BAI could also be used to determine the fat content in patients with adipose tissue scarcity, such as individuals with familial partial lipodystrophy. The percentage of total adipose tissue measured by DXA was strongly correlated with BAI and was more strongly correlated with leptin levels than BMI.13 However, only one study has attempted to validate the BAI on an Asian population. The results suggested that BMI was a more reliable indicator of BF% derived from skinfold thickness in adult Asian.21 Ethnic differences in hip circumference and height could exist, and the frequency of physical activity can also affect the measured value. It appears that the utility of BAI for detecting fat content and metabolic indices might differ according to age, sex, or ethnicity. Therefore is important to validate BAI for predicting adiposity and metabolic risk in other Asian groups.
Compared to the Mexican-American sample used to create the BAI,10 the mean BMI in this study was 8 kg/m2 less, and the mean age was 10 years younger. In our study, both BMI and BAI were significantly correlated with other anthropometric measurements and metabolic indices. However, the correlations of BMI with these anthropometric parameters and metabolic indices were stronger. ROC analysis revealed superior discrimination of BMI, compared to BAI, for obesity based on BF%. These findings contrast with previous results demonstrating that BAI showed stronger correlations with total fat and fat mass.12,13,15 Our results were comparable to other recent studies which showed that BMI is more strongly associated with adiposity and metabolic risk factors than is BAI.16,17,18,19,20 BMI was more accurate surrogate for adiposity in American,19,20 Mexican Americans,17 Caucasian,18 and Asian subjects.21 Also one found that BMI was more strongly correlated with insulin sensitivity and type 2 diabetes risk.14 A previous study with Buryat adults in China showed that BMI is a more reliable indicator of BF% than BAI, which is in accordance with our findings. They reported that BMI had a higher correlation with BF%, and also better predicted the BF%. Differing from our study method using bioelectrical impedance, they measured four classic skinfold thicknesses to calculate the BF% in both sex.
We found that BMI was more significantly associated with insulin sensitivity than BAI. BMI was also a significant predictor of metabolic syndrome after adjustments for age, insulin sensitivity index, and BAI. Therefore, it appears that in Korean women, BMI remains a reliable measurement of body adiposity and metabolic risk.
The strengths of our study include the large number of subjects, the availability of data on the insulin sensitivity index, and the assessment of glucose tolerance using an oral glucose tolerance test. The height of mature individuals is relatively constant; therefore, the measurement of hip circumference might introduce errors into the estimation of BAI. To minimize this error, one well-trained practitioner measured hip circumference. One limitation of our study was the use of bioelectrical impedance to assess body fat. BF% is defined as the proportion of individual fat mass over body weight. The relationship between BF% and BMI is not linear.35 A high BF% does not necessarily mean a high BMI, and vice versa. The cut-off used to define obesity was ≥35% BF, which is the most frequently used value reported in the literature. Although DXA is the gold standard for the measurement of body fat content,36 validation studies of bioelectrical impedance have generally shown strong correlations with other body composition methods, such as hydrostatic weighing and isotope dilution.37 The ease of use, lack of radiation, and relatively low cost of bioelectrical impedance suggest that it is a feasible alternative for measuring body fat, particularly in large populations. Our subjects are not representative of the general population, as we examined the diagnostic performances of BMI and BAI in relatively young women only. Therefore, these results might not apply to other age groups or to male subjects. Also, another limitation is lack of racial and ethnic diversity, which provided us with the ability to test BAI's performance in a Korean population.
In conclusion, our findings suggest that BMI is superior to BAI as a representation of body adiposity and metabolic risk in Korean women. The low cost, simplicity, wide availability, and good validity of these anthropometric measurements make them particularly valuable for epidemiologic studies; however, further research is warranted to investigate the utility of BAI in Asian populations of different ages and both sexes.

 XML Download