

 PDF
PDF ePub
ePub Citation
 Print
Print


The pons is a narrow area of the brain through which the corticospinal tract (CST) passes into the basis.1 Conventional brain MRI cannot discriminate these structures; therefore, it was not possible to isolate the CST area from adjacent neural structures. By contrast, the color map of diffusion tensor imaging (DTI) allows for isolation of the CST area from other adjacent neural structures.2
Several previous studies of patients with pontine infarcts have reported that the severity of motor weakness did not correlate with the size of the pontine lesion, and that motor outcome differed according to the pontine level; however, the exact reason for these phenomena has not been elucidated.3-6 It might be related to the characteristics of the CST area according to the pontine level. Therefore, clarification of the characteristics of the CST area according to the pontine level could be important for clinical neuroscience.
In the current study, we attempted to investigate the characteristics of the CST areas according to the pontine level in the normal human brain by using DTI.
We recruited 33 healthy subjects (male: 18, female: 15, mean age: 37.2 years, range: 20-54 years) with no previous history of neurological, physical, or psychiatric illness. All subjects understood the aim of the study, and provided written, informed consent prior to participation. The study protocol was approved by the Institutional Research Board of a university hospital.
DTIs were scanned using a sensitivity-encoding head coil on a 1.5-T Philips Gyroscan Intera (Hoffman-LaRoche, Ltd., Best, the Netherlands) with single-shot echo-planar imaging with a navigator echo. Sixty-seven contiguous slices (matrix=128×128, field of view=221×221 mm2, repetition time/echo time=10726/76 ms, b=1000 mm2s-1, NEX=1, slice gap=0 mm and thickness=2.3 mm) were acquired for each of the 32 noncollinear diffusion-sensitizing gradients.
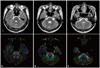
Regions of interest were given at the anterior blue portion of the pontine basis on the color map at three levels; upper pons-the first axial image on which the superior cerebellar peduncle could be seen, middle pons-the axial image on which the largest portion of the middle cerebellar peduncle could be seen, and the lower pons- the axial image on which the middle cerebellar peduncle between the mid-pons and pontomedullary junction could be seen (Fig. 1).1 We measured the size and FA value of the CST area at each level and size was measured using count of voxels. For measurement of inter-observer and intra-observer reliability, random analyses of the data were performed by two evaluators (Jang SH and Seo JP) who were blinded to the other evaluator's data.
SPSS software (v.15.0; SPSS, Chicago, IL, USA) was used for data analysis. One-way ANOVA with Fisher's least significant difference post-hoc test was used for determination of the difference in terms of FA value and the CST area between the upper, middle, and lower pons. The significance level of the p value was set at 0.05. To evaluate inter-observer and intra-observer reliability, we used intraclass correlation coefficient (ICC).
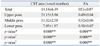
The size of the CST area in the lower pons was smaller than that of the middle pons and upper pons, and the size of the CST area in the middle pons was smaller than that of the upper pons (p<0.05) (Table 1). FA values of the lower pons were higher than those of the middle pons and upper pons, and the FA value of the middle pons was also higher than that of the upper pons (p<0.05). And, we observed good intraobserver (ICC=0.93 to 0.99) and interobserver (ICC=0.87 to 0.92) reliability.
In the current study, we measured the size and FA value of the CST areas according to the pontine level in the normal human brain using DTI, and found that the sizes of the CST areas were as follows: upper pons, mid-pons, and lower pons, in contrast, vice versa, in terms of FA value. The FA value is influenced by the degree of directionality of microstructures (e.g., axons, myelin, and microtubules).2,7,8 A higher FA value suggests greater directionality of the CST area. Consequently, the smaller area and higher FA value from rostral to caudal direction in the pons appear to indicate a more compact neural structure of CST areas.
Some studies conducted for patients with pontine infarct have reported a lack of correlation between the severity of motor weakness and the size of the pontine lesion.3-5 Kim, et al.5 suggested that the reason for this discrepancy could be attributed to the degree of compactness of the CST according to the pontine level. On the other hand, Kataoka, et al.6 reported that a favorable outcome was related to the level of the pontine lesion in the following order: upper pons>middle pons>lower pons. It is highly likely that these previous results are in support of our present result, indicating a more compact neural structure of CST areas from rostral to caudal direction in the pons. However, the limitations of DTI should be considered in the interpretation of the results.9 DTI can lead to an oversimplification of the anatomy due to lower magnification. In addition, the measurement of DTI parameters is operator-dependent and DTI may underestimate the fiber tracts in the regions of fiber complexity and crossing. Further studies on clinical correlation and prediction of motor outcome, using a technique for measurement of the CST area on DTI as done in this study, are needed in near future.
 XML Download