

 PDF
PDF ePub
ePub Citation
 Print
Print


INTRODUCTION
ROS1 is an oncogene that encodes a transmembrane protein with tyrosine kinase sequences. Although ROS1 is not expressed in normal brain tissues, including glial cells, ROS1 is expressed in malignant glioblastoma cell lines.1 In animals and humans, ROS1 is expressed in the kidney and gastrointestinal tract and, in rare cases, in several other organs as well including the epididymis, lungs, liver, heart, and breast.2-4 ROS1 might mediate the effects of early stage tumor progression.5 In previous studies, we demonstrated that ROS1 is more highly expressed in fibroadenoma-the most common benign breast tumor-than in normal breast tissue.4 In addition, it was reported that ROS1 is transiently expressed during lung development and is important for lung cancer tumorigenesis in a murine model.6 ROS1 is highly expressed in a rat hepatoma cell line,7 and ROS1 is mutated in human colon and kidney carcinoma cell lines.8 Therefore, the authors assumed that ROS1 might be expressed in both benign and malignant breast tumors, and its expression might be associated with prognostic factors for breast cancer. Until now, ROS1 expression has not been studied in breast cancer. In this study, we compared the expression of ROS1 protein and ROS1 mRNA with diverse, well-established prognostic factors of invasive ductal carcinoma (IDC) and with patient survival to determine the prognostic value of ROS1. To our knowledge, the first study of ROS1 expression in IDC, will provide new insights into prognostic values and therapeutic targets in IDC.
MATERIALS AND METHODS
Patients
The Institutional Review Board of Yonsei University Wonju Christian Hospital (CR107064) approved this study. The study included 203 tissue samples from patients with IDC. All tissue samples were surgically resected and pathologically diagnosed at the Yonsei University Wonju Christian Hospital from 1998 to 2009. We found successive cases of IDC from electronic records, and we reviewed all hematoxylin-eosin stained slides and selected study cases by tissue availability. All were formalin-fixed paraffin embedded tissues. Forty-six cases were available for fresh tissue. The pathologic diagnosis, hormone receptor status, HER-2 status, and Ki-67 proliferation index were reconfirmed by examining hematoxylin-eosin and immunohistochemical stained slides, reviewing pathological reports, and reviewing clinical records. Histologic grade was classified with a modified Bloom and Richardson grading method by two expert pathologists.9,10
Immunohistochemistry
Tissue microarray (TMA) block preparation
First, a representative tumor site was chosen from hematoxylin-eosin stained slides and was marked. Areas with necrosis, hemorrhage, or artifacts were excluded. The selected tumor area was harvested using a 5 mm Quick-ray tip-punch (Unitma, Seoul, Korea), placed on a tissue microarray mold with 20 pores (Unitma, Seoul, Korea), and re-embedded in paraffin.11 TMA blocks were prepared as 4 µm thick sections, and stained with hematoxylin-eosin. They were examined to verify that the appropriate tumor site was selected.
Staining methods
TMA blocks were sectioned, attached to coated slides, and labeled. Ventana Benchmark XT (Roche Diagnostics, Basel, Switzerland) was used as an automatic staining procedure. The sections were deparaffinized, then pretreated with CC1 (Roche Diagnostics, Basel, Switzerland) for 60 min at 42℃. The sections were then washed with reaction buffer and incubated with ROS1 antibody (Santa Cruz Biotechnology, Santa Cruz, CA, USA) at a 1 : 50 dilution for 60 min at 42℃. The antibody was detected with the UltraView Universal DAB kit (Roche Diagnostics, Basel, Switzerland) according to the manufacturer's recommendations, followed by counterstaining with hematoxylin (Roche Diagnostics, Basel, Switzerland). Hepatocellular carcinoma tissue was used as a positive control for ROS1. A negative control was also performed without primary antibody (Fig. 1A).
Evaluation method
The tumor cells in which the membrane and cytoplasm
were stained dark brown by light microscopy were considered positive. For the quantification of ROS1 expression, we evaluated the staining intensity and the distribution of stained cells, separately. Cells without staining were scored as 0 points, weak staining intensity was 1 point, moderate staining intensity was 2 points, or strong staining intensity was 3 points. The distribution was scored based on the percentage of stained tumor cells 0% was 0 points, less than 25% was 1 point, 25-50% was 2 points, or more than 50% was 3 points. An overall staining score was obtained by adding the staining intensity and distribution scores. A staining score from 0 points to 2 points was read as negative, and a score from 3 points to 6 points was read as positive.12 For estrogen receptor (ER) status on the nuclear staining pattern, the staining intensity was estimated to be 0 points (negative), 1 point (weak), 2 points (moderate), or 3 points (strong) and the distribution of positive-stained cells was assessed as 0 points (negative), 1 point (<1%), 2 points (1-10%), 3 points (11-33%), 4 points (34-67%), or 5 points (>67%). A staining score was obtained by adding the two estimated scores. A staining score from 0 points to 2 points was read as negative, and a score from 3 to 8 points was read as positive. The degree of HER-2 overexpression on the membrane staining pattern was estimated and scored on a scale of 0, 1+, 2+, or 3+. Tumors with scores of 2+ or greater were considered to be positive for HER-2 expression. The Ki-67 proliferation index was defined as the percentage of positively stained cells in five randomly-selected high power fields.13
Polymerase chain reaction (PCR)
PCR was performed using the 46 fresh IDC tissue samples. The samples were sectioned and washed with phosphate-buffered saline twice. RNA was isolated using the RNeasy Plus Mini Kit (Qiagen, Hilden, Germany), and the RNA concentration was measured at 260 and 280 nm using a spectrophotometer (Bio-Rad, Hercules, CA, USA). cDNA was synthesized from the extracted RNA using the Quantitect reverse transcription kit (Qiagen, Hilden, Germany). Less than 1 µg RNA was mixed with 2 µL 7×gDNA Wipeout buffer, and incubated at 42℃ for 2 minutes. Then, 1 µL Quantiscript Reverse Transcriptase, 4 µL 5×Quantiscript RT buffer, and 1 µL RT primer mix were added. The mixture was incubated at 42℃ for 30 minutes and 95℃ for 3 minutes. The cDNA was used as template for PCR.
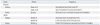
The PCR reaction mixture contained 400 ng cDNA, 5 µL 2×QuantiTect probe PCR master mix (Qiagen, Hilden, Germany), 10 pmol primer, and 30 pmol probe. PCR was performed using the RotorGene real-time Q-PCR system (Corbett, Sydney, Australia). The PCR conditions included a HotStarTaq polymerase activation step. There was an initial incubation at 95℃ for 15 minutes, followed by 50 cycles of denaturation at 94℃ for 15 seconds, annealing at 60℃ for 1 minute, and extension at 72℃ for 30 seconds. All mRNA concentrations were calculated relative to β-actin as an internal control. The primer and probe sequences are listed in Table 1.
Statistical analysis
ROS1 protein expression was compared with histologic grade, tubule formation, nuclear pleomorphism, mitotic counts, tumor size, lymph node status, ER status, and HER-2 using the χ2 test. The relationship between ROS1 expression and the Ki-67 proliferation index was analyzed by univariate logistic regression. The ROS1 mRNA concentration was compared with significant prognostic factors that were confirmed by immunohistochemical staining, using independent Kruskal-Wallis analysis and the Mann-Whitney U test as non-parametric methods. Survival rates were analyzed using the Kaplan-Meier method and verified by the log-rank (Mantel-Cox) test. All results with p-values less than 0.05 were considered to be statistically significant. All statistical analyses were performed using PASW statistics version 18.0 (SPSS Inc., Chicago, IL, USA).
RESULTS
Clinicopathological findings
All cases were female with a mean age of 50.9±12.2 years (range: 23-82 years). Fifty-one cases (24.6%) had a histologic grade 1, 81 (39.9%) were grade 2, and 72 (35.5%) were grade 3. Eight cases (3.9%) had a tubule formation score of 1, 80 (39.4%) had a score of 2, and 115 (56.7%) had a score of 3. Fourteen cases (6.9%) had a nuclear pleomorphism score of 1, 113 (55.7%) had a score of 2, and 76 (37.4%) had a score of 3. Eighty-four cases (41.4%) had fewer than 10 mitotic cells/10 high power fields (HPF), 56 (27.6%) had 10 to 20, and 63 (31.0%) had 20 or more. Eighty-five tumors (42.1%) were 2 cm or smaller and 117 (57.9%) were larger than 2 cm. Eighty-eight cases (44.0%) had metastatic lymph nodes and 112 (56.0%) did not. Eighty-four cases (41.4%) were ER negative and 119 (58.6%) were ER positive. Fifty-seven cases (28.1%) were HER-2 positive and 146 (71.9%) were HER-2 negative. The mean Ki-67 proliferation index was 36.5±27.6%.
Immunohistochemical stains
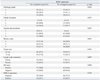
The membrane and cytoplasm of epithelial cells were stained with ROS1 (Fig. 1B). Fifteen cases of histologic grade 1 (16.7%), 37 cases of grade 2 (41.1%), and 38 cases of grade 3 (42.2%) were ROS1 negative. Thus, a lower ROS1 expression was significantly related to a higher histologic grade (p=0.029). Four cases of tubule formation score 1 (3.6%), 44 cases of score 2 (40.0%), and 62 cases of score 3 (56.4%) were ROS1 positive. This was not statistically significant. ROS1 was positive in 10 cases of nuclear pleomorphism score 1 (9.1%), 67 cases of score 2 (60.9%), and 33 cases of score 3 (30.0%), which was not statistically significant. ROS1 was positive in 57 cases with fewer than 10 mitoses/10 HPF (score 1) (51.8%), 28 cases with 10 to 20 (score 2) (25.5%), and 25 cases with more than 20 (score 3) (22.7%); thus, the lower ROS1 expression was significantly related to the higher mitotic count (p=0.003). ROS1 was positive in 46 cases with a tumor 2 cm or smaller (42.2%) and 63 cases with a tumor larger than 2 cm (57.8%), which was not statistically significant. For lymph node status, ROS1 was negative in 57 cases without metastasis (63.3%) and 33 cases with (36.7%); thus, ROS1 expression was significantly lower when lymph node metastasis was absent (p=0.047). ROS1 was expressed in 77 ER positive cases (70.0%) and 33 ER negative cases (30.0%); thus, ROS1 expression was enhanced significantly with ER expression (p=0.000). ROS1 was positive in 78 HER-2 negative cases (70.9%) and 32 HER-2 positive cases (29.1%), but the difference was not statistically significant (Table 2). By logistic regression analysis, ROS1 expression was reduced significantly as the Ki-67 proliferation index increased (p=0.005) (Table 3).
Survival analysis
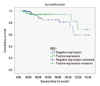
Survival analysis was conducted using the Kaplan-Meier method. There was a slight difference in survival between cases with ROS1 expression and cases without ROS1 expression; however, the difference was not statistically significant (p=0.335) (Fig. 2).
Real-time PCR
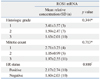
PCR was performed on the 46 available fresh tissue samples. The mean relative concentration of ROS1 mRNA was 3.41±3.57, 1.59±2.47, and 1.63±2.01 in the cases of histologic grades 1, 2, and 3, respectively. The relative concentration of ROS1 mRNA decreased as the histologic grade increased, but this trend was not statistically significant. The mean relative concentration was 2.71±3.23, 1.05±0.99, and 1.97±2.55 in cases with 10, 10 to 20, and more than 20 mitoses/10 HPF, respectively. The relative concentration of ROS1 mRNA decreased as mitoses increased, but this trend was not statistically significant. The relative concentration of ROS1 mRNA was 2.17±2.74 in cases with ER expression and 1.60±2.03 in cases without ER expression, which was not statistically significant (Table 4).
DISCUSSION
ROS1 is an oncogene expressed primarily in malignant brain tumors, glioblastomas, as well as in benign meningiomas, although the expression rate is lower in the latter.1,5 Besides central nervous system tumors, a recent animal study reported that ROS1 was associated with stomach cancer in rats, and that ROS1 expression was increased in a rat hepatoma cell line.3,7 At the time that ROS1 cDNA was first described from a human glioblastoma cell line, it was assumed that mutations or rearrangement of ROS1 might activate the oncogenic potential of the ROS1 gene product, which in turn would contribute to malignant progression.1,14 Since benign tumors of the meninges and breast express ROS1, which is similar to malignant tumors,4,5 we proposed that ROS1 could influence the tumorigenesis of both benign and malignant tumors, and that ROS1 expression may be associated with early changes in the tumor progression pathway. As a result, it can be concluded that ROS1 expression is possibly related to the development of malignant tumors.
Tyrosine kinase functions as a key regulator of normal cellular physiology and is also involved in the development and progression of human cancers.15 ROS1 encodes a kind of transmembrane protein with tyrosine kinase. The most common mechanisms of tyrosine kinase activation in cancers are genomic rearrangement exemplified by gene amplification, chromosomal translocations, inversions, or deletions. Many of these genomic aberrations have been shown to result in the formation of abnormal fusion proteins with malignant transformation activity.16 Aberrant changes in such a gene usually result in the production of the encoded kinases in abnormally high levels, leading to uncontrolled cell proliferation. In human glioblastoma, deletion at 6q21 results in the fusion of fused in glioblastoma (FIG), a gene coding for Golgi apparatus-associated protein, to the kinase domain of the oncogene c-ROS. The fused protein product FIG-ROS is a potent oncoprotein with constitutive tyrosine kinase activity.15,16 Recently, it has been reported that ROS1 rearrangement and ROS1 fusion proteins were observed in human lung cancer and cholangiocarcinomas and that they might be associated with the development of these tumors.17-19 Studies on ROS1 expression in humans, however, are rare. Furthermore, to our knowledge, no studies have investigated ROS1 expression in breast cancer to date.
IDC is the most common breast cancer, and accounts for 70-80% of all malignant carcinomas in the breast.20,21 According to the WHO classification of tumors, classical prognostic factors such as histologic grade, tumor size, lymph node status, and vascular invasion are important.10 Additionally, invasiveness, distant metastasis, locally advanced disease, the presence of inflammatory carcinoma, hormone receptor and HER-2 status, lymphovascular invasion, and proliferative rate are important.21 In 1957, Bloom and Richardson22 introduced a simple and systematic histologic grading system, which is currently recognized as a powerful prognostic factor, and is recommended to be included in pathologic reports by the WHO classification of tumors.10 The most commonly used modified histologic grading considers tubule formation, nuclear pleomorphism, and mitotic count, with each score summed to generate a histologic grade from 1 to 3.9 Among the components of this histologic grade, it has been reported that mitotic count is an important independent prognostic factor, and cell proliferation rate, including the Ki-67 proliferation index, is one significant prognostic factor for both resected specimens and small biopsy tissues.23-26
In the current study, ROS1 expression was significantly lower in patients with higher histologic grade, higher mitotic count, and ER negative status, which are important prognostic factors, as described previously. Therefore, we can propose that higher ROS1 expression may be associated with better prognosis. In addition, logistic regression analysis revealed a clear correlation between ROS1 expression and the Ki-67 proliferation index. This suggests that ROS1 expression is more closely associated with indicators of cell proliferation, such as mitotic count, one of the important prognostic factors previously described. The results of real-time PCR showed that ROS1 mRNA expression decreased in the subjects with an increased histologic grade, increased mitotic count, or decreased ER expression. These relationships were not statistically significant. By Kaplan-Meier analysis, ROS1 expression was not associated with the survival rate. On the other hand, higher ROS1 expression was significantly associated with positive lymph node status. This was the opposite of the results of our study, as previously described. It is difficult to explain this discrepancy clearly here. However, the results of this study showed consistent data among the proliferation rate, histologic grade, and ER status, and ROS1 expression. Therefore, we can conclude that ROS1 expression may be associated with favorable behavior. Further studies with a larger number of cases are required to elucidate this discrepancy.
Recently, tyrosine kinase signaling events on cholangiocarcinoma using a proteonomic approach were surveyed and revealed aberrant ROS kinase expression-for example, fusion proteins, in 8.7% of cholangiocarcinoma patients. These events suggest that inhibition of tyrosine kinase activity of ROS may induce growth inhibition and cell death.17 In addition, ROS1 rearrangements in non-small cell lung carcinoma, using ROS1 fluorescent in situ hybridization assay, were recently reported. They found that patients with ROS1 rearrangement were significantly younger and more likely to be never-smokers, and that all of the ROS1-rearranged tumors were adenocarcinomas with a tendency toward higher grades.19 These studies concluded that ROS fusion or ROS1 rearrangement can play an oncogenic role in cholangiocarcinoma and lung cancer. The results of this study were the opposite of the results of the two previously cited studies. Several aberrant genomic changes in the ROS1 oncogene are needed for it to function as an active oncogene, as previously described. The function of ROS1 without any aberrant genomic change in tumorigenesis and the prognostic value of ROS1 itself in tumors have been not established to date, even though it was demonstrated that ROS1 was expressed in various tumors including glioblastoma. The function of the encoded protein in tumors from the gene with aberrant genetic change may be different from the function of the original gene or protein. Further studies are required to elucidate the exact function of ROS1 in various human tumors.
Most of the reported studies, previously cited, investigated aberrant changes in ROS1 genes or proteins in human tumors, not the ROS1 gene or protein itself. There is no study in which the ROS1 gene and protein was examined in breast cancer or in which its expression was compared with the clinicopathologic parameters or survival rate in any organ. To date, this is the first and only study to show that the ROS1 gene and ROS1 protein were expressed in IDC and that these expressions were associated with several well-established prognostic factors. Several recent studies of lung cancer and cholangiocarcinoma have reported that a novel targeted therapeutic agent, such as multitargeted tyrosine kinase inhibitor, could be effective for the cases with ROS1 rearrangement or ROS1 fusion.17,19,27,28 Further studies about aberrant genomic changes in the ROS1 gene in IDC are warranted to apply multitargeted tyrosine kinase inhibitor therapy for IDC in the future.
In this study, we first investigated ROS1 tyrosine kinase and ROS1 gene expression in IDC and demonstrated the correlation between ROS1 expression and the well-established prognostic factors of IDC. Higher ROS1 expression is likely to be associated with better prognosis in IDC, its expression is related to cell proliferation in IDC, and ROS1 expression is a promising candidate for a therapeutic target in IDC in the future.


 XML Download