

 PDF
PDF ePub
ePub Citation
 Print
Print


INTRODUCTION
Positron emission tomography (PET) provides important insights into the functional integrity and activity of neural systems, and is a sensitive, minimally invasive method for measuring brain metabolism. PET can detect underlying epileptogenic areas along with magnetic resonance imaging (MRI), ictal/interictal single photon emission computed tomography and electroencephalography (EEG).1,2 PET is also useful in localizing epileptogenic areas and establishing surgical margins in patients with temporal lobe epilepsy who do not present with discernible MRI findings.3,4 In particular, newly developed PET and MRI coregistration can help to delineate surgical resection margins correlated with structural anatomy and improve surgical outcomes in discernible MRI findings.5 Generally, 2-deoxy-2-[18F] fluoro-D-glucose (FDG)-PET taken during the interictal period shows decreased glucose metabolism in epileptogenic areas. Hypermetabolism is evident in FDG-PET during ictal periods.6,7 However, PET has a limitation of a less spatial relationship and false lateralization. In other words, FDG uptake includes a larger area than the epileptogenic area, which varies according to the intensity, duration, migration and timing of ictal events during an ictal period.8,9 FDG uptake can be occasionally influenced by interictal cortical activity, such as frequent spike activities or focal polymorphic slow waves.10-12 These symptoms are common in children with epilepsy. For these reasons, PET without corroborating EEG findings might misidentify the underlying epileptogenic area. Thus, the objective of our study was to demonstrate the association between EEG features and glucose metabolism in childhood partial epilepsy. We analyzed concordance between the degree of epileptiform discharges, focal polymorphic slow waves, as well as the presence of ictal events and localization of abnormal FDG uptake.
MATERIALS AND METHODS
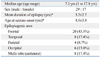
We retrospectively studied 46 patients (age range, 1-17.8 years; median, 7.3 years) with intractable childhood partial epilepsy who had received PET scans with simultaneous EEG and MRI to detect epileptogenic areas. The main epileptogenic region was the frontal area in 43.5% of the patients (Table 1). Twenty two patients exhibited a nonlesional MRI, 11 patients cortical dysplasia, four patients mesial temporal sclerosis, four patients periventricular leukomalacia, four patients tumor and one patient an infarct. The main epileptogenic focus of nonlesional MRIs was also the frontal area in 50.0% of the patients. Patients with EEG-evidenced bilateral synchrony, multifocal epileptogenic area or Rasmussen encephalitis were excluded.
The EEG was performed during the 20 minutes before the FDG tracer injection and continued for more than 20 minutes to clearly discern the ictal and interictal phases. Ictal manifestation, motion artifacts and other specifics were recorded during monitoring. The interictal EEG was represented by the frequencies of spike/sharp waves and the severity of focal polymorphic slow waves. The frequency of spike/sharp waves was classified into four categories: frequent (≥10 spikes/minute), occasional (<10 but ≥1 spikes/minute), rare (<1 spike/minute) and none. This categorization was similar to that used by Asano, et al.13 The severity of focal polymorphic slow waves was classified into none, infrequent (one discrete episode defined as regional slowing during a 10-second epoch or less per hour), intermediate (more than one episode per hour) or continuous, similar to the classification used by Erbayat Altay, et al.12 For ictal EEG, in which ictal events were present during FDG uptake, duration, frequency of ictal events, the time of ictal onset after FDG administration and location were recorded. Based on EEG findings, each epileptogenic region was matched to the frontal, temporal, parietal or occipital area according to the location of the abnormal PET findings.
PET data were obtained using a GE Advanced PET system (General Electric Medical Systems, Milwaukee, WI, USA). After fasting for at least 6 hours, patients received an intravenous injection of FDG (0.145 mCi/kg), followed by an uptake period of 40 minutes in a quiet, dark room. Fifteen minutes were allowed for emission, followed by 8 minutes for transmission. Axial, sagittal and coronal images were obtained and visualized in a three-dimensional mode. Two experienced nuclear medicine physicians, masked to the clinical and EEG findings of each patient, interpreted the PET findings. The two physicians agreed upon the localization of the FDG signal in all patients.
Eight of the 46 patients who had intractable epilepsy with suspected epileptogenic area, underwent curative surgery, with postoperative follow-up durations of 18-28 months. Simultaneous EEG recordings during PET were also compared with MRI, video/EEG and the histopathological diagnosis of the resected brain cortex.
All data were analyzed by logistic regression and Fisher's exact test. SAS version 8.2 software (SAS Institute, Cary, NC, USA) was used for analyses. For all analyses, p-values <0.05 were considered statistically significant. Factors such as spike/sharp waves and focal polymorphic slow waves did not influence each other, as shown by a multiple logistic regression.
RESULTS
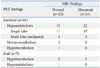
Forty three patients showed an abnormal pattern of glucose metabolism, except for three patients with normo-metabolism. Abnormal patterns of glucose metabolism accompanied nonlesional MRI in 19 patients and lesional MRI in 24 patients. Interictal PET showed hypometabolism in 37 of 41 patients, whereas ictal PET revealed hypermetabolism in four out of five patients (Table 2). Whether or not patients presented with lesional MRI did not influence the concordance between simultaneous EEG and PET.
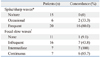
The locations of spike/sharp waves according to their frequency were closely correlated with the abnormal areas on PET with an odds ratio of 1.35. Especially, a high frequency of interictal spikes/sharps (>10 per minute) was well correlated with PET hypometabolism. However, one patient exhibited more than 60 spike wave discharges per minute on EEG and showed an increase in glucose metabolism in the right temporal area despite interictal PET. The locations of focal polymorphic slow waves according to their severity were correlated with the area of hypometabolism with an odds ratio of 1.81 (Table 3). We also analyzed concordance between spike/sharp waves or focal polymorphic slow waves and hypometabolism at each location in p-values.
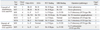
Five patients including two with subclinical ictal events experienced ictal events during FDG uptake (Table 4). Four patients who experienced seizures that lasted more than 20 seconds showed hypermetabolism in a suspected epileptogenic area concordant with the ictal location. One patient with subclinical seizures that occurred several times, but were shorter than 20 seconds each, showed hypometabolism in the discordant area.
Of the eight patients who underwent surgical excision of their epileptic focus, six showed concordance between PET and simultaneous EEG findings, whereas two showed discordance (Table 5). All patients showed the surgical outcome of Engle class I during follow-up duration and cortical dysplasia was most common in their histopathology. Video/EEG, PET and simultaneous EEG were helpful in detecting the epileptogenic area in two patients whose MRI showed negative findings among six patients with concordance of simultaneous EEG and PET findings. One patient showed right frontal hypermetabolism due to recurrent ictal events. In the two discordant patients, one was not exactly discordant, but rather inconclusive. In this patient the EEG performed during PET was normal, but the data provided by the video/EEG were concordant with the PET findings. Another showed an epileptogenic area in the left frontal area on the simultaneous EEG, video/EEG and MRI, but hypometabolism in the right occipital area on PET.
DISCUSSION
Several factors such as interictal spike/sharp, focal polymorphic slow waves as well as the characteristics of the ictal event and subclinical seizures can influence metabolism during PET. We found that a higher frequency of interictal spikes and severity of focal polymorphic slow waves were concordant with the epileptogenic area between simultaneous EEG and PET in childhood partial epilepsy. We also identified the utility of EEG to reduce instances of false lateralization in PET readings using simultaneous EEG. These findings were also confirmed by pathological diagnosis of the surgical cases.
Interictal spikes according to frequency can cause glucose metabolism to change transiently in the epileptogenic region. In this study, areas of increase in the frequency of interictal spikes were well correlated with hypometabolism on PET, when compared to those of lower frequency. That is, 70.7% of all spikes in the anterior temporal area matched PET findings in temporal lobe epilepsy.14,15 Previously, PET localization using α-[11C]-Methyl-L-tryptophan was proven with interictal spike frequency in tuberous sclerosis.15 However, a higher frequency of interictal spikes can result in a loss of PET coherence to the EEG features due to increases in neuronal activity requiring increased glucose metabolism. As shown in previous studies, a higher frequency of interictal spike results in synchronization, and the neuronal circuitry in the surrounding area shows paroxysmal burst firing patterns.8,10,11 Moreover, interictal spikes at frequencies higher than 12 to 22 per minute reportedly exhibit increased metabolism in the affected areas.10 Our data showed a high association between the epileptogenic region of interictal spike/sharp categorized by frequency on simultaneous EEG and the localization of PET individually, especially in those with a high frequency of interictal spikes/sharps (>10 per minute). Interestingly, one patient with more than 60 spike wave discharges per minute showed hypermetabolism instead of hypometabolism in suspected epileptogenic areas, representing a metabolic change according to the frequency of interictal spikes. We cautiously argue that epileptogenic areas with a high frequency of interictal spikes/sharps (>10 per minute) might result in hypometabolism, but those with more than 60 spikes wave discharges per minute may result in hypermetabolism instead of hypometabolism.
Focal polymorphic slow waves, which suggest a possibility of structural abnormalities, can also cause glucose metabolism to decrease in the epileptogenic area. The concordance between focal polymorphic slow waves and PET hypometabolism may be related to a similar electrical condition which is associated with primary epileptogenic abnormality and a functional deficit of metabolism.12,16 In other words, PET as well as focal polymorphic slow waves can detect epileptogenic areas with a functional deficit, although the structural lesions of epileptogenic areas are not detected by MRI due to invisible structural minimal changes such as focal cortical dysplasia type I.17 Our data showed that focal polymorphic slow waves were particularly useful for localizing the underlying cortical dysfunction, which might be correlated with epileptogenic areas in childhood partial epilepsy, including patients with nonlesional MRI. In the present study, we became concerned with whether the localized epileptogenic area represented by interictal spikes and focal polymorphic slow waves was a seizure focus or not. However, previous reports have indicated that the location of the epileptogenic area in EEG closely matched the foci of hypometabolism on PET, and the area of ictal onset and propagation in surgical cases showed slight hypometabolism in PET/MRI coregistration.12,14,16,18,19
Generally, PET with ictal event shows mixed interictal, ictal and postictal metabolism. Sometimes, ictal FDG uptake in the epileptogenic region can show hypermetabolism not only in the epileptogenic region, but also the striatum, thalamus, ipsilateral cerebral hemisphere and contralateral cerebellum, because of persistent depolarization during ictal EEG activity. These findings provide valuable information about the lateralization and localization of pathologic lesions.9,20-22 PET findings with ictal events may be influenced by several ictal factors such as the presence of subclinical electrographic activity and the frequency or duration of ictal events. Four of our patients, who experienced clinical or subclinical seizures during the period of FDG uptake, showed positive ictal hypermetabolism in the affected areas on PET. Four patients with ictal hypermetabolism had higher spike frequency on simultaneous EEG during PET, while one patient with hypometabolism had low spike frequency. Higher spike frequency may influence paroxysmal burst firing patterns with ictal events and result in hypermetabolism instead of hypometabolism. Two of our patients' findings may also be related to recurrent seizures rather than a single seizure that lasted longer than 20 seconds during uptake.21 We encountered one patient who experienced an electrographic seizure that lasted for less than 20 seconds and in whom a low spike frequency was observed in the interictal period. The EEG results for this patient were not correlated with the PET findings, suggesting false lateralization.
Among 6 patients with concordance of EEG and PET findings who underwent surgical treatment, one patient with recurrent ictal events longer than 20 seconds showed right frontal hypermetabolism, which was confirmed by histopathologic findings of cortical dysplasia on the right frontal area, and who was classified as Engel class I (seizure free) after surgery. One discordant patient with right occipital hypometabolism confirmed by histopathological diagnosis underwent left frontal corticectomy, suggestive of false lateralization, and was also classified as Engel class I after surgery. Just as simultaneous EEG allows us to detect false lateralization on PET, PET/MRI coregistration makes it possible for us to detect epileptogenic areas that cannot be visually indentified on PET, as well as improve the detection of cortical dysplasia and surgical prognoses in patients with epilepsy.5,19
In conclusion, simultaneous EEG can be used to confirm epileptogenic areas and minimize false lateralization in PET, which may show inconsistent abnormal metabolism related to the frequency of interictal spikes, focal polymorphic slow waves, or several factors associated with ictal events.8,21,23 Simultaneous EEG recording during PET can help detect underlying epileptogenic areas via review of various factors from EEG features during FDG uptake.

 XML Download