

 PDF
PDF ePub
ePub Citation
 Print
Print


INTRODUCTION
Over the last three decades, severity-of-illness scoring systems, such as the Acute Physiology and Chronic Health Evaluation (APACHE) Score and the Simplified Acute Physiology Score, have been developed to predict hospital mortality of intensive care unit (ICU) patients.1-5 As with other types of prediction scores, these scores must be externally validated when there is a reason to believe that the intended population may constitute a patient mix different from the derivation cohort. In addition, to accurately predict mortality over prolonged periods, such scores should periodically be updated to reflect changes in medical practice and patient mix over time.6
Although APACHE II is one of the most widely used prediction models in Korea, the performance of the APACHE II model has not yet been validated in a Korean ICU sample, and has not been updated for Korean patients since its development in 1985.1 Therefore, the aim of this study was to perform an external validation of the APACHE II by evaluating its performance in a large representative database of Korean ICU patients.
MATERIALS AND METHODS
Patients
This study is an analysis of prospectively collected database for The Fever and Antipyretics in Critical Illness Evaluation (FACE) cohort.7 The FACE study was a prospective observational study of the influence of fever and antipyretic treatment on the outcomes of ICU patients in 25 hospitals-15 in Japan and 10 in Korea-that was conducted by the Japan-Korea Intensive Care Study group between September 1 and November 30, 2009. The current study used only data from the Korean centers. Inclusion criteria for the FACE study were all patients who were admitted to the participating ICUs for more than 24 hrs. Exclusion criteria for the FACE study were patients less than 18 years of age and with brain damage. For this study, data from one center that recruited only two patients were excluded to reduce selection bias. The study was approved by the Institutional Review Board, and the requirement for informed consent was waived.
Data collection
The following variables were recorded: 1) general characteristics including age, gender, pre-existing underlying disease, reason for ICU admission, and admission status (medical or surgical patients); 2) severity of illness as assessed by the APACHE II score; and 3) interventions including need for mechanical ventilation and continuous renal replacement therapy (CRRT). The worst data from the first 24 hours after admission to the ICU was used to calculate the APACHE II score. Hospital mortality was adjusted for the principal diagnostic category which led to ICU admission. The equation used to predict the risk (R) of hospital death was: ln (R/1-R)=-3.517+(APACHE II score×0.146)+(0.603, if only post-emergency surgery)+(diagnostic category weight).1
Statistical analysis
For statistical analysis, PASW 17.0 (SPSS Inc., Chicago, IL, USA) and STATA 11.0 (StataCorp LP, TX, USA) were used. Data are shown as medians and interquartile ranges or numbers with percentages. A univariate logistic regression analysis was performed to examine any associations between various risk factors and hospital mortality. Among the variables used in this model, the risk factors with a p-value less than 0.25, including age and gender, were selected for multivariate logistic regression analysis. Validation of the scoring system was performed using standard tests to measure calibration and discrimination. Calibration was defined as agreement between individual probabilities and actual outcomes. The Hosmer-Lemeshow goodness-of-fit (GOF) H statistic and GOF C statistic were used to evaluate agreement between observed and predicted mortality rates.8 In the Hosmer-Lemeshow GOF test, a p-value greater than 0.05 was interpreted as being well calibrated.8 The standardized mortality ratio (SMR) was calculated by dividing the number of observed deaths per group by the number of expected deaths per group. To test for statistical significance, we calculated 95% confidence intervals (CI) according to the method described by Hosmer and Lemeshow. Discrimination was defined as the power to distinguish between non-survivors and survivors, and was assessed by calculating the area under the receiver operating characteristic (aROC) curve as described by Hanley and McNeil.6,9 The level of discrimination was defined by the level of aROC. An aROC greater than 0.9 was defined as excellent discrimination, 0.8≤aROC<0.9 as good discrimination, and 0.7≤aROC<0.8 as modest discrimination.6,9 A predicted mortality of 50% was used to calculate the sensitivity and specificity of the APACHE II in predicting hospital mortality.10
Two-tailed p<0.05 was considered statistically significant.
RESULTS
Baseline characteristics and outcomes of patients
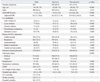
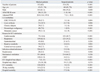
Of 1426 patients enrolled in the FACE study, 600 patients were excluded, therefore, data of 826 patients were used in the analysis. The baseline characteristics and outcomes of the patients are shown in Table 1. Overall hospital mortality was 19.5% (161 out of 826 patients). The patients who died were significantly older, and had higher APACHE II scores, and greater numbers of co-morbidities. They had ICU admissions related to either cardiovascular and respiratory problems, and were more likely to be medical patients and to have more interventions such as mechanical ventilation or CRRT (Table 1).
Medical patients were significantly older, and had higher APACHE II scores, and more co-morbidities. Furthermore, they were more likely to have admissions related to major organ system failures, and had more patients on CRRT (Table 2). Hospital mortality of medical patients was 28.1%, which was significantly higher than 5.4% of surgical patients (p<0.001).
Risk factors for hospital mortality of Korean ICU patients
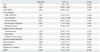
The multivariate logistic regression model was used to determine independent risk factors of hospital mortality by using all variables with a p-value <0.25 in the univariate model. Among the variables used in the model, age (OR=1.035, p<0.001, 95% CI=1.019-1.051), liver cirrhosis (OR=5.328, p<0.001, CI=2.745-10.342), hematologic malignancy (OR=3.985, p=0.001, CI=1.776-8.943), medical patients (OR=3.446, p<0.001, CI=1.768-6.717), mechanical ventilation (OR=2.001, p=0.007, CI=1.204-3.325) and CRRT (OR=4.008, p<0.001, CI=2.315-6.942) were associated independently with hospital mortality (Table 3).
Performance assessment of APACHE II in Korean ICUs
Calibration and discrimination data are presented in Table 4. Overall, discrepancy between observed and expected mortalities across all of the strata was demonstrated as a Hosmer-Lemeshow GOF H of 57.54 (p<0.0001) and a Hosmer-Lemeshow GOF C of 55.99 (p<0.0001). The SMR of the APACHE II model was 0.76 (95% CI 0.62-0.85). The overall discriminatory capability of the APACHE II model was modest (aROC=0.729). Using 50% of predicted mortality as the cut-off, the sensitivity and specificity of the APACHE II for hospital mortality were found to be 36.6% and 87.4%, respectively.
The GOF values according to surgical status are listed in Table 4. Calibrations of the APACHE II were poor among both medical and surgical patients (H=63.56, p<0.0001, C=73.83, p<0.0001, and H=33.92, p<0.0001, C=33.34, p=0.0001, respectively). The discrimination of APACHE II of the medical patients was poor (aROC=0.651, 95% CI=0.69-0.97), whereas the discrimination of the surgical patients was modest (aROC=0.704, 95% CI=0.2-0.59).
DISCUSSION
The present study demonstrated that APACHE II had poor calibration and modest discrimination among critically ill Korean patients. The APACHE II also exhibited poor calibration and poor to modest discrimination in groups divided according to surgical status at ICU admission. At the predicted risk of 50%, the APACHE II had a sensitivity and specificity of 36.6% and 87.4% for hospital mortality, respectively.
Developed in 1985 using a database of North American ICU patients, the APACHE II uses the most extreme values of 12 physiological variables 24 hours after admission to ICU, chronic health status, age, and the Glasgow coma scale to calculate a score.1 Hospital mortality is predicted using the APACHE II score, principal diagnostic category which had to ICU admission, and also depending on whether or not the patient required emergency surgery.1 In the original article, no goodness-of-fit testing was reported for calibration, and the aROC for the APACHE II was 0.863.1
External validation is essential before routine application of any model to a group of subjects that is different from the group originally used for model development.11 Although the APACHE II has extensively been validated in different regions of the world, it has never been validated in critically ill East Asian patients. It is popular in Korea because of its ease of use and availability, and is often used as a tool to assess severity of illness and to predict mortality of Korean ICU patients.
To our knowledge, this is the first study which attempted to validate the APACHE II score in a large, multicenter, prospectively collected database in East Asia. In this study, the performance of the APACHE II was poor not only in general ICU patients, but also in patients group divided according to surgical status. The results of this study are consistent with studies conducted in other regions of the world that have attempted to validate the APACHE II at various times. Most of the studies published since 1996 showed that the APACHE II had modest to good discrimination and poor calibration in general ICUs.12-14 The only exception was found in a study conducted prospectively at a single center in Italy from 1994 to 1997.15 The study sample consisted mainly of surgical patients, and patients with ICU length of stays <24 hr were excluded. Furthermore, studies performed with both medical and surgical patients, using the APACHE II, show poor predictive power for predicting hospital mortality.16,17
There are several reasons for the limited usefulness of the APACHE II score in predicting mortality for critically ill Korean patients today. First, the differences may represent differences between the population from which the original APACHE II sample was derived and current Korean patients. As stated, the APACHE II was developed mainly using patients from North American ICUs who descended from different populations, and have different underlying diseases and different ICU organizational structures from Korean patients. Second, even if the APACHE II had good performance for Koreans in the 1980s when it was developed, it may not be accurate now. Since its development in the 1980s, there have been significant changes in the prevalences of major diseases, diagnostic approaches and therapeutic modalities. For example, therapeutic modalities, such as liver transplantation, CRRT, early goal-directed therapy and low tidal volume ventilation to reduce ventilator-induced lung injury, were not available at that time.1 Prediction models should periodically be updated to reflect the changes in medical practice and case-mix over time.6 Third, the diagnostic category used to adjust for mortality in the APACHE II is vague.1 More and more patients have several concurrent, complex problems, and selecting only one principal diagnostic category may be very difficult. In addition, some patients (e.g., liver transplant recipients) may be grouped with patients with very different prognoses (e.g., elective abdominal surgery) because these kinds of patients were not seen in the ICU at the time when the APACHE II was developed. Fourth, APACHE II includes a lead-time bias. The physiological variables included in any scoring system are all dynamic and can be influenced by multiple factors, including recent and ongoing resuscitation and therapy.18 The interpretation of outcome prediction scores needs to take this potential bias into account, especially with recent increased emphasis on the importance of early resuscitation. The APACHE II is vulnerable to the Boyd and Grounds effect,1,19 which increases the risk of overestimation of predicted mortality. A recently developed scoring system tried to eliminate this effect by using only data collected during the first hour of ICU stay.
In this study, a commonly used cut-off of 50% was used to evaluate the prediction value of the APACHE II for hospital mortality.10 At this cut-off point, the sensitivity and specificity were 36.6% and 87.4%, respectively. Specificity of the APACHE II for hospital mortality in this cohort was lower than that reported by Capuzzo, et al.15 If we treat the APACHE II as a diagnostic test, the cut-off point of the APACHE II for hospital mortality in our study can be calculated by using the Youden index, giving a predicted mortality of 22%.20 At this cut-off point, sensitivity, specificity, positive predictive value and negative predictive value were 73.9%, 63.8%, 33.1% and 91%, respectively.
In this study, although the APACHE II score was found to be associated with hospital mortality in the univariate model, it only showed borderline statistical significance in the multivariate model (p=0.067). This may be due to the fact that components of the APACHE II score include many of the strong outcome predictors of our model, such as age, gender, and comorbidities, although the test for co-linearity did not show significant co-linearity with predicted mortality of the APACHE II for each variable. Another possible reason might be that the APACHE II score is not an accurate predictor of hospital mortality in these days and age in Korean ICU patients, as described above.
One of the limitations of this study is that the data used were drawn from large university hospitals, therefore, the conclusions may not be applicable to patients treated at smaller hospitals in Korea. Also, certain populations that use the ICU (for example, neurosurgery patients or coronary care unit patients), were not represented in this study, thus limiting the applicability of our findings among these patient populations. However, this is the first study that prospectively collected data from nine university-affiliated hospitals and provided a good case-mix of both medical and surgical ICU patients, thus increasing the generalizability of our findings.
In conclusion, the APACHE II prognostic model has poor calibration and modest discriminative power when applied to ICU patients in Korea. Therefore, a new prognostic model that is customized to Korean patients or an updated model is needed.

 XML Download