

 PDF
PDF ePub
ePub Citation
 Print
Print


INTRODUCTION
The accurate measurement of central corneal thickness (CCT) is important in preparing for refractive surgery, monitoring corneal ectasia like keratoconus, complementing intraocular pressure (IOP), calculating the risk of progression from ocular hypertension to glaucoma, and studying corneal endothelial cell function after contact lens use.1-4 CCT is also a consideration when collagen cross-linking treatment is performed for progressive keratoconus.5
Ultrasonic pachymetry (US) is a common technique for measuring CCT, but its reliability is limited by operator's skill level since the US probe needs to be manually placed as close to perpendicular as possible at the center of the cornea. In addition, US requires topical anesthesia, and the probe can compress the surface of the cornea, which may chemically and mechanically change the CCT.6 Therefore, many noncontact instruments have been investigated as alternative methods to US.
Visante optical coherence tomography (OCT), a noncontact method based on low coherence interferometry using a 1310 nm superluminescent diode source, is a user-friendly instrument operated with a joystick and automatic software, and quickly provides high-quality cross-sectional images of the cornea (18 µm axial resolution and 2048 A-scans per second). Furthermore, it is reliable and consistent with US in the measurement of CCT,7,8 and is considered a time-domain OCT instrument because the scan speed is limited by the back-and-forth mechanical movement of a reference mirror over a range of several millimeters.9
In contrast, RTVue, which implements Fourier-domain OCT, simultaneously collects signals from the entire range of interest without any mechanical restraint due to the speed of a reference mirror. Then, it analyzes data using a spectral interferogram and rapid Fourier transform.10 The fast scan speed (26000 A-scans per second) of RTVue can overcome the effects of eye movements during measurement, leading to the possibility of higher resolution (5 µm axial resolution).
There have been several reports regarding measurement reliability or agreement between RTVue and Visante. Both repeatability and reproducibility11 are fundamental to the reliability of an instrument, and reliable accuracy also requires agreement of the instrument with a validated gold standard method. To our best knowledge, a comparative study of RTVue and Visante that includes both repeatability and reproducibility in the same measurement setting has not yet been published.
Therefore, we investigated the complete reliability of RTVue and Visante for CCT measurement using repeatability test, intersession reproducibility test and well-designed statistical analysis. In addition, we introduced a modified US technique, slit-lamp adapted ultrasonic pachymetry (SL-US), to handle the US probe more easily and precisely.
MATERIALS AND METHODS
Subjects
This study was designed to assess normal corneas in compliant volunteers. Therefore, subject exclusion criteria included a history of ocular surgery, recent contact lens use, any eye drop use except artificial tears, pathologic changes of the eyelid, conjunctiva, or cornea upon slit-lamp examination, best corrected visual acuity less than 20/20, intraocular pressure over 21 mm Hg by noncontact tonometer, and an endothelial cell count under 2000/mm2. Volunteers were allowed to take the examination on one or both of their eyes. Corneal thickness was measured using Visante (software version 2.0, Carl Zeiss Meditec Inc., Dublin, CA, USA), RTVue (software version 3.5, Optovue Inc., Fremont, CA, USA), and US (UP-1000, NIDEK Co., Ltd., Gamagori, Japan; ultrasound velocity, 1640 m/s). This study was approved by the Institutional Review Board of Severance Hospital and adhered to the tenets of the Declaration of Helsinki. Informed consent was obtained from all volunteers.
Measurements of central corneal thickness with RTVue, Visante, and SL-US
All measurements were performed from 1 PM to 8 PM after volunteers had been awake for at least one hour, in order to minimize diurnal change and any other ophthalmologic effects from sleep and eye closure. All eye drops were prohibited for 1 hour before measurements. A single physician measured the CCT of all volunteers as follows. First, Visante and RTVue were performed on either one or both eyes of each volunteer. The measuring order of Visante and RTVue was randomized. To minimize tear evaporation, volunteers were asked to blink normally between measurements. A global pachymetry mapping protocol, consisting of eight radial lines centered on the corneal vertex reflection, was selected for Visante. Each line was composed of 128 A-scans, and the entire map was acquired in 0.5 seconds. The center of measurement was manually aligned at the vertex of the cornea with maximized vertex reflection. The system automatically processed scans, and the study used the central 2 mm average corneal thickness calculated by the software. For RTVue, the central 2 mm average corneal thickness was obtained using the cornea-anterior module long lens. The pachymetry mapping protocol was composed of eight radial lines with each line consisting of 1024 A-scans. The acquisition time for the map was about 0.3 seconds. The pupil-centered scan was obtained by aligning the aiming circle at the center of the pupil.
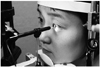
After measurements of Visante and RTVue, the cornea was anesthetized with 0.5% topical proparacaine (Alcaine, Alcon Puerto Rico Inc., Fort Worth, TX, USA), and SL-US was performed. The ultrasound probe was inserted into the mount instead of the Goldmann tonometry tip (Haag-Streit, Bern, Switzerland) (Fig. 1). Subjects were then asked to put their chins and foreheads on the headrest, and the probe was placed at the center of the pupil using the joystick. A single SL-US measurement was obtained.
Repeatability, reproducibility and agreement of RTVue, visante, and SL-US protocols
Our definitions of repeatability and reproducibility were based on the definitions of the British Standards Institution.11 Repeatability is the variability of the measurements obtained by one operator while measuring the same subject on the same set of equipment with the shortest time lapse possible between successive sets of readings. Reproducibility is the variability of the measurement obtained using the same equipment but with one variation in operator or measurement time. As a reliable measure is to measure something consistently, reliability requires good repeatability and reproducibility.12 Reliability is analogous to precision.12 In addition, the accuracy is the closeness of measurements to the true value.13 Therefore, a measurement system can be trusted only when it has both high precision and good accuracy. Every volunteer was asked to visit the clinic three times within 4 weeks and the entire process described above was underwent. However, on the second visit, each measurement was repeated three times to gather repeatability data. To obtain the intersession reproducibility, the first visit value, the first measurement of the second visit, and the third visit value were used. Three successive measurements on the second visit were averaged for each instrument, and agreement among the three instruments was analyzed using Bland-Altman plots.
Statistics
Statistical analysis was performed with PASW (version 18.0.0, SPSS Inc., Chicago, IL, USA). To test repeatability and reproducibility, the repeatability or reproducibility coefficient (Rco), coefficient of variation×100 (CV), and intraclass correlation coefficient (ICC) were calculated. For 95% of pairs of repeated observations, the difference is less than Rco.14 Rco was estimated from three repeated measurements as mentioned in details of statistical calculations section (see below). A smaller CV was interpreted as better repeatability or reproducibility. As the ICC nears 1.000, repeatability or reproducibility approaches perfection.
Agreement among RTVue, Visante, and SL-US was investigated with Bland-Altman plots.15 Three measurements for repeatability determination were averaged, and a paired t-test was used to detect differences between instruments. In the paired t-test, the standard deviation (SD) of the difference was corrected because some of the repeated measurement error had been removed by averaging.16 The averaged measurement and the corrected SD were also used to estimate the limits of agreement (LoAs). 95% of the differences would be expected to lie within the LoAs. Regardless of the p value acquired in the paired t-test, LoAs were regarded as in agreement if they were small enough to be clinically acceptable.
Details of statistical calculations
One-way ANOVA was used to obtain within-subject SD (Sw).14 Sw assumes that the subject SD should be independent of the subject mean. This assumption was checked by plotting the SDs against the means of the individual subject and analyzing with Kendall's tau correlation. In addition, outliers with SDs that were more than three times the box width in a boxplot were excluded. The standard error of the Sw was then determined by Sw/[2n(m-1)]1/2 for n subjects with m observations per subject.17
Rco was defined as 1.96×21/2×Sw.14 CV was calculated via a logarithmic method.18 The CV can be referenced even when the assumption of Sw is not satisfied. 95% confidence intervals (CIs) for Rco and CV were calculated from the standard error of Sw.17 ICC and its 95% CI were computed with PASW software for both the two-way mixed model and absolute agreement type.
RESULTS
Repeatability and reproducibility of RTVue, Visante, and SL-US measurements
Fifty eyes of 30 healthy volunteers (21 men and 9 women) were studied. All subject's measurements were included in statistical verification without any outliers. The subjects had a mean age of 27.0±2.9 (SD) years and a spherical equivalent of -2.94±2.89 (SD) diopters.
Repeatability was compared using Rco, CV, and ICC (Table 1). According to the Rco and CV, RTVue gave higher repeatability than Visante and SL-US. The ICC of RTVue was greater than that of Visante. However, the ICC of RTVue was not larger than that of SL-US as the 95% CIs barely overlapped.
The intersession reproducibility of RTVue was also higher than Visante and SL-US in terms of Rco (Table 2). However, the 95% CIs of the CV for RTVue and SL-UL barely overlapped and the 95% CIs of ICC overlapped for RTVue, Visante, and SL-US as well.
Agreement among RTVue, Visante, and SL-US measurements
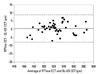
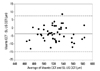
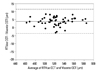
Agreement was assessed with Bland-Altman plots and the LoA. Observations were randomly distributed among LoAs in all three Bland-Altman plots, which ensured that this analysis was reliable (Figs. 2, 3 and 4).
The mean CCT value of RTVue was not significantly different from the SL-US value (p=0.410, paired t-test), with the largest likely difference of 8.8 µm (Table 3) (Fig. 2). Visante gave a thinner CCT than SL-US by 3.6 µm (p<0.001, paired t-test) (Table 3) (Fig. 3), with the largest likely difference of 14.9 µm. RTVue gave a thicker CCT than Visante by 4.1 µm (p<0.001, paired t-test) (Table 3) (Fig. 4), with the largest likely difference of 11.8 µm.
DISCUSSION
RTVue yielded good repeatability and intersession reproducibility in CCT measurements (Table 1 and 2). SL-US showed reliability similar to Visante even without multiple measurements (Table 1 and 2). The CCT of RTVue was expected to be about 10 µm different at most from that of SL-US or Visante (Table 3).
RTVue had higher repeatability and intersession reproducibility than Visante (Table 1 and 2). However, the 95% CIs of ICC for intersession reproducibility barely overlapped and the statistical power of ICC might not be enough to discriminate small differences in reproducibility (Table 2). While Rco and CV are directly derived from the within-subject SD, ICC is conceptualized as the ratio of between-subject variance to total variance, and indirectly reflects the effect of the within-subject SD.19 In addition, fewer repeat numbers require a larger sample size for ICC comparison.19
Repeatability of SL-US was worse than RTVue, but similar to Visante (Table 1 and 2). Usually, several successive US measurements are necessary to obtain reliable individual CCT because a single US measurement can fluctuate.20 For example, the Ocular Hypertension Treatment Study regards the mean of five CCT measurements as adequate,21 and the average of three repeated measurements is suggested to gain a confidence within 10 µm.20 In addition, we could calculate several repeatability coefficients from previous studies using their SDs of the difference between repeated measurements: calculated coefficients were 17.4 µm with a single measurement, 18.0 or 7.1 µm with three measurements, and 1.4 µm with five measurements.22-25 Therefore, a single SL-US measurement was as precise as three repeated measurements of conventional US, but does not necessarily guarantee the best repeatability.
The intersession reproducibility coefficients for RTVue and Visante were about 3 µm greater than their repeatability coefficients, which may mean an indication of diurnal variation in corneal thickness between different sessions (Table 1 and 2). In contrast, the intersession reproducibility of SL-US was not significantly different from its repeatability. We, therefore, postulate that SL-US is less influenced by tear film thickness changes because of its contact on cornea surface during measurements.
Visante gave thinner CCT than RTVue (Table 3) (Fig. 4). The anterior corneal boundary of Visante is automatically delineated slightly below the anterior corneal surface.7 The tear film on the corneal surface may not be demarcated accurately in Visante. Because the possible tear film thickness is 40 µm,26 an erratic measurement in tear film could affect the precision of the CCT measurement.
However, RTVue and Visante measurements were generally in agreement. The largest size of LoA between instruments was 11.8 µm, which is small enough to be allowable in usual clinical practice. For example, Goldmann applanation tonometric IOP (IOPG) is correlated with CCT by 0.02-0.07 mm Hg/CCT (µm).3 An approximately 12 µm CCT measurement error produces only about a 0.5 mm Hg IOPG error. However, Visante and RTVue should not be used interchangeably if more than a 12 µm measurement error is not permissible.
RTVue and Visante were also in clinically allowable agreement with SL-US (Table 3) (Figs. 2 and 3). However, SL-US might measure thicker CCT than conventional US because SL-US allowed careful contact with the probe, which might reduce the applanation force of the ultrasound probe on the cornea surface and prevent the thinning of the tear film and the epithelium. In addition, each CCT was measured by a single probe contact, which minimized the number of touches. However, the mean CCT measurement by Visante was 3.6 µm less than by SL-US, and previous reports have indicated that the measurements by Visante were 7.5 to 16.5 µm less than by conventional US.7,27,28 Therefore, SL-US measurements seemed not to deviate much from conventional US measurements.
Our study design might have produced better repeatability and reproducibility coefficients than expected for the following three reasons; first, we included one or both eyes of young subjects, and good compliance was anticipated. Second, we checked for outliers as explained above, and made sure that there were no outliers. Third, we evaluated repeatability and reproducibility using three, not two, repeated measurements to avoid anomalous within-subject SDs. In spite of these considerations, our results are consistant with previous studies (Table 4). Although one previous study32 reported a significantly larger intersession reproducibility coefficient and LoA for Visante than we observed, this appears to deviate from other study results.
In conclusion, RTVue was very reliable and clinically consistent with Visante and SL-US for measuring CCT. Single touching SL-US' reliability was as good as triple touching conventional US, which could be helpful if an operator intends to avoid multiple corneal touches with the probe or is seeking a more precise way to use US.


 XML Download