

 PDF
PDF ePub
ePub Citation
 Print
Print


INTRODUCTION
Legg-Calvé-Perthes (LCP) disease is a pediatric illness characterized by avascular necrosis in the immature capital femoral epiphysis of the femoral head.1-3 Contrary to avascular necrosis in the femoral head in adults, LCP disease is accompanied by a remodeling procedure during its natural course. During the remodeling process, dead bone is replaced with living bone, and the deformed head can remodel.4-6 In approximately 40% of pediatric patients, even if properly treated, the length of the femoral neck becomes short after the completion of growth, and limping can occur because of the relative overgrowth of the greater trochanter area.2,4
Even if the necrotic femoral head is reduced into the acetabulum socket by surgical or non-surgical treatment, persistent residual deformity occurs quite commonly, which results in a deformed head and subsequent early degenerative arthritis of the hip joint. Ponseti, et al.1 reported cleft formation with amorphous debris in the growth plate accompanying amorphous residue and extravasations. They observed that cartilage cells continued to proliferate while ossification within the cartilage did not occur. This implies that avascular necrosis in LCP disease is not simply limited to the epiphysis of the femoral head, but also simultaneously extends to the growth plate.
Histopathological changes in LCP disease have been investigated by autopsy, and attempts have been made to induce the excessive abduction of the hip joint of piglets. Ligation of the blood vessels in the femoral neck has also been attempted.7 However, these methods artificially block the blood supply to the femoral head and thus induce severe ischemia in the entire femoral head. This can lead to irreversible changes, contradicting the so-called "reversibility" of LCP disease.
In our study, spontaneously hypertensive rats (SHR) were used as an animal model of necrosis of the growth plate; these rats were obtained by inbreeding rats with spontaneous hypertension. These rats are able to develop ischemic changes in femoral heads as well as necrosis in the epiphysis during bone maturation, and heal spontaneously with aging. Approximately 50% of SHRs suffer a spontaneous ischemic insult and subsequent osteonecrosis of the femoral head epiphysis around 6-9 weeks of age.8 Therefore, they have proven to be a good experimental animal model for LCP disease.9,10
We hypothesized that in addition to the epiphysis, the growth plate of the femoral head might be also affected in LCP disease. We investigated pathologic changes within the growth plate of a SHR model using histological methods and cellular kinetics. We also investigated the expression of vascular endothelial growth factor (VEGF) in the growth plate of the femoral head to deduce the etiology of the femoral head in LCP disease.
MATERIALS AND METHODS
Experimental animals
The experimental group comprised 12 SHRs for each of the 6, 9, 12, 15, and 18-week-old groups, for a total of 60 animals. These were complimented by six age-matched Whister Kyoto rats (WKY) in each group, for a total of 30 control group animals. Experimental animals were sacrificed under ether inhalation anesthesia. The femoral head was exposed carefully and the head was extracted from the femoral neck by osteotomy using the Smith-Peterson approach. The extracted tissues were fixed in 4% paraformaldehyde, decalcified for 2 weeks in 10% ethylenediaminetetracetic acid solution, and embedded in paraffin by a conventional method. Four µmm-thick sections centered on the ligamentum teres attachment area were cut in the coronal plane, and were fixed using silane coating slides. Then, they were stained with hematoxylin and eosin, and examined under a light microscope. Osteonecrosis was observed in 32 (53%) of the SHRs, and there were 5-7 rats in each of the age groups, respectively. The cases showing growth impairment and necrosis in the epiphysis were assigned to the SHR+n group, and the cases showing normal ossification were assigned to the SHR-n group.
Histomorphological measurements
The length of the entire growth plate and the length of the resting zone, the proliferation zone, and the hypertrophic zone were measured separately using the ImagePro® program. For all histological examinations, four areas were selected from an identical region of the growth plate where necrosis in the epiphysis was detected. The entire length of these areas was measured vertically (Fig. 1).
BrdU immunohistochemistry
5-bromo-2'-deoxyuridin (BrdU) was thawed in phosphate buffered saline (PBS) and injected peritoneally (100 mg/kg) into experimental animals twice, at 25 hours and 1 hour prior to their sacrifice. The slides prepared by a conventional method were treated three times with xylen for 10 minutes, and for rehydration, the samples were washed with 100, 90, 70% ethanol and double distilled water sequentially. Endogenous tissue peroxidase was inactivated with 3% hydrogen peroxide (H2O2), and tissues were treated with 0.4% pepsin for 20 minutes. The samples were denatured with 2N HCl for 30 minutes, and 20% goat serum was added to the samples, followed by BrdU primary antibody (SIGMA, St. Louis, MO, USA) at room temperature for 12 hours. Immunohistochemical staining was performed by applying Avidin-biotin (mouse IgG, extra avidin method), and the samples were then washed with PBS, stained with D 3,3'-diaminobenzidine (DAB), and counter-stained with Mayer's hematoxylin. To count the number of BrdU positive-staining cells, three areas of each slide were selected randomly, and the number of total cells and the number of stained cells in a rectangle of 150×250 µm in size were assessed. The ratio of positive cells in each zone of the growth plate was calculated as the number of positive cells to the total number of cells.
TUNEL assay
Each tissue slide was pre-treated in Tris-HCl solution (pH 8.0) for 10 minutes and treated with proteinase K for 20 minutes. After washing with PBS, endogenous tissue peroxidase was inactivated with 3% H2O2, and the samples were washed again with PBS. The positive control group for immunohistochemical examination was pre-treated with DNA buffer for 10 minutes and DNA was fragmented artificially by addition of DNase I for 20 minutes. The samples were pre-treated with transferase-mediated deoxyuridin triphosphate buffer (TdT, SIGMA, St. Louis, MO, USA) for 15 minutes, and reacted with terminaldeoxytransferase and Biotin-16-2'-deoxy-uridine-5'-triphosphate (dUTP, F. Hoffmann-La Roche Ltd, Basel, Switzerland) at 37℃ for 2 hours 30 minutes to label dUTP. The negative control group was not treated with terminaldeoxytransferase. The reaction was terminated by immersing the samples in TB buffer for 10 minutes, and subsequently blocked with 2% Bovine serum albumin for 15 minutes, followed by washing them with PBS, reacting them with streptavidin-peroxidase for 30 minutes, and then staining them with DAB. Nuclear fast red was used for counter-staining, and the samples were dehydrated again with 70, 90, and 100% ethyl alcohol, and then mounted. To count the number of TUNEL positive-staining cells, three areas of each slide were selected randomly, and the number of total cells and the number of stained cells in a rectangle of 150×250 µm in size were assessed. The ratio of positive cells in each zone of the growth plate was calculated as the number of positive cells to the total number of cells.
VEGF immunohistochemistry
Slides were prepared by a conventional method, treated with 3% hydrogen peroxide (H2O2), and then treated with 0.4% pepsin for 20 minutes. After washing with PBS, 20% goat serum was added to the samples, followed by VEGF antibody (DAKO) at room temperature for 12 hours. After washing with PBS, immunohistochemical staining was performed by applying avidin-biotin (mouse IgG, extra avidin method), staining with D DAB, and counter-staining with Mayer's hematoxylin. To count the number of VEGF positive-staining cells, three areas of each slide were selected randomly, and the number of total cells and the number of stained cells in a rectangle of 150×250 µm in size were assessed. The ratio of positive cells in each zone of the growth plate was calculated as the number of positive cells to the total number of cells.
Statistical analysis
For all groups, the significance of differences in the entire length of the growth plate, the resting zone, the proliferation zone, and the hypertrophic zone, as well as the number of BrdU, TUNNEL, and VEGF positive-staining cells was assessed using two-way ANOVA. The level of statistical significance was set at p<0.01.
RESULTS
The growth plate and the length of each zone according to age
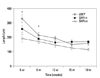
The length of the growth plate was examined in rats from 6 weeks to 18 weeks old. We found that the length of the entire growth plate decreased with aging. During the initial period of growth at 6 and 9 weeks, a significant difference in length of the growth plate was detected when comparing WKY, SHR-n, and SHR+n rats. Especially at 6 weeks, the length of the entire growth plate of the SHR+n group was significantly shorter than that of the WKY group and the SHR-n group; it was approximately 63% of that of the WKY group. However, as bone growth progressed over time, all three groups showed decreases in the lengths of the growth plate, and the difference in the lengths of the growth plate among the three groups decreased in comparison with the initial growth period (Fig. 2).
At 6 weeks of age, the length of the proliferation zone in the growth plate of the SHR+n group was significantly shorter than that of the WKY and SHR-n groups. At 9 weeks of age, the length of the resting zone in the growth plate of the SHR+n group was significantly shorter than that of the WKY and SHR-n groups. The difference in lengths between groups at 6 weeks of age was greater than that observed at 9 weeks of age (Table 1).
Measurement of cell proliferation capacity
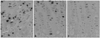
BrdU positive-staining cells were detected in the hypertrophic zone (Fig. 3). At 6 and 9 weeks of age, a significant difference in cellular proliferation was detected when comparing WKY, SHR-n, and SHR+n rats. The WKY group had the highest proliferation rate, while the SHR+n group had the lowest proliferation rate. However, as bone growth progressed over time, all three groups showed a decrease in cell proliferation capacity, and the difference in cell proliferation capacity among the three groups decreased in comparison with the initial growth period; by the age of 12 weeks, there was no significant difference between the lengths of the growth plate in the three groups (Table 2).
Measurement of the rate of apoptosis
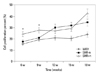
We found that the rate of apoptosis increased with aging (Fig. 4). The rate of apoptosis in all three groups was over 20% after 12 weeks of age. At 6 and 9 weeks of age, a significant difference in the rate of apoptosis was detected when comparing WKY, SHR-n, and SHR+n rats. At 6 weeks of age, the rate of apoptosis in the resting zone of the SHR+n group was significantly higher than that of the WKY and SHR-n groups. At 9 weeks of age, the rate of apoptosis in the proliferation zone of the SHR+n group was significantly higher than that of the WKY and SHR-n group (Fig. 5). At 18 weeks of age, the rate of apoptosis in the SHR+n group was higher than that of other groups (Table 3). However, there was no significant difference among three groups after 12 weeks of age.
The expression of vascular endothelial growth factor
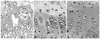
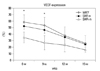
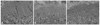
We found that the expression level of VEGF in each zone in all three groups decreased gradually with aging (Fig. 6). In the growth plate of the normal WKY control group, cartilage cells showed the characteristic longitudinal columnar pattern, and this pattern was maintained throughout aging. VEGF was expressed in the lower hypertrophic zone and the calcification zone of the bone growth plate, and it was also expressed in the resting zone and the proliferation zone, though to a lesser extent (Fig. 7). In the SHR-n group, the characteristic longitudinal columnar pattern of the growth plate was maintained; however, the level of expression of VEGF was lower than that of the WKY group. In the SHR+n group, columnar cells exhibited an island pattern, and the expression of VEGF was significantly reduced at 6 and 9 weeks compared to the other two groups. As the age of the rats increased to 12 weeks and 15 weeks, the expression of VEGF decreased, but there was no significant difference among the three groups (Table 4).
DISCUSSION
In the growth plate, four types of histologically distinguishable chondrocytes form a continuous columnar pattern.11 Chondrocytes in the resting zone are inactive flat cells that supply new cells for the proliferation of cartilage cells. Cells in the proliferation zone repeat cell division and mature to a round shape, increasing cell volumes to create a vertical space. These cells also produce extracellular matrix so that the distance between cells is expanded and progresses to the hypertrophic zone. In the hypertrophic zone, the accumulation and release of calcium in chondrocytes and the calcification of the stroma are achieved. Simultaneously, the neovasculature is infiltrated from the metaphysis, and then cells required for bone formation, including osteogenic precursor cells and chondroclasts are influxed. Together with the infiltration of these cells, while undergoing the apoptosis process and transforming to bone, the growth of length was occurred.12-17
VEGF, along with Indian hedgehog, parathyroid hormone related protein, bone morphogenetic protein, matrix metalloproteinase (MMP), and type X collagen, has been reported to play a major role in endochondral ossification.7,9,12,13 VEGF is produced in cartilage cells in the hypertrophic zone and the calcification zone, and VEGF receptors are expressed on vascular endothelial cells as well as on osteoclasts and osteoblasts. To assess the function of VEGF in cartilage ossification, Gerber, et al.18 blocked the function of VEGF with soluble receptor chimeric protein [Flt-(1-3)-IgG] and examined histological changes in the cartilage thereafter. They found, as a result, that there was no influx of blood vessels, and formation of reticular bones was suppressed. Furthermore, widening of the hypertrophic zone, suppression of the infiltration and differentiation of osteoclasts, and reduction of cartilage cell absorption were observed. They confirmed that VEGF-controlled invasion of neovasculature was essential for cartilage ossification and remodeling.
In our study, in the early growth periods of 6 and 9 weeks of age, the whole and partial length of the growth plate of the SHR+n group was significantly different from that of the WKY group and the SHR-n group, and growth impairment was noticeable in the proliferation zone during the early growth period at 6 weeks and in the resting zone at 9 weeks. At 15 and 18 weeks, the length of the entire growth plate of the SHR+n group was the shortest among the three groups. However, the difference in the length of the growth plate between the groups was smaller at 15 and 18 weeks than at 6 and 9 weeks, we thought that these results were most likely due to spontaneous recovery of the growth plate in the SHR+n group over time.
The length of the entire growth plate of the SHR-n group was longer than that of the WKY group because of an increase in the length of the hypertrophic zone in the SHR-n group. Similarly, in the WKY group, an increase in the length of the hypertrophic zone was detected from 15 weeks, though the increase in length of the hypertrophic zone was larger in the SHR-n group than in the WKY group. A previous study reported that the length of the hypertrophic zone was proportional to the growth rate of the growth plate. In our study, we conjectured, due to the delay of angiogenesis of the neovasculature and blood supply from the metaphysis, the influx of ossification-induction materials and osteoblasts were decreased and bone cells were not able to substitute for cartilage cells, resulting in an increase in length of the growth plate. In contrast, in the SHR+n group, as the length of the growth plate increased from 18 weeks of age, it was most likely due to ischemic change during the early growth period.
We suspected that the larger growth delay of the SHR+n group compared to the others was due to a lower rate of cell proliferation in the SHR+n group. Particularly, in the early growth periods, the rates of cell proliferation in the resting zone and proliferation zone of the SHR+n group were significantly lower than those in the WKY and SHR-n groups.
Apoptosis in the growth plate occurs during substitution of the lower hypertrophic zone with bone.19 However, apoptosis in the growth plate may also occur as a result of injury to the growth plate caused by necrosis in the epiphysis.20 At 6 weeks of age, a rate of apoptosis of 15-24% was observed for all groups, and there were no significant differences between groups. However, when each zone was examined separately, a significant difference in the resting zone at 6 weeks and the proliferation zone at 9 weeks was observed between the two SHR groups and the WKY group. At 18 weeks of age, the apoptosis rate of the growth plate was approximately 47.8% in the SHR+n group, which was almost twice the 23.7% apoptosis rate of the WKY group. We speculated that normal apoptosis, which substitutes cartilage for bone, and also apoptosis induced by DNA damage were responsible for the overall high rate of apoptosis rate in the SHR+n group.
In contrast to the rate of apoptosis, we observed that the expression of VEGF decreased with aging during the normal ossification process, which implied that the expression of VEGF was dependent upon the growth stage; when growth is over, VEGF becomes less important than in the early growth period. The expression of VEGF in the growth plate was lower in the two SHR groups than the control WKY group, and the lowest expression level was observed in the SHR+n group. The difference of the expression of VEGF in the two SHR groups implied that the expression of VEGF was influenced by a variety of factors which are not genetically determined. It is therefore essential to examine the expression of more factors such as matrix metalloproteinase-9 (MMP-9) and insulin-like growth factor-1. The role of VEGF in the infiltration of blood vessels should also be studied further assessing the RNA and protein levels of this factor.
Our study had several limitations, even though we adjusted for various limitations by incorporating a large number of animals in the study. First, to evaluate adverse effects on the growth plate, we measured growth plate thickness. This is an easy and simple method; however, it may not be a sensitive enough indicator for evaluating the function of the growth plate. Second, we chose the SHR model for this investigation as it more closely resembles LCP disease than surgically induced models. With the surgically induced model it is possible to ascertain the time when the avascular necrosis of the femoral head develops, but in our SHR model we could not determine the onset time of avascular necrosis of the femoral head.
In conclusion, we were able to observe decreases in the length, proliferation rate, and the expression of VEGF, as well as an increase in the apoptosis rate of growth plates in SHR+n group. The growth plate of the SHR+n group was found to be affected by the disease process of ischemic necrosis of the femoral head, and this might explain why a round femoral head is frequently associated with relative overgrowth of the greater trochanter in the later stages of LCP disease.


 XML Download