Abstract
Purpose
This study was aimed to evaluate the brain metabolism in patients with subcortical aphasia after intracerebral hemorrhage (ICH) and the relationship between the severity of aphasia and regional brain metabolism, by using statistical mapping analysis of F-18 fluorodeoxyglucose positron emission tomography (F-18 FDG PET) images.
Materials and Methods
Sixteen right-handed Korean speaking patients with subcortical aphasia following ICH were enrolled. All patients underwent Korean version of the Western Aphasia Battery and the brain F-18 FDG PET study. Using statistical parametric mapping analysis, we compared the brain metabolisms shown on F-18 FDG PET from 16 patients with subcortical aphasia and 16 normal controls. In addition, we investigated the relationship between regional brain metabolism and the severity of aphasia using covariance model.
Results
Compared to the normal controls, subcortical aphasia after ICH showed diffuse hypometabolism in the ipsilateral cerebrum (frontal, parietal, temporal, occipital, putamen, thalamus) and in the contralateral cerebellum (P corrected<0.001), and showed diffuse hypermetabolism in the contralateral cerebrum (frontal, parietal, temporal) and in the ipsilateral cerebellum (P FDR corrected<0.001). In the covariance analysis, increase of aphasia quotient was significantly correlated with increased brain metabolism in the both orbitofrontal cortices, the right hippocampal and the right parahippocampal cortices (P uncorrected<0.01).
The functions of subcortical structures in the dominant hemisphere for language performance are still controversial. Nevertheless, several roles have been suggested, including that the basal ganglia and thalamus are essential components of the brain networks involved in language functions,1 that the basal ganglia have functions also in motor processing, including articulation, and that the thalamus plays a role in other language functions, including verbal memory.2
The researches for language dysfunction in patients with subcortical aphasia are complicated by conflicting results due to symptomatic diversity. The reason for this diversity is not only the heterogeneity, but also the functional complexity of the subcortical structures. However, several mechanisms have been suggested to explain how such subcortical lesions can lead to aphasia: 1) a direct role in language dysfunction,1 2) secondary cortical dysfunction caused by diaschisis,3 3) cortical hypoperfusion induced by occlusion of a large vessel combined with the subcortical infarction,4 or 4) compressive ischemia in surrounding cortices following intracerebral hemorrhage (ICH).5
There are a few studies that have investigated the brain metabolism in patients with subcortical aphasia after ICH and have evaluated the association between the severity of language impairment and related brain area, by using functional neuroimaging methods. However, most of earlier studies2,3,5 dealt with a small number of patients with heterogenous etiologies, including both subcortical infarction and subcortical ICH, as the cause of their aphasia or analyzed the brain metabolism with less quantitative methods, which are relatively subjective, to correlate brain imaging with subcortical aphasia.2,6,7 In the present study, therefore, we performed the statistical mapping analysis of brain metabolism in patients with subcortical aphasia after ICH and to evaluate the relationship between the severity of aphasia and regional brain metabolism, by using statistical parametric mapping (SPM) of brain F-18 fluorodeoxyglucose positron emission tomography (F-18 FDG PET) and localization with automated anatomic labeling.8
Twenty-two patients with a newly diagnosed ICH in the dominant hemisphere as detected by brain computed tomography (CT) or brain magnetic resonance imaging (MRI) were consecutively recruited into this study. The inclusion criteria were as follows: 1) subcortical aphasia following ICH, without a history of previous cerebrovascular events, 2) no disorders of consciousness, and 3) the language evaluation and the brain F-18 FDG PET were successfully performed. Among the 22 patients, 4 had no definite language dysfunction and 2 demonstrated impaired consciousness. Overall, 16 right-handed patients with left subcortical (basal ganglia or thalamus) hemorrhage, who spoke Korean as their first language, were enrolled in this study. For SPM analysis, age-matched normal controls were recruited. All normal controls and the subjects with subcortical aphasia after ICH were strongly right-handed as indicated by the Edinburgh Handedness inventory,9 and who spoke Korean as their first language. All subjects or their family members gave informed consent, and all procedures were performed with the approval of the Institutional Review Board for Clinical Studies of our institution.
Language function was evaluated by speech pathologists with at least 3 years of experience in the field. All patients underwent an aphasia evaluation using the Korean version of the Western Aphasia Battery (K-WAB).10 The K-WAB assessment is composed of four domains including spontaneous speech, comprehension, repetition, and naming. The type of aphasia was defined by Kertesz's classification,11 and the severity of aphasia was assessed by Aphasia Quotients (AQ; range 0-100), which were calculated for each patient by summating the score of the 4 domains.12 For comparisons of brain metabolism among patients with subcortical aphasia, we classified the type of aphasia into nonfluent aphasia (Broca's and global aphasia; 12 patients) and fluent aphasia (Wernicke's and transcortical aphasia; 4 patients)
Measurement of brain metabolism using F-18 FDG PET was performed in all normal controls and subcortical aphasic patients. All subjects were scanned using a GE Advance PET scanner (GE, Milwaukee, WI, USA) with an intrinsic resolution of 4.8 mm full width at half maximum and simultaneous imaging of 50 contiguous transverse planes with a thickness of 3.3 mm for a longitudinal field of view of 14.5 cm. After fasting for at least 6 hours, subjects received 555 MBq of F-18 FDG intravenously.13 All subjects were instructed to rest comfortably for 30 minutes with their eyes closed and ears unplugged in a quiet room, then acquisition of emission image was performed during 15 minutes.13 An 8-minute transmission scan was performed using triple Ge-68 rod sources to correct for attenuation. Gathered data were reconstructed in a 128×128×35 matrix with a pixel size of 1.95×1.95×4.25 mm by means of a filtered back-projection algorithm employing a trans-axial 8.5 mm Hanning filter and an 8.5 mm axial ramp filter.13
Spatial preprocessing and statistical analyses of PET images in all subjects were performed using SPM software (SPM2, Institute of Neurology, University College London, UK). The F-18 FDG PET templates for all subjects were created by averaging all F-18 FDG PET images and spatially normalizing with the Montreal Neurological Institute (MNI, McGill University, CA, USA) standard F-18 FDG PET template using a nonlinear transformation of SPM2.14 Spatially normalized images were then smoothed by convolution using an isotropic Gaussian kernel with a 12-mm full width half maximum to increase the signal-to-noise ratio and to accommodate the variation in subtle anatomic structures.14 The effects of global metabolism were removed by normalizing the count of each voxel to the mean count of the brain (proportional scaling in SPM).14
After spatial normalization, we performed two types of statistical comparisons. First we compared the brain metabolism between the normal controls and all subcortical aphasic patients. Secondly, we compared the brain metabolism between the nonfluent aphasia and the normal control and between the fluent aphasia and the normal control. All comparisons of brain metabolism were performed on a voxel-by-voxel basis using a two sample t-test. Statistical significance was determined using an extent threshold of 50 voxels. Correction for multiple comparisons was applied using false discovery rate approaches and the corrected threshold was set at p<0.001. Additionally, covariance analyses were performed to identify regions in which an increase of the aphasia quotient in the language performances scores was correlated with increased changes in brain metabolism in subcortical aphasic patients, using a single-subject covariate model. Regions reaching an uncorrected p value of less than 0.01 were considered significant.
We visualized the t-score statistics of the significant voxels on the 3D-rendered brain or a standard high-resolution MRI template provided by SPM2 for anatomic identification and labeled the anatomy of significant voxels, by using the automated anatomic labeling SPM toolbox8 provided by the MNI.
The patients group consisted of 10 men and 6 women with mean age of 52.4 years (range, 36-79 years), whereas the normal control group consisted of 9 men and 7 women with mean age of 50.2 years (range, 38-73 years). There was no significant difference between the two groups with respect to age, and gender (p>0.05).
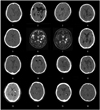
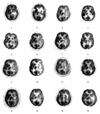
Table 1 shows the general characteristics of the patients, including gender, age, lesion, pathology of carotid or intracranial artery examined by angiography, duration from onset level of education, type of aphasia, and aphasia quotient in the language function testing. The mean duration from onset was 105 days and the mean aphasia quotient, which reflects the severity of aphasia, was 39.9 at evaluation. Fig. 1 demonstrates the brain CT or MRI finding and Fig. 2 shows the brain F-18 FDG PET images of all patients.
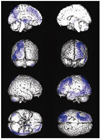
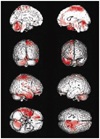
Table 2, Fig. 3, and Fig. 4 demonstrate the differences in the brain metabolism between the normal controls and all aphasic patients. SPM analysis of F-18 FDG PET images demonstrated that compared to the controls, a significant decrease in the brain metabolism in the patients was found in the left superior frontal gyrus, the left middle frontal gyrus, the left inferior parietal lobule, the middle temporal gyrus, the left middle occipital gyrus, the left inferior occipital gyrus, the left thalamus, the left putamen, and the right cerebellum (P FDR correctecd<0.001) (Table 2, Fig. 3). In contrast, the right inferior frontal gyrus, the right supplementary motor area, the right precentral gyrus, the right postcentral gyrus, the right superior temporal gyrus, the right middle temporal gyrus, the right inferior temporal gyrus, the right hippocampus, the right rectal gyrus, and the left cerebellum demonstrated a significant increase in the brain metabolism in all patients compared to those of the controls (P FDR correctecd<0.001) (Table 2, Fig. 4).
Covariance analysis between the increase of the aphasia quotient in each patient and increases of brain metabolism in subcortical aphasic patients found a significant correlation in the both orbitofrontal rectal gyri, the right hippocampal gyrus, and the right parahippocampal gyrus (P uncorrectecd<0.01) (Table 3; Fig. 5).
Table 4 demonstrates the difference in the brain metabolism between the controls and the patients with nonfluent aphasia. Compared to the controls, the brain metabolism in the left middle frontal gyrus, the left thalamus, the left putamen, the left inferior parietal lobule, the left precentral gyrus, the left superior frontal gyrus, and the left middle temporal gyrus was significantly decreased in the nonfluent aphasic patients. In contrast, the brain metabolism in the right cerebellum, the right middle temporal gyrus, the right postcentral gyrus, the right supplementary motor area, and the left cerebellum was significantly increased in the nonfluent aphasia (P FDR correctecd<0.001).
Table 5 demonstrates the difference in the brain metabolism between the normal controls and the patients with fluent subcortical aphasia. Compared with the controls, a significant decrease in the brain metabolism in the fluent aphasics was founded in the left middle occipital gyrus, the left thalamus, the left angular gyrus, the left middle temporal gyrus, the left cuneus, and the left putamen. In contrast, however, the brain metabolism in the right supplementary motor area, the right precentral gyrus, the left cerebellum, the right insular, the right hippocampal gyrus, the right inferior temporal gyrus, the right thalamus, the right superior parietal gyrus, the right inferior frontal gyrus, and the right inferior temporal gyrus was significantly decreased in the fluent aphasia (P FDR correctecd<0.001).
The current study suggest that brain metabolism in patients with subcortical aphasia after ICH is significantly related to diffuse hypometabolism in the ipsilateral frontal, parietal, temporal, and occipital cortices with contralateral cerebellar hypometabolism and is also significantly associated with hypermetabolism in the contralateral frontal, parietal, temporal, and occipital cortices with ipsilateral cerebellar hypermetabolism. In addition, the severity of language impairment is significantly correlated with brain metabolism in the orbitofrontal and the medial temporal cortices. Particularly, the nonfluent aphasia revealed decreased brain metabolism in the left frontoparietal area and the fluent aphasia revealed decreased brain metabolism in the left parietotemporooccipital area.
Disorders of fluency and comprehension in poststroke aphasia are generally caused by anterior frontal-subcortical lesions and posterior temporal-subcortical lesions, respectively.15 Cappa, et al.6 suggested that aphasic patients who have heterogeneous vascular changes and varied lesions reveal the asymmetric hypometabolism in the left frontal, parietal, temporal and occipital cortices, and demonstrated a persistent hypometabolic state in the left thalamus and basal ganglia on PET evaluations. In the present study, our patients also demonstrated diffusely decreased brain metabolism in the frontal, parietal, temporal, and occipital cortices with subcortical structures (thalamus and putamen) in the left hemisphere. These results indicate that diffuse hypometabolism in the ipsilateral cerebral area and subcortical structures, which are perilesional areas around the hemorrhage, may be associated with language dysfunction rather than with direct damage to the left inferior frontal cortex (Broca's area) and the left superior temporal cortex (Wernicke's area).
Many functional neuroimaging studies have demonstrated overactivation in the right hemisphere during language recovery following stroke,6,16,17 particularly in the right inferior frontal gyrus and the right superior temporal gyrus which are homotopic regions of Broca's and Wernicke's areas, respectively.18,19 The current study also revealed a diffusely increased brain metabolism in the right hemisphere, including the right inferior frontal gyrus and the superior temporal gyrus. Even though whether the role of an activated right hemisphere, is adaptive6,20 or maladaptive,16 has not been clarified an overactivation in the right hemisphere has been suggested to reflect the compensatory neural network responsible for recovery from aphasia,17 such as the right inferior frontal cortex contributing to verbal fluency7 and the right superior temporal gyrus controlling speech comprehension.21 Furthermore, the activation of the right frontal cortex in poststroke aphasia, such as the inferior frontal and supplementary motor areas, may partly be explained by the increased executive function in language performance.22 Increased brain metabolism in the right temporal cortex, especially in the anterior lobe and hippocampus, may be interpreted as being related to the compensatory involvement of cognitive processing including memory.23 However, overactivation in the right inferior frontal area in poststroke aphasia may start at 12 days and tend to decline and normalize by 10 months. The mean duration from the onset in our patients was 105 days (from 32 days to 246 days), which could weaken the statistical significance of activation in the right inferior frontal gyrus because the patients were in the process of normalization.
The WAB is one of the common standardized methods used for examination of aphasia in English-speaking countries. The aphasia quotient in the WAB is also widely applied for investigating the severity of aphasia in various neurological conditions.24 The K-WAB test has been validated previously study10 using the aphasia quotient in the K-WAB to examine the severity of subcortical aphasia.25 In the current study, we performed covariance analysis between increases in language performance, as measured by the aphasia quotient from the K-WAB, and regions of increased brain metabolism in subcortical aphasia after ICH. Our findings demonstrated that the orbitofrontal rectal gyri and the right medial temporal cortex (hippocampus and parahippocampus) are correlated significantly with the aphasia quotient, reflecting language performance. The function of the orbitofrontal rectal gyrus has been linked to both attention and memory processing,26 and the medial temporal cortex has been associated with attention, learning, and memory.27,28 Our present findings suggest that language performance in subcortical aphasia after ICH may be associated with cognitive functions in agreement with the findings of Crosson.29 On the other hand, however, de Boissezon, et al.2 previously reported that language performance is correlated significantly with increased brain metabolism in both temporal cortices and the right cerebellum. Discrepancies between the Boissezon study and the current study are likely due to small number of enrolled subjects (7 patients), shorter duration from onset, and heterogeneous etiologies in the Boissezon study.
In the present study, we compared brain metabolism between controls and two groups of patients (nonfluent and fluent aphasia). SPM analysis revealed that nonfluent aphasic patients showed decreased brain metabolism in the frontoparietal area, whereas fluent aphasic patients revealed decreased brain metabolism in the parietotemporooccipital area. These finding suggest that all types of subcortical aphasia may have injury in the parietal area. However, the direction of ICH expansion may a factor to determine the type of aphasia irrespective of lesion site.
Several limitations of the current study should be considered. First, small lesions from ICH often produce no deficits on standard aphasia tests, however large lesions, involved in the capsulostriatal area varied significantly in language deficits.30 Also, the extent of ICH usually can depend on the volume of hemorrhage. However, we could not measure initial volume of hemorrhage, because a significant fraction of enrolled patients were transferred from other hospitals and sufficient information on the initial hemorrhagic volume was not available. Further studies on the correlation between changes in the brain metabolism and the extent of initial hemorrhage should be carried out for validation. Second, we could not investigate the pathology of carotid or other intracranial artery of 16 patients, by angiography. Even though there has been no previous study on the coexisting cerebral ischemia in patients with hemorrhagic stroke, accompanied atherosclerotic change of major cerebral artery can alter the brain metabolism that we did not reflect in our patients. Future studies are need on the pathology of carotid or intracranial artery in patients. Additionally, future study to compare the brain metabolism between subcortical aphasic patients after ICH and patients with subcortical hemorrhage without aphasia as a control group is expected to provide an information about regional brain involvement in language impairment in subcortical aphasia after ICH.
Our present findings suggest that frontal, parietal, and temporal cortices, which are part of the neural network responsible for cognition, such as attention, learning, and memory, may have supportive roles in language performance in subcortical aphasia after ICH. In addition, our results remain to be only a pilot study until they confirmed by further studies including patients without aphasia after subcortical ICH as a control group.
Figures and Tables
 | Fig. 1The brain computed tomography or magnetic resonance images findings of all patients with subcortical aphasia after intracerebral hemorrhage. |
 | Fig. 2The brain F-18 fluorodeoxyglucose positron emission tomography images of all patients with subcortical aphasia after intracerebral hemorrhage. |
 | Fig. 3Statistical parametric maps showing spatial distributions of significant decreases in cerebral glucose metabolism in patients with subcortical aphasia after intracerebral hemorrhage compared to controls. Displayed voxels are significant at P FDR corrected<0.001. |
 | Fig. 4Statistical parametric maps showing spatial distributions of significant increases in cerebral glucose metabolism in patients with subcortical aphasia after intracerebral hemorrhage compared to controls. Displayed voxels are significant at P FDR corrected<0.001. |
 | Fig. 5Statistical parametric maps showing correlations of increased aphasia quotients of language performance with increased changes in regional cerebral glucose metabolism in subcortical aphasia after intracerebral hemorrahge. Displayed voxels are significant at P uncorrected<0.01. R, right; L, left. |
Table 2
Brain Areas Demonstrating Differences in the Brain Metabolism in Patients with Subcortical Aphasia after Intracerebral Hemorrhage Compared with the Normal Controls (P FDR Corrected<0.001, κ=50)

Table 3
Brain Areas Demonstrating Correlation between the Regional Brain Metabolism and the Severity of Aphasia in Patients with Subcortical Aphasia after Intracerebral Hemorrhage (P uncorrected<0.01, κ=50)

ACKNOWLEDGEMENTS
This work was supported by a faculty research grant of Yonsei University College of Medicine for 2009 (6-2009-0058), Seoul, Republic of Korea.
References
1. Damasio AR, Damasio H, Rizzo M, Varney N, Gersh F. Aphasia with nonhemorrhagic lesions in the basal ganglia and internal capsule. Arch Neurol. 1982. 39:15–24.

2. de Boissezon X, Démonet JF, Puel M, Marie N, Raboyeau G, Albucher JF, et al. Subcortical aphasia: a longitudinal PET study. Stroke. 2005. 36:1467–1473.
3. Perani D, Vallar G, Cappa S, Messa C, Fazio F. Aphasia and neglect after subcortical stroke. A clinical/cerebral perfusion correlation study. Brain. 1987. 110:1211–1229.
4. Hillis AE, Wityk RJ, Barker PB, Beauchamp NJ, Gailloud P, Murphy K, et al. Subcortical aphasia and neglect in acute stroke: the role of cortical hypoperfusion. Brain. 2002. 125:1094–1104.

6. Cappa SF, Perani D, Grassi F, Bressi S, Alberoni M, Franceschi M, et al. A PET follow-up study of recovery after stroke in acute aphasics. Brain Lang. 1997. 56:55–67.

7. Warburton E, Price CJ, Swinburn K, Wise RJ. Mechanisms of recovery from aphasia: evidence from positron emission tomography studies. J Neurol Neurosurg Psychiatry. 1999. 66:155–161.

8. Tzourio-Mazoyer N, Landeau B, Papathanassiou D, Crivello F, Etard O, Delcroix N, et al. Automated anatomical labeling of activations in SPM using a macroscopic anatomical parcellation of the MNI MRI single-subject brain. Neuroimage. 2002. 15:273–289.

9. Oldfield RC. The assessment and analysis of handedness: the Edinburgh inventory. Neuropsychologia. 1971. 9:97–113.

10. Kim H, Na DL. Normative data on the Korean version of the Western Aphasia Battery. J Clin Exp Neuropsychol. 2004. 26:1011–1020.

11. Kertesz A. Aphasia and associated disorders: taxonomy, localization and recovery. 1979. Orlando, FL: Grune & Stratton.
12. Kertesz A, Poole E. The aphasia quotient: the taxonomic approach to measurement of aphasic disability. Can J Neurol Sci. 1974. 1:7–16.

13. Kim YW, Shin JC, An YS. Changes in cerebral glucose metabolism in patients with posttraumatic cognitive impairment after memantine therapy: a preliminary study. Ann Nucl Med. 2010. 24:363–369.

14. Kim YW, Shin JC, An YS. Effects of methylphenidate on cerebral glucose metabolism in patients with impaired consciousness after acquired brain injury. Clin Neuropharmacol. 2009. 32:335–339.

15. Kreisler A, Godefroy O, Delmaire C, Debachy B, Leclercq M, Pruvo JP, et al. The anatomy of aphasia revisited. Neurology. 2000. 54:1117–1123.

16. Rosen HJ, Petersen SE, Linenweber MR, Snyder AZ, White DA, Chapman L, et al. Neural correlates of recovery from aphasia after damage to left inferior frontal cortex. Neurology. 2000. 55:1883–1894.

17. Raboyeau G, De Boissezon X, Marie N, Balduyck S, Puel M, Bézy C, et al. Right hemisphere activation in recovery from aphasia: lesion effect or function recruitment? Neurology. 2008. 70:290–298.

18. Heiss WD, Thiel A, Kessler J, Herholz K. Disturbance and recovery of language function: correlates in PET activation studies. Neuroimage. 2003. 20:Suppl 1. S42–S49.

19. Crinion JT, Leff AP. Recovery and treatment of aphasia after stroke: functional imaging studies. Curr Opin Neurol. 2007. 20:667–673.

20. Naeser MA, Martin PI, Nicholas M, Baker EH, Seekins H, Kobayashi M, et al. Improved picture naming in chronic aphasia after TMS to part of right Broca's area: an open-protocol study. Brain Lang. 2005. 93:95–105.

21. Heiss WD, Thiel A. A proposed regional hierarchy in recovery of post-stroke aphasia. Brain Lang. 2006. 98:118–123.

22. Saur D, Kreher BW, Schnell S, Kummerer D, Kellmeyer P, Vry MS, et al. Ventral and dorsal pathways for language. Proc Natl Acad Sci U S A. 2008. 105:18035–18040.

23. Ferstl EC, Neumann J, Bogler C, von Cramon DY. The extended language network: a meta-analysis of neuroimaging studies on text comprehension. Hum Brain Mapp. 2008. 29:581–593.

24. Horner J, Dawson DV, Heyman A, Fish AM. The usefulness of the Western Aphasia Battery for differential diagnosis of Alzheimer dementia and focal stroke syndromes: preliminary evidence. Brain Lang. 1992. 42:77–88.

25. Kim H, Na DL. Korean version of the Western Aphasia Battery. 2001. Seoul, Korea: Paradise Welfare Foundation, Institute for Children with Disabilities.
26. Morecraft RJ, Geula C, Mesulam MM. Cytoarchitecture and neural afferents of orbitofrontal cortex in the brain of the monkey. J Comp Neurol. 1992. 323:341–358.

27. Li Y, Mu Y, Gage FH. Development of neural circuits in the adult hippocampus. Curr Top Dev Biol. 2009. 87:149–174.
28. Rowland DC, Kentros CG. Potential anatomical basis for attentional modulation of hippocampal neurons. Ann N Y Acad Sci. 2008. 1129:213–224.

30. D'Esposito M, Alexander MP. Subcortical aphasia: distinct profiles following left putaminal hemorrhage. Neurology. 1995. 45:38–41.


 PDF
PDF ePub
ePub Citation
 Print
Print


 XML Download