

 PDF
PDF ePub
ePub Citation
 Print
Print


INTRODUCTION
IgA Nephropathy (IgAN) is defined immunohistologically by predominant mesangial deposition of IgA.1 The immunochemical nature of the IgA molecule and its mesangial uptake command a pivotal role in the pathogenesis of IgAN.2,3 Many patients with IgAN have elevated levels of aberrantly glycosylated IgA1 in circulating immune complexes.4,5 Aberrant IgA1 O-glycosylation results from the abnormal function or expression of several specific glycosyltransferases, which may be one of the key pathogenetic mechanisms of IgAN.6 It was also thought that the pathogenic potential of frequently colocalized IgG deposits depends on polarized T-helper cytokines that modulate Fcα receptors of infiltrating macrophages, leading to either activation or inhibition that determines glomerular injury.7 How this kind of immune dysregulation and over-production of aberrantly glycosylated IgA1 develops remain obscure.8 Histone lysine methylation is an important epigenetic mechanism for gene silencing, which may confer tumor cells of growth advantage.9 Many cellular pathways are inactivated by this epigenetic event, including DNA repair, cell cycle, apoptosis, cell adherence, and detoxification.10 Lysine can accept 3 methyl groups, and therefore can be monomethylated, dimethylated or trimethylated. Methylation of histone H3 on lysine 4 (H3K4) plays an important role in the association with active chromatin and gene expression.11-14 Trimethylated H3K4 is preferentially detected at active genes and proposed to promote gene expression through recognition by transcription-activating effector molecules.13 Aberrant alterations in histone lysine methylation patterns implicate in multiple biological processes, such as changing the chromatin structure, regulating gene transcription.15,16 Therefore, it is of significant interest to discuss the aberrance of H3K4me3 in peripheral blood mononuclear cells (PBMCs) of IgAN patients and explore its pathogenic mechanisms.
Chromatin immunoprecipitation linked to microarrays analysis (ChIP-chip), with high-throughput capability, is a useful technology to study histone modifications at a genome-wide level.17,18 Ren, et al.19 first adopted this method to monitor binding of gene-specific transcription activators in yeast. In humans, Weinmann, et al.20 first utilized chromatin immunoprecipitation and CpG microarrays to identify target genes for transcription factors. Recently, this approach has been employed successfully to elucidate the profiles of H3K9 and H3K27 methylation in human disease.21-23
Promoter methylation profiling is quickly becoming a powerful diagnostic tool for the early detection, prognosis, and even prediction of a clinical response to treatments of various diseases. Among the theories concerning the etiology of IgAN, little is known about the epigenetic alterations that occur.
Hence, in this study, we used ChIP-chip technology to profile the variations in H3K4me3 at a genome-wide level of PBMCs from IgAN patients and healthy controls. Our aim was to gain better understanding of the pathogenic mechanisms in IgAN. Meanwhile, we also researched the relevance between H3K4me3 and DNA methylation under this disease condition.
MATERIALS AND METHODS
Patients and controls
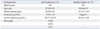
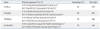
IgAN patients (n=15) and healthy volunteers (n=15) were recruited for this study. Patients were diagnosed and treated in the Kidney Transplantation and Hemopurification Center of the 181th Hospital of Guangzhou Military Area of PLA, from January 2006 to May 2009. Diagnostic criteria of IgAN were based on the manifestation of generalized glomerular mesangial proliferation, with the presence of IgA as the sole or predominant immunoglobulin deposited in the mesangial area of the glomeruli. All of the patients had undergone a renal biopsy for an exact histological diagnosis. Renal biopsy specimens were graded as Haas I-V according to the pathological scheme of IgAN proposed by Haas.24 Age-, race- and sex-matched healthy controls were recruited through advertising. Urinalysis results of the healthy controls were negative and their serum creatinine was within the normal range. The clinical features of the patients and healthy subjects are shown in Table 1. The Ethics Committee of the Chongqing Medical University approved the study, and peripheral blood samples were obtained with the informed consent of all participating individuals. The Helsinki Declaration was adhered to throughout the study.
Isolation of PBMCs
Approximately 10 mL heparinized venous blood samples from IgAN patients and healthy volunteers were collected. Blood samples were treated according to the Ficoll-Paque Plus (Cedarlane Laboratoryies Ltd., Ontario, Canada) instructions and reference.25 Each sample was diluted with equal volumes of phosphate-buffered saline. The diluted blood was overlaid on the equal volume of Ficoll-Paque Plus medium, followed by centrifuged at 800 g for 25 min at 22℃. After being washed twice with phosphate-buffered saline, the collected PBMC layer was stored at -80℃ until assayed.
Chromatin immunoprecipitation microarray
The ChIP-chip analysis was performed according to described protocols26,27 with some modifications. Firstly, PBMCs were allowed to crosslink with 1% formaldehyde (final concentration) for 10 min at 37℃, adding glycine (0.125 M) for 5 min at 37℃ to stop the crosslink. Secondly, the cell pellets were eluted twice with 10 mL of ice-cold 1×PBS and then resuspended with 300 µL lysis buffer (10 mM Tris-HCl pH 8.0; NaCl 100 mM; EDTA 1 mM pH 8.0; Na-Deoxycholate 0.1% and Protease inhibitors) and incubated on ice for 30 min. Finally, the cell suspension was sonicated for 4 min (30 seconds "ON" & 30 seconds "OFF") DNA lengths were decreased to between 200 and 1000 bp. Each ChIP sample was incubated with 555 µL of dilution buffer containing a protease inhibitor cocktail, and the lysate was then divided into three parts. The first lysate was incubated with anti-K4 trimethylated histone H3 antibody (Upstate Biotechnology, Lake Placid, NY, USA) at 4℃ overnight. The remaining two parts served as the input control and negative control, respectively. Fifty microlitres of magnetic beads (Bangs Laboratories. Inc., Fishers, IN, USA) were added and incubated for 1 h at 4℃ to harvest immunoprecipitated complexes. Pellet beads were adsorbed to the bottom of the tube by a magnetic separation rack for 2 min at 4℃, and then discard the supernatant. The magnetic beads were sequentially washed in low salt, high salt, LiCl salt, and TE buffers. The protein/DNA complexes were eluted, and heated at 65℃ for 5 hr to reverse formaldehyde crosslink. Samples were mixed with RNase for 20 min at 37℃ prior to treatment with proteinase K overnight. DNA was extracted according to the phenol/chloroform method. PCR amplification of DNA was carried out on diluted DNA aliquots as recommended by the whole genome amplification kit (Sigma, St. Louis, MO, USA) instructions, followed by DNA purification using the QIAquick PCR purification kit (Qiagen, Hilden, Germany). Cy5TM-dUTP and Cy3TM-dUTP (Invitrogen, Carlsbad, CA, USA) labeled methylated K4 precipitated DNA and input DNA, respectively; and the products thereof were then cohybridized to the human 12K CpG-island array (UNH Microarray Centre, Toronto, Canada). The hybridized microarray slides were then scanned using a GenePix 4000B scanner (Axon Instruments, Foster City, CA, USA). GenePix pro version 6.0 was used to read the raw intensity of the image. The resulting text files were imported into the Agilent GeneSpring GX software for further analysis. The two microarray data sets were normalized in GeneSpring GX using the Agilent Two-color scenario (mainly LOWESS normalization), and then CpGs marked present ("All Targets Value") were chosen for further analysis. The differences between the test and control samples were identified using 2-fold change. The sequences of CpG islands on the array and alignment data are available at http://data.microarrays.ca/. The experiments were done in duplicate.
Chromatin immunoprecipitation-quantitative PCR
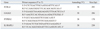
ChIP was conducted in the same way as in ChIP-chip. The DNA pool from ChIP, input control and negative control, was used for quantitative PCR which was performed on an ABI 7700 Real-Time PCR (Applied Biosystems, Foster City, CA, USA). The PCR conditions were as follows: an initial step of 95℃ for 5 min, followed by 95℃ for 15 sec, 59℃ for 20 sec, 72℃ for 20 sec repeated for 40 cycles, and a final 10 min extension at 72℃. In order to evaluate ChIP on chip data, four genes were selected and their corresponding primers are displayed in Table 2. Threshold cycle (CT) values of serially diluted input DNA were determined to generate a standard curve for each amplification. The H3K4me3 changes were determined using the 2-ΔΔCT method28 and each reaction was performed with melting curve analysis to ensure a single peak. The experiment was conducted in triplicate, and average value was calculated for each sample.
RNA extraction and real-time quantitative RT-PCR
Total RNA was extracted from PBMCs using the Trizol reagent (Invitrogen, Carlsbad, CA, USA) in light of the manufacturer's instructions. The concentration and quality of RNA was analyzed spectroscopically using UV absorbance at 260 and 280 nm (A260/A280 ratio), and visualized by agarose gel electrophoresis individually. For RT-PCR, 2 µg total RNA was reverse-transcribed into cDNA with M-MLV reverse transcriptase by using oligo-dT as a primer. Real-time PCR utilized SYBR green dye and Taq polymerase. One-tenth of the resulting cDNA template was used for the subsequent DNA amplification on a 7700 real-time PCR system apparatus.
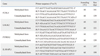
PCR conditions were 95℃ for 15 min, followed by 95℃ for 10 sec, 58℃ for 30 sec, 72℃ for 1 min repeated for 35 cycles, and finally a 7-min incubation at 72℃. Serial dilutions of the amplified product standard with a predefined known concentration were used to create a standard curve. The PCR primers for each gene in this analysis are given in Table 3. GADPH gene mRNA was used as the internal control. The primers for GAPDH were 5'-CCA TGG AGA AGG CTG GGG-3' (sense), and 5'-CAA AGT TGT CAT GGA TGA CC-3' (antisense) (250 bp). The thermal cycles were 94℃ for 6 min, followed by 35 cycles of 94℃ for 60 sec 58℃ for 60 sec and 72℃ for 60 sec, and finally 72℃ for 10 min for extension. Expression was assessed by evaluating CT values. The relative quantity of expressed mRNA was determined by the 2-ΔΔCT method.28 The experiment was performed in triplicate, and average value was calculated for each sample.
DNA extraction and real-time quantitative methylation-specific PCR
Genomic DNA from 15 IgAN patients and 15 healthy controls were treated by overnight proteinase K incubation, phenol-chloroform extraction, recovered by ethanol precipitation and RNase digestion. Sodium bisulfite conversion of unmethylated (but not methylated) cytosine residues to uracil was performed as previously described.29 Briefly, 4 µg of genomic DNA were denatured in NaOH (0.3 M) for 20 min at 50℃, and then diluted with 450 µL of a freshly prepared solution of hydroquinone (125 mM) and sodium bisulfite (2.5 M). After incubation for 3 hr at 70℃, modified DNA samples were desalted and purified through a column (Wizard DNA Clean-Up System, Promega, Madison, WI, USA), incubated with sodium hydroxide for 10 min at room temperature, precipitated with 100% ethanol, resuspended in 240 µL of water and stored at -80℃ for real-time Quantitative Methylation-Specific PCR.
The specific PCR was then used to distinguish between methylated and unmethylated DNA sequences. The primer sequences for the methylated form and unmethylated form are given in Table 4. The PCR conditions comprised one incubation of 10 min at 95℃, followed by 35 cycles of 94℃ for 40 sec, 60℃ for 30 sec, and 72℃ for 30 sec, and a final extension at 72℃ for 10 min. Relative enrichment of DNA methylation for each gene was determined by the same method described above. The experiment was performed in triplicate and obtained CT values to calculate methylation index (MI=methylated copy number/(methylated copy number+unmethylated copy number).30
RESULTS
Identification of CpG island methylation profiles between IgAN patients and healthy subjects
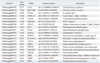
Two steps were adopted to analyze this data to avoid false positive results. First, genes that showed significant differences (the ratio >2 or <0.5) between IgAN and control groups were regarded as H3K4me3 candidates. Second, genes with significant methylation alterations were excluded in the target list if they were not identified as H3K4me3 targets. As a result, 321 probes displayed significant H3K4me3 differences in IgAN patients compared with healthy subjects. Among these probes, 154 probes displayed increased H3K4me3 and 167 probes showed decreased H3K4me3. The H3K4me3 alterations of the 20 selected genes are presented in Table 5. Among these were genes that are involved in many cellular pathways and critical biological functions including protein transcription and synthesis, transport, cell apoptosis, etc.
Validation for CpG microarray data
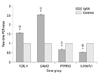
To validate the microarray results, two genes that displayed increased H3K4me3 (FCRL4 and GALK2) and two decreased H3K4me3 (PTPRN2 and IL1RAPL1) were selected and verified by ChIP-qPCR. The data showed FCRL4 (1.56±0.02 versus 1.0; p<0.05) and GALK2 (2.53±0.03 versus 1.0; p<0.05) were significantly higher in IgAN patients than those in healthy controls, while PTPRN2 (0.68±0.03 versus 1.0; p<0.05) and IL1RAPL1 (0.52±0.03 versus 1.0; p<0.05) were significantly lower in IgAN patients than those in healthy controls (Fig. 1). All these results together supported the accuracy of the array data.
H3K4me3 alterations and gene expression
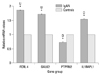
The mRNA expressions of the four selected H3K4me3 candidates were examined by real-time quantitative RT-PCR. As shown in Fig. 2, FCRL4 (1.86±0.03 versus 1.0; p<0.05), GALK2 (1.73±0.04 versus 1.0; p<0.05) and IL-1RAPL1 (1.55±0.03 versus 1.0; p<0.05) mRNA expression levels in PBMCs were significantly higher than in corresponding normal subjects. In addition, PTPRN2 (0.74±0.03 versus 1.0; p<0.05) displayed lower mRNA expression levels. According to our previous understanding, the high levels of H3K4me3 are associated with active genes,11,31 but the high expression of IL1RAPL1 was contrary to its low H3K4me3.
H3K4me3 alterations and DNA methylation
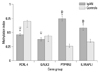
We further assessed the association of H3K4me3 and DNA methylation. As shown in Fig. 3, the levels of DNA methylation in PTPRN2 (0.75±0.04 versus 0.26±0.01; p<0.05) and IL1RAPL1 (0.59±0.04 versus 0.34±0.01; p<0.05) were higher than in normal subjects. FCRL4 (0.46±0.02 versus 0.71±0.09; p<0.05) was lower than in normal subjects. However, GALK2 (0.38±0.03 versus 0.44±0.104; p>0.05) showed no distinct difference in DNA methylation between IgAN and normal subjects.
DISCUSSION
More than one-half of human genes have cytosineguanine (CpG) islands which are important regulatory elements of transcription.32 In this study, we used human 12K CpG island arrays to identify H3K4me3 variations. The human 12K CpG island contains a significant percentage of the CpG islands found in the human genome and approximately 68% were located near a transcription start site.33 Among the genes identified in the CpG array, FCRL4 and GALK2 displaying increased H3K4me3 were selected for further study. The FCRL4 gene encodes a member of the immunoglobulin receptor superfamily and is one of several Fc receptor-like glycoproteins clustered on the long arm of chromosome 1. Data indirectly suggest that FcalphaRI (Fc alpha receptor I) activation mediates IgAN development by initiating a cytokine/chemokine cascade.34 The encoded protein by FCRL4 may have a similar function as the FcalphaRI in the pathogenetic progress. As for the Fc receptor-like glycoproteins, we conjecture that they take part in the undergalactosylation of IgA in some way.
The abnormalities of galactosylation and sialylation in IgA1 play an important role in the development of IgA nephropathy. Mesangial deposits of IgA contains high concentrations of abnormally glycosylated IgA1, characterized by undergalactosylation.35 The GALK2 gene plays a key role in normal galactose metabolism by catalyzing the conversion of α-d-galactose to galactose 1-phosphate.36 Our results showed its high expression of mRNA, and we may hypothesize that the increase in GALK2 induces the low concentration of galactose and results in the undergalactosylation of IgA.
Two other genes, PTPRN2 and IL1RAPL1, demonstrated decreased H3K4me3. The protein encoded by PTPRN2 is a member of the protein tyrosine phosphatase (PTP) family. PTPs are known to be signaling molecules that regulate a variety of cellular processes including cell growth, differentiation, mitotic cycle, and oncogenic transformation.37 Protein tyrosine kinase (PTK) can promote renal podocytes to produce vascular endothelial growth factor by a signaling pathway and increase urine protein.38 In our results, PTPRN2 displayed decreased H3K4me3 and mRNA expression. It has been elucidated that PTP can oppose PTK actions.39 Perhaps the depression of PTP could not inhibit the activity of PTK and exacerbate the progression of IgAN. PTPRN2 has been a sensitive and specific DNA methylation marker panel for squamous cell lung cancer.40 In our study, PTPRN2 gene also showed high DNA methylation.
The protein encoded by the IL1RAPL1 gene is a member of the interleukin 1 receptor family and is similar to the interleukin 1 accessory proteins. The IL-1 cytokine family is considered to play important roles in the progression of IgAN, and IL-1 is expressed in the glomeruli of IgAN patients.41 Generally, cytokines fulfill their biological processes by combination with their receptor. IL1RAPL1 showed low methylation of H3K4me3, enhanced DNA methylation and increased mRNA expression. We feel that the high expression can encode for more interleukin 1 receptors and deteriorate the disease. The low levels of H3K4me3 and high level DNA methylation are generally associated with inactive genes; nevertheless, IL1RAPL1 displayed high mRNA expression. We assumed that there are other epigenetic modifications to promote this gene expression.
DNA methylation and histone modification may act synergistically or antagonistically on gene expression.42,43 High levels of DNA methylation detected in IL1RAPL1 and PTPRN2 suggested an inverse relationship between low H3K4me3 and high DNA methylation in IgAN patients. However, GALK2 did not show significant DNA methylation. We will have to carry out further research to study the correlation between alterant H3K4me3 and local changes in DNA methylation in IgAN.
In summary, we systematically and initially profiled H3K4me3 in PBMCs of IgAN patients. The present study suggests that H3K4me3 alterations of promoters might contribute to the pathogenesis of IgAN.
 XML Download