

 PDF
PDF ePub
ePub Citation
 Print
Print


INTRODUCTION
Liver stiffness measurement (LSM) using FibroScan® has been considered as a rapid and noninvasive method to assess liver fibrosis in patients with chronic hepatitis B (CHB) and chronic hepatitis C (CHC).1-3 Results to date show that LSM can help physicians decide treatment strategies, predict prognosis, and monitor disease progression or regression in patients with chronic liver disease.4 Although LSM is generally reliable, three conditions are recommended by the manufacturer to ensure its reliability: more than 10 valid measurements (VMs), successful measurements in more than 60% of all measurements taken,1,2 and an interquartile range/median value (IQR/M) less than 0.3.5,6 However, the manufacturer's recommendations are not based on scientific evidence, and recent studies have challenged the influence of these parameters on LSM accuracy.7-9
Although the influences of success rate and IQR/M on LSM accuracy have been tested in several previous studies,7,8,10 the optimal number of VMs has not been elucidated. Accordingly, if fewer than 10 VMs were sufficient for a reliable LSM, and if the currently recommended number of VM (more than 10) was overestimated, then some LSM results based on fewer than 10 VMs might have been discarded, even though they accurately reflected the status of liver fibrosis. Furthermore, repeated trials to obtain more than 10 VMs might decrease the overall success rate due to accumulation of unsuccessful measurements, causing these LSM results might have been needlessly discarded as well. Therefore, uncertainty with the optimal number of VMs may limit further application of LSM and deprive some patients of the benefits this noninvasive device provides in diagnosing significant liver diseases.
Hence, we investigated the minimal number of VMs required to assess liver fibrosis without significant loss of accuracy in patients with either CHB or CHC and the predictors of discordance between LSM and liver biopsy (LB).
MATERIALS AND METHODS
Patients
Between January 2005 and December 2009, we enrolled 206 consecutive patients with CHB and 71 patients with CHC who were to undergo LB and LSM before starting antiviral treatment. We defined CHB by the presence of detectable hepatitis B virus surface antigen for more than 6 months and the presence of HBV DNA, and we defined CHC by the presence of detectable serum anti-hepatitis C virus antibodies and HCV RNA. Two hundred and ten (75.8%) patients received LSM on the same day as LB, while 67 patients (24.2%) received LSM shortly before LB (median, 6 days; range, 2-10).
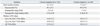
Exclusion criteria were as follows: 1) evidence of decompensated liver cirrhosis, such as a history of variceal bleeding, ascites, hepatic encephalopathy, or Child-Pugh class B/C at the time of LSM;11 2) previous history of antiviral treatment; 3) coexisting hepatocellular carcinoma; 4) coinfection with hepatitis D or human immunodeficiency virus; 5) alcohol ingestion in excess of 20 g/day for men and 30 g/day for women in excess of 5 years; 6) insufficient LB quality (LB length <15 mm);12 7) fewer than 10 VMs (n=9); 8) LSM failure (no valid shot, n=1); and 9) right-sided heart failure.13 By these criteria, we excluded 27 patients (8 patients with fewer than 10 VMs, 16 with insufficient LB quality, 1 with hepatocellular carcinoma, 1 with LSM failure due to ascites, and 1 with fewer than 10 VMs and insufficient LB quality) and enrolled 250 for final analysis (182 with CHB and 68 with CHC). The characteristics of the patients excluded are shown in Table 1. There were no differences in baseline characteristics between the 182 enrolled patients and the 9 patients excluded due to fewer than 10 VMs (all p>0.05). Among the 9 patients with fewer than 10 VMs, 7 patients had 3-9 VMs and 5 (71.4%) out of these 7 patients showed the same fibrosis grade as assessed by LSM and LB. Forty IU/mL was defined as the upper limit of normal (ULN) of alanine aminotransferase (ALT).
The study protocol complied with ethical guidelines of the 1975 Declaration of Helsinki. Each participant or a responsible family member gave their written informed consent after the possible complications of LB had been fully explained. The independent institutional review board of our institute (Severance Hospital) approved this study.
Liver stiffness measurement
LSM using FibroScan® generates an elastic wave using a vibrator applied to the intercostal spaces at the level of the right lobe of the liver and measures the propagation velocity of the shear wave, which is directly related to liver stiffness.14 In the present study, a single experienced operator, who was blinded to patients' clinical data and LB results, performed all LSMs. Success rate was calculated as the number of VMs divided by the total number of measurements. Liver stiffness was expressed in kilopascals (kPa). IQR was defined as an index of intrinsic variability of LSM corresponding to the interval of LSM results containing 50% of the valid measurements between the 25th and 75th percentiles. The median value was considered representative of the elastic modulus of the liver. Only LSMs with at least 10 VMs were considered reliable. Any LSM that did not meet these criteria of reliability was excluded.
Liver histology
LB specimens were fixed in formalin and paraffin-embedded. Four-micrometer sections were stained with hematoxylin and eosin as well as Masson trichrome. All liver tissue samples were evaluated by an experienced hepatopathologist who was blinded to patients' clinical data and LSM results. LB specimens shorter than 15 mm were considered unsuitable for fibrosis assessment and were excluded from analysis.
Selection of reference LSM cutoff values
After establishing a minimal number of VMs required for a reliable LSM, we aimed to identify predictors of discordance in fibrosis stage as estimated by the median elasticity score, which was based on the minimal VM requirement, and by LB. Therefore, we sought external reference cutoff values for LSM from the literature.
We found three meta-analyses on LSM.17-19 However, most studies included in these meta-analyses involved European patients with CHC and higher body mass indices (BMI) than found in Asian populations. Thus, we selected two Asian studies which reported on the performance of LSM in patients with CHB,20,21 choosing the LSM cutoff values from Chan, et al.20 as a reference because they used a larger sample size (n=161 vs. 88). Since the article by Chan, et al.20 did not include the LSM cutoff value for fibrosis stage ≥F2, we obtained it from them directly.8 Finally, the optimal cutoff LSM values for fibrosis stages ≥F2, ≥F3 and F4 for our study population with CHB were 6.0, 8.4 and 9.0 kPa, respectively.
For patients with CHC, Stebbing, et al.19 reported LSM cutoff values in their meta-analysis of European studies; however, the value for fibrosis stage ≥F3 was absent. Furthermore, the cutoff values in their analysis may potentially be biased with the preponderance of patients with high BMI in the studies included.19 It is plausible that BMI influences LSM cutoff values.6 Thus, we consulted two external studies, conducted in Japan, on the performance of LSM in Asian patients with CHC.22,23 One of these, Takeda, et al.,22 did not provide optimal LSM cutoff values, so we excluded it. We eventually used the cutoff values presented by Nitta, et al.23 as our reference. For our study population with CHC, the optimal LSM cutoff values for fibrosis stages ≥F2, ≥F3, and F4 were 7.1, 9.6, and 11.6 kPa, respectively.
Statistical analysis
The patient characteristics are presented as the mean±standard deviation or n (%) as appropriate. The independent t-test or Mann-Whitney U-test was used for continuous variables, while the χ2 test or Fisher's exact test was used for categorical variables. The performance of LSM in predicting significant fibrosis (≥F2) and cirrhosis (F4) using median elasticity scores from the first 3, first 5, and all VMs taken was assessed using the receiver operating characteristic (ROC) curves and the area under the ROC (AUROC) curve, which is similar to a previous study.9 Performance values were compared using the method presented in DeLong, et al.24 The optimal ALT cutoff values were determined to maximize the sum of sensitivity (Se) and specificity (Sp). As LSM and LB results are too variable to determine small differences,12 we defined "discordance" as a difference greater than or equal to two fibrosis stages between LB and LSM. Binary logistic regression analysis was used to identify predictors of discordance in fibrosis stages as estimated by the median elasticity score from the identified minimal number of VMs and by LB. A two-sided p value of less than 0.05 was considered significant. All statistical computations were performed with SPSS software version 12.0 (SPSS Inc., Chicago, IL, USA).
RESULTS
Baseline characteristics
The baseline characteristics of all patients are presented in Table 1. The proportion of males, biopsy length, and serum albumin for the 24 excluded patients with CHB were significantly lower than the 182 enrolled patients overall (all p<0.05). Among those with CHC, 3 excluded patients differed from the 68 enrolled patients in having only a significantly smaller biopsy length (p<0.001).
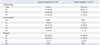
The mean age and BMI of the 182 enrolled patients with CHB were 46.0 years and 23.4 kg/m2 (Table 1), which are similar to those of a previous study by Chan, et al.20 (45 years and 24 kg/m2). In contrast, the mean age and BMI of the 68 enrolled patients with CHC was 49.7 years (median 52, range 18-76) and 23.1 kg/m2. The median age of our study population with CHC was slightly lower than that of a previous study by Nitta, et al.23 (57 years).
Baseline LSM data
The baseline LSM data are summarized in Table 2. The mean number of VMs acquired was 11.1 in patients with CHB and 11.2 in those with CHC. Patients with CHB and CHC did not differ significantly in the mean of median elasticity scores obtained using the first 3, first 5, and all VMs taken (all p>0.05).
Liver histology and the range of LSM according to fibrosis stage
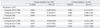
Distributions of fibrosis stage, activity grade, and steatosis are listed in Table 3. Significant fibrosis (≥F2) was observed in 167 (91.7%) patients with CHB and 46 (67.6%) with CHC. Only two (1.1%) of 182 patients with CHB and two (2.9%) of 68 patients with CHC showed moderate steatosis (S2), whereas most patients (80.2% of CHB and 80.9% of CHC) showed nonsignificant steatosis (S0).
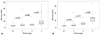
The median LSM values and ranges according to fibrosis stages are shown in Fig. 1. The median LSM value was 5.4 kPa (range, 3.7-15.3) in F0F1 fibrosis stage; 6.8 kPa (range, 4.1-58.2) in F2; 8.1 kPa (range, 5.7-11.8) in F3; and 14.3 kPa (range, 5.1-73.5) in F4 in patients with CHB. LSM values were significantly different between stages F3 and F4 in patients with CHB (p<0.001). In those with CHC, the median LSM value was 4.5 kPa (range, 3.3-10.2) in F0F1; 6.3 kPa (range, 3.5-42.2) in F2; 10.4 kPa (range, 7.1-17.3) in F3; and 26.6 kPa (range, 11.5-67.8) in F4. LSM values were significantly different between stages F01 and F2 and between stages F3 and F4 in patients with CHC (p=0.026 and p=0.048, respectively).
Among patients with fibrosis stage F2, one patient with CHB and another one with CHC had extremely high LSM values (58.2 kPa and 42.2 kPa, respectively). Both of these patients had activity grade 4, high ALT (603 IU/L and 187 IU/L, respectively), and total bilirubin levels of 9.2 mg/dL and 2.7 mg/dL, respectively.
Performance of LSM in predicting significant fibrosis (≥F2) and cirrhosis (F4)
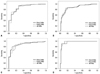
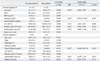
Table 4 and Fig. 2 show the diagnostic performance and corresponding ROC curves for predicting fibrosis stages ≥F2 and F4 using LSM. The median elasticity scores from the first 3, first 5, and all VMs taken significantly predicted fibrosis stages ≥F2 and F4 (all p<0.05) and did not differ significantly in AUROC values (all p>0.05).
Predictors of discordance between LSM and LB
Since the performance values for predicting fibrosis stages ≥F2 and F4 did not differ using the median elasticity scores from the first 3, first 5, and all VMs taken, we used multivariate analysis to identify predictors of discordance in fibrosis stage as estimated by the median elasticity score from the first 3 VMs taken and by LB (Table 5). Using the LSM cutoff values from Chan, et al.,20 discordances were identified in 28 (15.4%) patients with CHB. Using the cutoff values from Nitta, et al.,23 we found discordance in 4 (5.9%) patients with CHC.
ALT remained as the only independent predictor of discordance in patients with CHB [p=0.006; hazard ratio (HR), 1.010; 95% confidence interval (CI), 1.003-1.017], whereas no independent predictor was identified for patients with CHC.
DISCUSSION
LSM is generally considered reliable when more than 10 VMs are obtained, more than 60% of measurements are successful,1,2 and the IQR/M is less than 0.3.5,6 The FibroScan® manufacturer recommends these criteria; however, they are not based on scientific evidence. Investigators therefore have questioned their validity and influences on LSM accuracy.
In a study of European patients with CHC, Lucidarme, et al.7 concluded that the optimal IQR/M cutoff value to predict discordance of more than 2 fibrosis stages between LB and LSM was 0.21 rather than 0.3, which was used as the standard cutoff value for guaranteeing the reliability of LSM. These newly proposed and more stringent criteria of Lucidarme, et al.7 narrowed the scope of previously considered reliable LSMs and led us to reconsider LSM results with IQR/M in a borderline range (from 0.21 to 0.3). In a study of Korean patients with CHB, Kim, et al.8 concluded that
neither success rate nor IQR/M was a predictive factor of the accuracy for diagnosing liver fibrosis and that the confounding effects of ALT might overshadow the influence of success rate and IQR/M on the accuracy of LSM. A recent study in Canada proposed that four factors, mild fibrosis, higher BMI, ALT, and IQR/M, are significantly related to discordance between LB and LSM, although etiologies of chronic liver disease were mixed.10 In all of these three studies, however, only patients with more than 10 VMs were enrolled; hence, the minimal number of VMs required for reliable LSM without significant loss in accuracy could not be analyzed. As a result, valid LSM results might have continually been discarded because of the overestimated standard number of VMs required for reliability of LSM. Thus, it is imperative to set the optimal number of VMs.
Fortunately, Kettaneh, et al.9 reported that the performance in diagnosing significant fibrosis and cirrhosis using LSM was similar for whether one used the first 3, first 5 or all 10 VMs for calculating median elasticity scores in patients who underwent at least 10 VMs. From this study, they concluded that setting the number of VMs at 5 or more will extend the benefits from LSM to more European patients with CHC without significant loss of diagnostic accuracy. However, because the patients with more than 3 VMs, but less than 10 VMs comprised only about 5% of the study population, the authors could not link any patient characteristic to the number of VMs required. Furthermore, different prevalence in obesity and metabolic syndrome between Asian and Western populations as well as different viral characteristics between CHB and CHC may significantly influence LSM results.16,21,25 Thus, the minimal number of VMs required in Asian patients with CHB or CHC should be investigated.
In contrast to previous studies, we found that LSM predicted cirrhosis less accurately than it did significant fibrosis in patients with CHB. A potential spectrum bias, due to an extremely high prevalence of cirrhosis (more than 60%), might explain this finding.26 However, the performance of LSM in our study for patients with CHC agrees with literature values. In common with a previous study,9 we found that the accuracy of LSM in predicting significant fibrosis and cirrhosis using median elasticity scores from the first 3, first 5, and all VMs taken was similar in both patients with CHB and those with CHC. From this, we decided that 3 VMs of LSM may suffice in assessing liver fibrosis without significant loss of accuracy and then tried to identify factors that predict discordance in fibrosis stage estimates, according to the median elasticity score from the first 3 VMs and LB.
The overall discordance in our study population was 12.8% (32 out of 250), 15.4% (n=28) in patients with CHB and 5.9% (n=4) in those with CHC. Although our overall discordance agreed with that in a previous study by Lucidarme, et al.7 (15.8% using Ziol's cutoff values, 13.8% using Fraquelli's cutoff values, and 11.0% using Castera's cutoff values),1,2,5 it was significantly lower (5.9%) in our patients with CHC. On multivariate analysis, only ALT independently influenced discordance (p=0.006, HR 1.010, 95% CI, 1.003-1.0178) in patients with CHB, which agrees with previous studies reporting the importance of serum ALT in interpreting LSM in patients with CHB.4,20 As CHB frequently exhibits acute ALT flares that are unlikely to occur in CHC,25,27 many studies have noted high ALT as having clinical significance. In contrast, we found no significant predictor of discordance in patients with CHC.
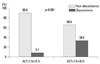
Using the median elasticity scores from the first 3 VMs and LB, we calculated the optimal ALT cutoff level, which maximally distinguished patients with non-discordance from those with discordance between LSM and LB, as 1.5×ULN (60 IU/L; Se 57.1% and Sp 79.5%). This value is very close to those in previous studies (1.5×ULN in one study10 and 2×ULN in another8). The prevalence of discordance was significantly higher in patients with ALT >1.5×ULN than in those with ALT ≤1.5×ULN (34.0% vs. 9.1%; p<0.001; odds ratio, 5.161; 95% CI, 2.214-12.030) (Fig. 3). These results may indicate the need to consider ALT level in predicting discordance for patients with CHB, although it may not influence the overall performance of using only the first 3 VMs for LSM.
As in Kettaneh, et al.,9 we compared the performance of the median elasticity scores from the first 3, first 5, and all VMs taken in patients with at least 10 VMs. This approach was unavoidable; however, as only 9 (3.2%) of the patients had fewer than 10 VMs before the exclusions in our study. Indeed, a sufficient number of patients with fewer than 10 VMs should be assembled to identify baseline factors for predicting those who would or would not obtain more than 10 VMs, by comparing their baseline characteristics before LSM examinations. Knowledge of these baseline predictors will allow us to decide when to stop measuring further unnecessary measurements of liver elasticity, allowing us to use only the minimal, but sufficient number of VMs for each patient. Furthermore, doing so will eventually clarify whether a reduced number of VMs of less than 10 can be adopted for analyzing the performance of LSM in an adequate study group with less than 10 VMs available. In our study, a small number of patients with than 10 VMs is one of our main limitations. A larger study, possibly a multi-center trial, including patients with a strategic balance of VMs should be performed to justify our findings. In addition, the small sample size overall, especially for patients with CHC, is another limitation of our study. Finally, we used external studies on the performance of LSM in Asian patients as reference cutoff values. Therefore, results of this study might be not relevant for Europeans.
In conclusion, three VMs may be enough to assess liver fibrosis using LSM without significant loss of accuracy in patients with CHB and patients with CHC. However, ALT should be considered in the interpretation of LSM results for patients with CHB.
 XML Download