

 PDF
PDF ePub
ePub Citation
 Print
Print


INTRODUCTION
Colorectal cancer is a frequently diagnosed cancer with high mortality. In patients with advanced stage, preoperative radiation therapy or preoperative concurrent chemo-radiation therapy (CCRT) is frequently administered.1-3 Such therapies are useful for decreasing rates of recurrence.4 However, there are currently no methods for predicting which tumors will respond to radiation therapy.
Tumor vascularity and oxygenation status have long been advocated as important factors that influence tumor responses to radiation therapy.5 Dynamic contrast-enhanced magnetic resonance imaging (DCE-MRI) combined with pharmacokinetic modeling has emerged as a promising noninvasive imaging technique for evaluating tumor microvasculature, generating quantitative parameters of microcirculation based on the two-compartment Tofts model.6,7 According to this model, contrast enters the intravascular space (compartment 1), passes into the interstitial space (compartment 2), and reenters the intravascular space (compartment 1). During this course, Ktrans represents the rate of which the contrast media passes from the intravascular space to the interstitial space. Kep signifies the rate constant for back diffusion of the contrast agent from the interstitial space into the intravascular space. Ve denotes extravascular-extracellular leakage space. Several studies have shown that DCE-MRI derived parameters are related to tumor responses to treatment. George, et al.8 showed that responsive tumors had higher pretreatment Ktrans values than non-responsive tumors in colorectal cancer. In addition, Ah-See, et al.9 recently reported that early changes in Ktrans are the best predictor for treatment responses to chemotherapy in patients with breast cancer. Meanwhile, Yu, et al.10 showed that early changes in tumor size are better response predictors than other DCE derived parameters. Furthermore, some studies emphasized the analysis of intratumoral heterogeneity. According to one study, standard deviation (SD) of pixel values for Ktrans could allow for improved diagnostic accuracy for distinguishing breast cancer from benign lesions.11 Accordingly, a response group treated for locally advanced breast cancer exhibited significant reductions in SD of enhancement amplitude, demonstrating a more homogenous distribution after treatment.12 Although the results of several reports have been published, the predictability of DCE-derived parameters are still debated and not standardized.
The aim of this study was to investigate the predictability of pretreatment values including DCE-MRI derived parameters (Ktrans, Kep and Ve), early changes in parameters (Ktrans, tumor volume), and heterogeneity (standard deviation of Ktrans) for radiation therapy responses via a human colorectal cancer xenograft model.
MATERIALS AND METHODS
Experimental model
All experiments followed institutional guidelines for the care and use of laboratory animals. A human DLD-1 colon cancer cell suspension (1×10⁶ cells in 100 µL of phosphate buffered saline) was implanted subcutaneously into the right hind limbs of five 5-week-old (SLC, Kotoh-cho, Japan) female nude mouse. Tumors were allowed to grow for approximately 7 to 14 days, until reaching an approximate longest diameter of 1 cm before initiating radiation therapy. However, there was some degree of variability in volume because the tumors in each mouse did not grow at exactly the same rate.
Irradiations
The mice were anesthetized by intraperitoneal injection of a mixture of Zoletil (40 mg/kg) and Rompun (5 mg/kg) to achieve reproducible prone positioning during treatment. Irradiations were performed with a linear accelerator (CGR, Paris, France) using a beam of 18-MV photons. The dose rate was 200 cGy/min at a focus-to-skin distance of 127 cm. The hind leg subcutaneously implanted tumor was irradiated while the remainder of the mouse was shielded with 8-cm-thick Arplay Cerro (Arplay, Izeure, France), positioned on top of a 2.5-cm Plexiglas™ (Rohm and Haas company, Philadelphia, PA, USA) plate necessary for electronic equilibrium. Dosimetry in the treatment position was performed using LiF pastilles positioned at the area of tumor cell inoculation to indicate accurate dose delivery to the tumor. Each mouse received 3 fractions of 3 Gy each for a total of 21 days at an interval of 7 days. After three cycles of irradiations were completed, the nude mice were euthanized.
MR examinations
DCE MRI was performed four times for each mouse. The first base line study was performed immediately before initiating radiation therapy. The other three MRIs were performed one week after each radiation therapy.
Magnetic resonance imaging was performed using a whole-body 3T MR scanner (MAGNETOM Tim Trio, Siemens Healthcare, Erlangen, Germany) and a four-phased array wrist coil (Siemens Healthcare). The mice were placed prone in a plastic holder and connected to a mask carrying inhaled anesthetic to restrict movement. The mice were initially anesthetized with 4% isoflurane inhalation, and anesthesia was maintained with 2% isoflurane in a mixture of 1 L/min of 100% oxygen. The tail vein was cannulated for intravenous access of MR contrast.
A transverse T2-weighted turbo spin echo sequence [repetition time (TR)/echo time (TE), 4930/128 msec; echo train length, 25; one signal acquired; matrix, 114×192] was performed with a section thickness of 1.0 mm, with an intersection gap of 0.12 mm and a flip angle of 160°. The field of view was 35×60 mm to cover the tumor completely (20 sections). T1 mapping was obtained using two variable flip angle acquisitions. Two precontrast T1 weighted measurements (3D VIBE; TR/TE, 8.32/2.29; matrix, 90×128) with different flip angles (2°, 15°) were performed with a section thickness of 1.04 mm (20 sections) and a field of view of 50×50 mm. This was followed by the dynamic contrast enhanced series using the TWIST sequence (TR/TE, 5.81/2.42; flip angle, 12°; other parameters were the same as the precontrast scan).
For the entire volume of 20 sections, the acquisition time was 6.2 seconds with a single signal acquired. This sequence was applied continuously for 60 measurements. After the first five measurements, an intravenous bolus injection of gadopentetate dimeglumine (Magnevist; Schering, Erlangen, Germany) at a concentration of 0.05 mmol/mL was administered manually at a dose of 0.3 mmol/kg over the maximum period of 5 seconds.
On completion of the study, data were transferred to an image processing workstation (Leonardo; Siemens Healthcare sector, Erlangen, Germany) and analyzed using Tissue 4D software (Siemens Healthcare sector, Erlangen, Germany). The dynamic data were fitted pixel by pixel to a pharmacokinetic model described by Tofts,7,13 generating the transfer constant value, indicated by the symbol Ktrans (per second).
Image analysis and measurement
Regions of interests were outlined on each MRI. Software generated values for Ktrans, Kep, and Ve in each pixel and color maps for Ktrans pixel values. We selected values in the 95th percentile of distribution for each variable as being representative of quantitative parameters rather than the maximum, because the former was suggested to reduce motion induced errors, specifically in the periphery of a tumor.14,15 We avoided mean values because they did not reflect the tumor heterogeneity, such as tumor necrosis. The largest length, width, and height of each tumor were measured from the T2-weighted images. Tumor volume was calculated by the formula of ellipsoid volume as follows:
π/6×L×W×H16
Where L was length, W was width, and H was the height of the tumor, respectively.
To evaluate the changes in the values of Ktrans and tumor volume in the early radiation therapy periods, we defined ratios of Ktrans, volume, and standard deviation as follows:
K1R=K1/K0
V1R=V1/V0
SD1R=SD1/SD0,
Where K0 values were of the 95th percentile of baseline Ktrans, V0 was the pretreatment tumor volume, and SD0 was the standard deviation of Ktrans at baseline. K1, V1, and SD1 were values taken after the first radiation therapy.
Histological analysis
After performing DCE-MRI, the tumor was surgically excised from the right hind limb of the mice under ether anesthesia. The excised tumor was fixed with 10% formaldehyde solution and sliced in the transverse plane in 6 µm-thick slide sections, corresponding to the MR images. Histological analysis of the tumor was performed with hematoxylin and eosin staining to identify tumor necrosis and to evaluate tumor responses. Histological slides were scanned with a digital virtual microscope (Dotslide, Olympus, Hamburg, Germany). The outer tumor border and tumor necrosis were manually circumscribed using Image J software (NIH, Bethesda, MD, USA). Then the total pixel area of both the whole tumor and the necrotic region was automatically calculated. Histological necrotic fraction (NF) was defined by dividing the total pixel area of necrosis by the total pixel area within the tumor border. A "good response" was classified for tumors exhibiting a NF greater than 0.4.17
RESULTS
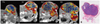
Serial changes in the 95th percentile values for Ktrans, Kep, Ve, and tumor volume during radiation therapy were summarized in Table 1. While tumors with an NF of less than 0.4 were classified as demonstrating a poor response, mouse 3 with an NF of 0.49 was exceptionally classified as demonstrating a poor response, because a separate adjacent tumor had continuously grown after the first radiation therapy (Fig. 1).
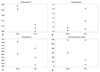
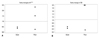
The good response group (mice #1, 2) showed higher pretreatment Ktrans than the poor response group (mice #3, 4, 5). Two of the three mice in the poor response group (mice #4, 5) showed higher pretreatment Kep than those in the good response group (3.04, 1.67 vs. 0.89, 0.61). Two of the three mice in the poor response group (mice #3, 4) showed lower pretreatment Ve than those in the good response group (0.55, 0.42 vs. 0.61, 0.81). Two of the three mice in the poor response group (mice #3, 5) showed lower pretreatment volume than those in the good response group (270, 72 vs. 594, 1183) (Fig. 2). All the mice in the good response group showed marked reductions in Ktrans and SD value after the first radiation. Two of the three mice (mice #3, 4) in the poor response group showed increased Ktrans (K1R=1.50, 2.32 for mice #3, 4) and SD value (SD1R=2 for both mice) after the first radiation therapy (Fig. 3). All tumors showed increased volume after the first radiation therapy. However, two of the three mice in the poor response group (mice #3, 5) showed greater volume increments than those in the good response group (V1R=2.13, 2.78 for #3, 5 vs. 1.73, 1.33 for #1, 2).
DISCUSSION
Over the past few years, CCRT or radiation therapy has been increasingly used to treat malignant neoplasms including rectal cancer.18 Tumor vascularity and oxygenation status have long been advocated as important factors that influence tumor responses to radiation therapy.5 DCE-MRI combined with pharmacokinetic modeling has emerged as a promising noninvasive imaging technique for evaluating tumor microvasculature.6 Accordingly, previous studies suggested several DCE-MRI parameters for which to predict responses to radiation therapy in rectal cancer as well as other tumors. The most representative DCE-MRI derived parameter is the transfer constant, Ktrans. However, the DCE-MR derived parameter Ktrans is still controversial as a biomarker for which to evaluate radiation therapy. de Vries, et al.19 reported that high initial perfusion index (PI) value correlated with greater node down staging for radiation therapy in rectal tumor.8 Meanwhile, Sahani, et al.20 reported that initial high blood flow (BF) was negatively correlated with radiation therapy responses. They obtained BF as the representative parameter for their model using perfusion CT technique with the Johnson and Wilson model during 45 seconds of scan time. While De Vries, et al.19 obtained PI value, which was shown to be associated with contrast extraction fraction as well as with perfusion using T1 dynamic contrast enhanced MRI technique with semi-quantitative analysis over 4 minutes. Different types of imaging modalities, mathematic models, scan times, and post processing methods might explain the previous inconsistent results. Although our results showed that the responder group had a marked higher Ktrans value at baseline scanning, the results should be carefully interpreted because our sample size was too small and we used dynamic contrast enhanced MRI with Tofts two compartment model over one minute. Our results might support the hypothesis that the permeable vasculature may provide better oxygenation and showed efficient radiation sensitivity.22 In addition, the good response to treatment group tended to exhibit lower Kep and higher Ve. Some studies reported that the initial values of Kep and Ve might predict responses to radiation therapy.23-25 However, their use remains highly debated and is not yet wholly established. Although Kep also reflects vessel density, perfusion, and permeability, it proved to be not as sensitive to tumor oxygenation as Ktrans in this study. However, Kep may have been confounded by interstitial volume fraction (Ve) in the necrotic area.7
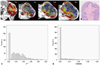
Early reductions in Ktrans among good responders are in agreement with previous studies,8,26 potentially indicating loss of immature tumor vessels. The good responders also showed early reductions in SD of Ktrans, demonstrating a more homogenous distribution. Distributions of variables, such as SD, add further information for which to distinguish malignancy from benign disease to improve diagnostic accuracy.11 Change in histogram heterogeneity has been reported in patients with rectal cancer after radiation therapy.27 Changes in tumor size were also previously suggested as a strong predictor of responses.10 In this study, good responders tended to show smaller volume increments than poor responders. However, tumor size change is not a perfect method for assessing the response of a tumor to treatment, as edema and necrosis refrain from measuring the exact tumor burden. For example, although mice #2 showed a good response and marked reduction in Ktrans, tumor size masked the real tumor burden due to internal necrosis (Fig. 4).
This study has several limitations. First, fractionated doses of radiation therapy and intervals between the fractionated doses might not be optimized to suppress endothelial cell proliferation. Second, though CCRT is widely used in the treatment of advanced colorectal cancer, our results were limited to radiation therapy.
In summary, the good response to radiation therapy group in a DLD-1 colon cancer xenograft mouse model exhibited higher pretreatment Ktrans and early reductions in Ktrans. Also, the distribution pattern of Ktrans in the early period of radiation therapy became more homogenous.
 XML Download